

Abstract
Aspartyl-(Asparaginyl)-β-Hydroxylase (AAH ) promotes cell motility by hydroxylating Notch. Insulin and insulin-like growth factor, type 1 (IGF-I) stimulate AAH through Erk MAP K and phosphoinositol-3-kinase-Akt (PI3K-Akt). However, hypoxia/oxidative stress may also regulate AAH . Hypoxia-inducible factor-1alpha (HIF-1α) regulates cell migration, signals through Notch, and is regulated by hypoxia/oxidative stress, insulin/IGF signaling and factor inhibiting HIF-1α (FIH) hydroxylation. To examine cross-talk between HIF-1α and AAH , we measured AAH , Notch-1, Jagged-1, FIH, HIF-1α, HIF-1β and the hairy and enhancer of split 1 (HE S-1) transcription factor expression and directional motility in primitive neuroectodermal tumor 2 (PNET2) human neuronal cells that were exposed to H2O2 or transfected with short interfering RNA duplexes (siRNA) targeting AAH , Notch-1 or HIF-1α. We found that: (1) AAH , HIF-1α and neuronal migration were stimulated by H2O2; (2) si-HIF-1α reduced AAH expression and cell motility; (3) si-AAH inhibited Notch and cell migration, but not HIF-1α and (4) si-Notch-1 increased FIH and inhibited HIF-1α. These findings suggest that AAH and HIF-1α crosstalk within a hydroxylation-regulated signaling pathway that may be transiently driven by oxidative stress and chronically regulated by insulin/IGF signaling.
1. Introduction
Aspartyl-(Asparaginyl)-β-Hydroxylase (AAH) is overexpressed in highly invasive malignant neoplasms, [1, 2] including primitive neuroectodermal tumor (PNET) cells of central or peripheral nervous system origin [3, 4]. A direct role for AAH in cell motility and invasion is supported by the findings that: (1) overexpression of AAH increases cell motility; (2) inhibition of AAH via gene silencing reduces cell motility; and (3) inhibition of signaling pathways required for AAH expression and function impairs cell motility [5]. AAH catalyzes the hydroxylation of aspartyl and asparaginyl residues in epidermal growth factor (EGF)-like domains [6] of proteins such as Notch and Jagged [7, 8], which have known roles in cell migration [9, 10]. Correspondingly, Jagged, the ligand for Notch, is a substrate for AAH hydroxylation [8], and AAH is capable of physically interacting with both Notch and Jagged [11]. Moreover, overexpression of AAH results in increased nuclear translocation and accumulation of Notch and activation of Notch's downstream target genes, including the transcription factor, hairy and enhancer of split 1 (HES-1) [11].
Hypoxia inducible factor 1 (HIF-1) is an essential mediator of molecular signaling for cellular oxygen sensing and regulates hypoxic responses in nearly all vertebrate cell types by serving as a transcription factor for hypoxia-inducible genes [12]. HIF-1 is composed of two subunits: HIF-1β, which is constitutively expressed, and HIF-1α, which is tightly regulated by oxygen-dependent prolyl hydroxylases [13]. Under normoxic conditions, HIF-1α's transcriptional activity is negatively regulated by the asparaginyl hydroxylase, factor inhibiting HIF (FIH) [14, 15]. FIH mediates this effect by hydroxylating HIF-1α, thereby enabling HIF-1α's interaction with the von Hippel-Lindau protein complex, resulting in its ubiquitination and degradation via the proteasomal pathway [16]. However, low oxygen tension is rate-limiting for prolyl hydroxylase activity. Consequently, under hypoxic conditions, HIF-1α becomes stabilized due to reduced ubiquitination and proteosomal degradation [17]. In addition, HIF-1α gene expression is stimulated by insulin, IGF-1 and IGF-2 [18]. Transcriptionally activated HIF-1α binds to hypoxia-responsive elements (HRE) in the promoter or enhancer regions of hypoxiainducible genes such as insulin-like growth factor, type 2 (IGF-2), erythropoietin and vascular endothelial growth factor [13, 19].
Previous studies linked activation of HIF-1 signaling to increased cell motility in both malignant neoplastic cells [20–22], and cellular constituents required for skin wound healing [23]. Moreover, other studies showed that Notch signaling is sensitive to oxygen tension [24] and can be activated by hypoxia [25–27]. Finally, Gustafsson et al. [25] demonstrated that HIF-1α could interact with Notch's intracellular domain and induce Notch-mediated downstream responses. These findings drew our attention because both AAH and HIF-1 belong to hydroxylation signaling networks and mediate their effects through Notch. Moreover, in exploratory studies, we found that AAH expression was stimulated by oxidative stress, and that mild oxidative stress increased cell motility, suggesting potential cross-talk between HIF-1α and AAH signaling pathways. We now characterize the inter-relationships among AAH, HIF-1α, Notch and oxidative stress with respect to motility in human central nervous system (CNS) derived neuronal cells.
2. Results
Oxidative stress stimulates AAH and HIF-1α protein expression. PNET2 human CNS-derived primitive neuroectodermal tumor 2 (PNET2) neuronal cells were seeded into 96-well plates and treated with 0–45 μM H2O2 for 20 h to examine the effects of oxidative stress on AAH, HIF-1α, HIF-1β and FIH expression using a cellular enzyme-linked immunosorbant assay (ELISA). Results were normalized to β-Actin (control) immunoreactivity measured in parallel reactions. All four proteins exhibited H2O2 dose-dependent shifts in immunoreactivity, generally at concentrations between 9 and 27 μM (Figures 1A–1D). Area under the curve calculations were used to compare the magnitude of H2O2-induced increases in protein expression by one-way ANOVA with the post-hoc Tukey test. Those analyses demonstrated significantly greater H2O2 stimulated levels of HIF-1α and AAH relative to HIF-1β and FIH immunoreactivity (p < 0.0001; Figure 1E).
Figure 1.
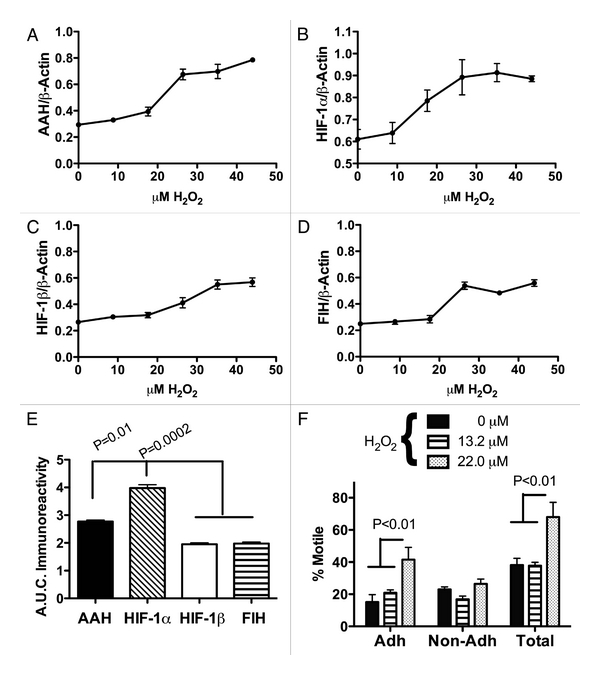
Oxidative stress stimulates AAH and HIF-1α expression and increases directional motility. Human PNET2 neuronal cells were treated with 0 to 44 μM H202 for 16 h. Cells were harvested to measure immunoreactivity corresponding to (A) AAH, (B) HIF-1α, (C) HIF-1β or (D) FIH by direct binding ELISA. Immunoreactivity was detected with HRP conjugated secondary antibody and Amplex Red fluorophore (Ex 530 nm/Em 590 nm) and quantified in an M = 5 Spectramax microplate reader. Results were normalized to β-actin immunoreactivity measured in replicate assays (see Methods). Results in (A–D) depict changes in mean ± S.E.M. levels of immunoreactivity with increasing H2O2 dose in 8 replicate assays. (E) Area under the curve (A.U.C.) was calculated for each dose-response curve and inter-group statistical comparison of the mean A.U.C.s was made using a one-way repeated measures ANOVA with the post-hoc Tukey-Kramer multiple comparisons test for significance. (F) Effect of H2O2 treatment (13.2 μM or 22 μM) on directional motility was assessed using the ATP Luminescence-Based Motility and Invasion (ALMI) assay. Graphs depict the mean ± S.E.M. percentages of motile adherent (Adh), motile non-adherent (Non-Adh) and total motile (Total) cells for each H2O2 dose. Inter-group comparisons were made using ANOVA and post hoc Tukey Kramer tests. Significant p-values are shown above the bars.
Oxidative stress promotes cell motility. We next examined the effects of oxidative stress on PNET2 cell directional motility using a more limited range of H2O2 treatment, i.e., 13.2 or 22 μM. The 13.2 μM of H2O2 dose was below the level associated with increased AAH or HIF-1α expression, whereas 22 μM H2O2 was within the optimum concentration range for stimulating these proteins. Using the ATP Luminescence Motility and Invasion (ALMI) assay [28], we observed that treatment with H2O2 significantly altered cell motility (F = 10.9, 3 df, p = 0.004), and that cells treated with 22 μM H2O2 had significantly higher mean directional motility indices relative to cells that had been treated with vehicle (p < 0.01) or 13.2 μM (p < 0.05) H2O2 (Figure 1F). In addition to total cell motility, the ALMI assay measures the percentages of motile adherent and motile non-adherent cells, and therefore provides information on cell adhesion [28]. The same experiments demonstrated that treatment with 22 μM H2O2 mainly increased the percentages of motile-adherent cells (p < 0.01), indicating that the increased motility was not caused by loss of adhesion (Figure 1F).
Inhibition of AAH or HIF-1α expression impairs neuronal motility. PNET2 cells transfected with short interfering RNA duplexes targeting AAH (si-AAH) or HIF-1α (si-HIF-1α) had significantly lower mean total motility indices relative to si-Scr (negative control) transfected cells (Figure 2A). The major inhibitory effects of si-AAH and si-HIF-1α on motility were related to the motile-adherent populations (Figure 2B), whereas the percentages of motile non-adherent cells remained relatively unchanged compared with si-Scr transfected control cells (Figure 2C).
Figure 2.
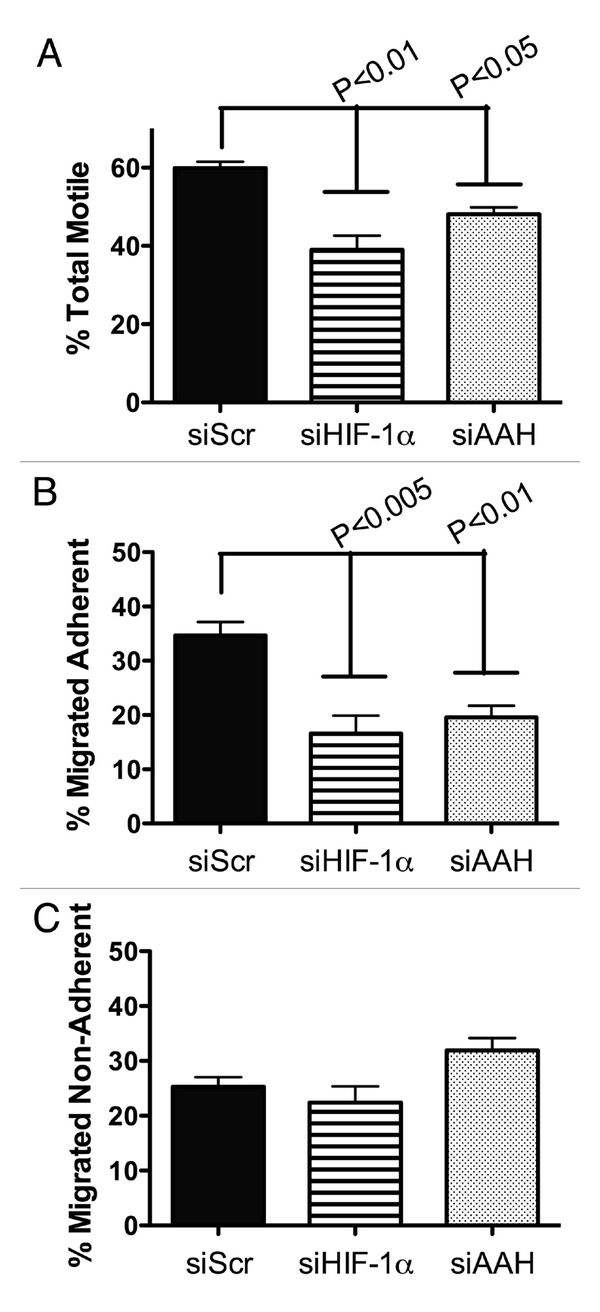
Inhibition of HIF-1α or AAH impairs directional motility. PNET2 cells were transfected with siRNA targeting no specific sequences(siScr), HIF-1α (siHIF-1α) or AAH (siAAH ) using the Amaxa electroporation system (see Methods). 24 hours later, directional motility was measured using the ALMI assay, which enables one to quantify the percentages of non-motile, motile-adherent and motile non-adherent cells. The total percentage of motile cells was calculated from the sum percentages of motile adherent plus motile non-adherent cells. The graphs depict the mean ± S.E.M percentages of (A) total motile, (B) motile adherent and (C) motile non-adherent cells after 30 min incubation in blind-well Boyen chambers. 2% fetal bovine serum was supplied in the lower chamber as a trophic factor. Inter-group statistical comparisons were made using one-way ANOVA with the post hoc Tukey-Kramer significance test. Significant p-values are indicated over the bars.
Cross-talk among HIF-1α, AAH and Notch signaling mechanisms. PNET2 cells were transfected with si-AAH, si-HIF-1α, si-Notch-1 or recombinant plasmid expressing AAH cDNA under a CMV promoter. 24–48 hours later, gene expression was measured by qRT-PCR (Figures 3 and 4) and immunoreactivity was measured by ELISA (Tables 2–5). Cells transfected with si-HIF-1α had significantly reduced levels of AAH mRNA, whereas si-AAH transfection had no significant effect on HIF-1α mRNA levels (Figures 3A and 3B). Cells transfected with either si-AAH or si-HIF-1α had significantly reduced levels of Jagged-1 and HES-1 and cells transfected with si-HIF-1α also had reduced levels of FIH mRNA (Figures 3C, E and F). In contrast, Notch-1 mRNA was not inhibited by transfection with si-AAH or si-HIF-1α (Figure 3D). si-RNA silencing of Notch-1 (Figure 4A) significantly reduced the mean mRNA levels of HES-1 (Figure 4C), while increasing expression of HIF-1α (Figure 4E), and not significantly altering expression of Jagged-1, AAH or FIH (Figure 4).
Figure 3.
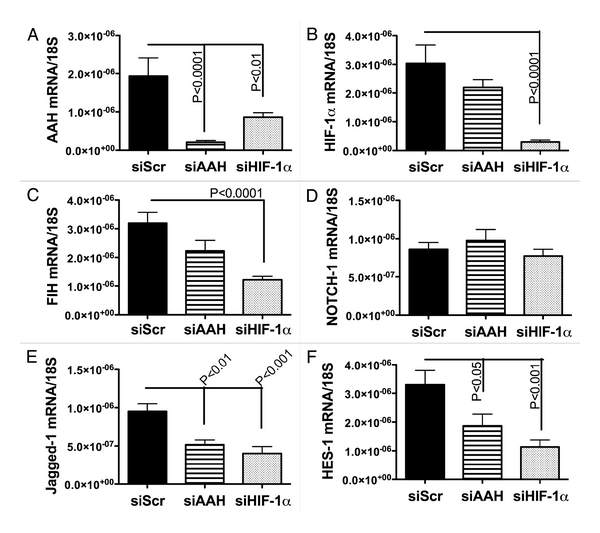
Effects of siAAH and HIF-1α transfection on PNET cell mRNA expression of target genes. PNET cells were transfected with siAAH, siHIF-1α or negative control siSCR. Total RNA was isolated from cells and reverse transcribed. The resulting cDNA templates were used in qPCR amplification assays. The mRNA levels were normalized to 18s rRNA measured in parallel reactions. Graphs depict the mean relative mRNA ± S.E.M levels of (A) AAH, (B) HIF-1α, (C) FIH, (D) Notch-1, (E) Jagged-1 and (F) HES-1. Inter-group comparisons were made using one-way ANOVAs with the post hoc Tukey-Kramer significance test. Significant p-values are indicated over the bars.
Figure 4.
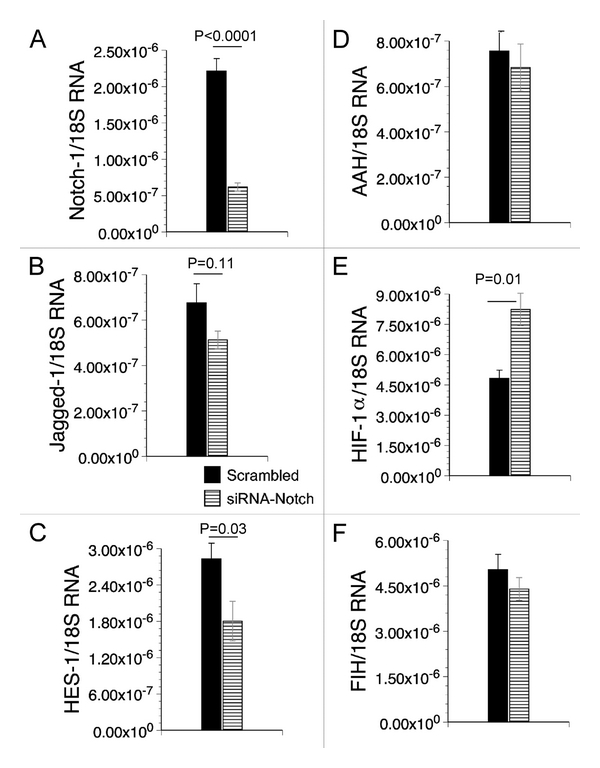
Effects of siNotch-1 transfection on PNET cell mRNA expression of target genes. PNET cells were transfected with either siNotch-1 or negative control, siSCR. Total RNA was isolated from cells and reverse transcribed. The resulting cDNA templates were used in qPCR amplification assays. The mRNA levels were normalized to 18S rRNA measured in parallel reactions. Graphs depict the mean relative mRNA ± S.E.M levels of (A) Notch-1, (B) Jagged-1, (C) HES-1, (D) AAH, (E) HIF-1α and (F) FIH. Inter-group comparisons were made using Student t-tests. Significant p-values are shown over the bars.
Cellular ELISA studies revealed that si-AAH transfection significantly increased the mean levels of HIF-1α, HIF-1β and Jagged-1 and decreased FIH, β-actin, AAH and Humbug immunoreactivities (Table 2). In contrast, overexpression of AAH in cells transfected with recombinant plasmid containing full-length AAH cDNA significantly increased Notch-1, but decreased HIF-1β protein (Table 3). Cells transfected with si-Notch had significantly increased levels of HIF-1α and HIF-1β protein expression and reduced levels of Notch-1, Jagged-1, AAH and Humbug (a catalytically inactive homolog of AAH) [7, 11, 29] immunoreactivity (Table 4). Finally, transfection with si-HIF-1α significantly reduced HIF-1α immunoreactivity while significantly increasing HIF-1β, FIH, β-Actin, Notch-1, Jagged-1 and AAH immunoreactivity (Table 5). These results are consistent with recent findings demonstrating that hypoxia and HIF-1α can potentiate Notch signaling [30, 31].
Table 2.
Effects of siAAH on AAH, NOTCH and HIF-1α signalingmolecules
| Protein | siScr | siAAH | p-value |
|---|---|---|---|
| HIF-1α | 3983.1 ± 164.9 | 4562.7 ± 135.8 | 0.01 |
| HIF-1β | 2794.2 ± 264.2 | 4248.9 ± 280.3 | 0.001 |
| FIH | 487.0 ± 76.6 | 324.8 ± 31.6 | 0.04 |
| β-Actin | 1586.0 ± 42.4 | 967.5 ± 99.1 | <0.0001 |
| Notch-1 | 140.0 ± 3.1 | 153.7 ± 20.5 | |
| Jagged-1 | 141.0 ± 5.0 | 211.6 ± 27.2 | 0.01 |
| AAH | 722.5 ± 17.9 | 610.9 ± 4.8 | <0.0001 |
| Humbug | 682.0 ± 16.8 | 619.7 ± 5.6 | 0.0005 |
Cultured PNET cells were transiently transfected with siAAH or siScr (negative control) RNA duplexes. Immunoreactivity was measured by direct binding ELISA (see Methods; N = 8/group) with HRP-conjugated secondary antibodies and Amplex Red soluble fluorophor. Fluorescence light units (FLU) were measured in a Spectramax 5 (Ex 579 nm/ Em 595 nm). Data represent mean ± S.E.M. FLU corrected for protein loading. Between group comparisons were made using Student t-tests. Computer-generated significant p-values are listed in Column 4.
Table 3.
Effects of pAAH on NOTCH and HIF-1α signaling molecules
| Protein | GFP-cDNA | AAH-cDNA | p-value |
|---|---|---|---|
| HIF-1α | 4666.1 ± 154.6 | 4109.5 ± 281.9 | |
| HIF-1β | 3723.4 ± 264.2 | 3125.7 ± 280.3 | 0.02 |
| FIH | 204.3 ± 23.8 | 193.6 ± 16.6 | |
| β-Actin | 821.1 ± 39.1 | 784.8 ± 43.3 | |
| Notch-1 | 166.7 ± 9.9 | 234.8 ± 9.6 | 0.0003 |
| Jagged-1 | 366.2 ± 68.4 | 385.5 ± 28.1 |
Cultured PNET cells were transfected with recombinant plasmid DNA carrying full-length AAH or green fluorescent protein (GFP; negative control) cDNA, and 24 hours later, immunoreactivity was measured by direct binding ELISA (see Methods; N = 8/group) with HRP-conjugated secondary antibodies and Amplex Red soluble fluorophor. Fluorescence light units (FLU) were measured in a Spectramax 5 (Ex 579 nm/Em 595 nm). Data represent mean ± S.E.M. FLU corrected for protein loading. Between group comparisons were made using Student t-tests. Computer-generated significant p-values are listed in Column 4.
Table 4.
Effects of siHIF-1α on AAH, NOTCH and HIF-1α signaling
| Protein | siScr | siHIF-1α | p-value |
|---|---|---|---|
| HIF-1α | 6333.3 ± 249.1 | 4374.2 ± 229.3 | <0.0001 |
| HIF-1β | 3546.4 ± 286.2 | 5551.5 ± 507.7 | 0.001 |
| FIH | 4748.8 ± 318.5 | 9337.0 ± 425.4 | <0.0001 |
| β-Actin | 16168 ± 1163 | 21068 ± 1703 | 0.013 |
| Notch-1 | 2668.9 ± 241.9 | 4563.1 ± 481.3 | 0.0009 |
| Jagged-1 | 4766.6 ± 740.8 | 11715 ± 1493 | 0.0001 |
| AAH | 7754.1 ± 844.5 | 12549 ± 1127 | 0.001 |
| Humbug | 7016.7 ± 1161.9 | 9505.3 ± 1017.4 |
Cultured PNET cells were transfected with siScr (negative control) or siHIF-1α RNA duplexes, and 48 h later, cells were harvested to measure immunoreactivity by direct binding ELISA (see Methods; N = 8/group) using HRP-conjugated secondary antibodies and Amplex Red soluble fluorophor. Fluorescence light units (FLU) were measured in a Spectramax 5 (Ex 579 nm/Em 595 nm). Data represent mean ± S.E.M. FLU corrected for protein loading. Between group comparisons were made using Student t-tests. Computer-generated significant p-values are listed in Column 4.
Table 5.
Effects of siNOTCH on AAH, NOTCH and HIF-1α signaling
| Protein | siScr | siHIF-1α | p-value |
|---|---|---|---|
| HIF-1α | 497.3 ± 4.2 | 529.5 ± 8.7 | 0.0008 |
| HIF-1β | 478.3 ± 4.2 | 539.3 ± 8.0 | <0.0001 |
| FIH | 495.8 ± 3.6 | 485.6 ± 8.5 | |
| β-Actin | 225.9 ± 27.6 | 158.8 ± 34.8 | |
| Notch-1 | 344.1 ± 52.7 | 108.7 ± 24.9 | 0.001 |
| Jagged-1 | 201.7 ± 8.1 | 163.5 ± 14.9 | 0.024 |
| AAH | 722.5 ± 17.9 | 610.9 ± 4.8 | <0.0001 |
| Humbug | 682.0 ± 16.8 | 619.7 ± 5.6 | 0.0005 |
Cultured PNET cells were transfected with siScr (negative control) or siNotch-1 RNA duplexes, and 48 h later, cells were harvested to measure immunoreactivity by direct binding ELISA (see Methods; N = 8/group) using HRP-conjugated secondary antibodies and Amplex Red soluble fluorophor. Fluorescence light units (FLU) were measured in a Spectramax 5 (Ex 579 nm/Em 595 nm). Data represent mean ± S.E.M. FLU corrected for protein loading. Between group comparisons were made using Student t-tests. Computer-generated significant p-values are listed in Column 4.
3. Discussion
This study was designed to investigate the role of cross-talk between AAH and HIF-1α as a means of regulating cell motility. First, we demonstrated that AAH and HIF-1α expression and directional motility in PNET2 CNS-derived neuronal cells were stimulated by mild oxidative stress induced by low dose H2O2 treatments. Then, we showed that si-RNA inhibition of either AAH or HIF-1α significantly impaired directional motility, particularly with regard to adherent cells. These results indicate that oxidative stress regulates expression of both AAH and HIF-1α, and that both molecules play key roles in regulating cell motility. Since both AAH and HIF-1α are also regulated by insulin/IGF stimulation [4, 18, 32], dual signaling pathways and mechanisms modulate cell motility. It would seem that while insulin/IGF regulatory mechanisms are important for effectuating long-term changes in cellular responses, including at the level of transcription [33], the role of redox regulation and signaling may be to modulate short-term responses to environmental cues such as those produced by acute injury. Whether AAH and/or Notch have protective roles in the context of oxidative stress, as previously demonstrated for DJ-1, which is induced in astrocytes in response to ischemic injury [34], or H2O2-removing enzymes, such as catalase, which is induced in hypercoagulable states that cause ischemic injury [35], cannot be determined from the data at hand. However, since si-RNA inhibition of AAH and HIF-1α impaired motility and not cell viability, it is unlikely that either molecule mediates anti-stress responses at the low levels of oxidative stress produced in our experiments.
Given the overlapping mechanisms of gene regulation, their roles in cell motility, and the fact that AAH is a hydroxylase enzyme while HIF-1α is regulated by FIH, which is also a hydroxylase enzyme, it was of interest to explore potential functional connections between AAH and HIF-1α. The main approach used was to inhibit gene expression through transient transfection of PNET2 cells with siRNA duplexes and examine the effects on AAH, HIF-1α and related signaling molecules by qRT-PCR analysis and ELISA. The findings that both si-AAH and si-HIF-1α inhibited AAH mRNA, while si-HIF-1α inhibited HIF-1α and si-AAH did not, place HIF-1α upstream of AAH in terms of gene regulation and functionally connect these genes at the level of transcription. At the protein level however, the effects were mixed in that si-RNA suppression of AAH caused parallel shifts in expression of Humbug, a truncated AAH-related protein [7, 8], but had either no effect, or it significantly increased HIF-1α and/or HIF-1β expression. Transfection with si-HIF-1α did not suppress AAH or Humbug protein expression. While the explanation for this discrepancy is not clear, conceivably other interconnecting pathways may permit AAH protein stabilization under normoxic conditions, including trophic factor stimulation (insulin/IGF in medium). In this regard, it is noteworthy that trophic factors stimulate Akt and inhibit glycogen synthase kinase 3β (GSK-3β). Since GSK-3β phosphorylates and destabilizes both AAH [3, 36] and HIF-1α [37], si-RNA inhibition of HIF-1α may not necessarily inhibit AAH protein in the context of trophic factor inhibition of GSK-3β.
Under normoxic conditions, FIH hydroxylates HIF-1α, signaling it to undergo degradation. Under hypoxic conditions, FIH's hydroxylase is inactivated, permitting HIF-1α to enter the nucleus where it serves as a transcription factor. Our results demonstrate that, in addition to hypoxia, mild oxidative stress (induced with H2O2) preserves HIF-1α protein. Thus, we propose that mild oxidative stress stimulates cell motility and regulates AAH protein expression by inhibiting FIH hydroxylation of HIF-1α, allowing HIF-1α to enter the nucleus and serve as a transcription factor for AAH.
Previous studies demonstrated that AAH mediates its effects on cell motility by interacting with and hydroxylating Notch and Jagged [8], and that a downstream target of Notch signaling is HES-1 [38]. Since Notch-1 stimulates HES-1 transcription [39], the reductions in HES-1 mRNA associated with si-RNA inhibition of AAH and HIF-1α suggest that Notch transcriptional activity is regulated by both AAH and HIF-1α. As demonstrated herein and in previous reports, overexpression of AAH increases Notch-1 protein levels [11]. In addition, AAH overexpression stimulates Notch's translocation to the nucleus where it regulates gene expression [11]. Once in the nucleus, Notch-1 serves as a transcription factor for other genes involved in motility. However, since si-AAH had no significant effect on Notch's mRNA levels, AAH's regulation of Notch is most likely mediated by post-translational mechanisms. Downstream Notch-regulated target genes that mediate cell motility include E-Cadherin [30], tenascin C [40], and other genes that regulate cell adhesion [41].
Jagged is a ligand for Notch, and its binding to Notch is needed for Notch cleavage and its release from the membrane for translocation to the nucleus [42, 43]. The finding that both si-AAH and si-HIF decreased Jagged-1 expression suggests an additional mechanism by which AAH and HIF-1α regulate Notch signaling. The si-HIF-1α inhibition of HES-1 mRNA could be explained by HIF-1α's ability to interact with the intracellular domain of Notch-1 [25], or regulate AAH mRNA expression. The reduced expression of FIH mRNA effectuated by si-AAH or si-HIF-1α transfection could represent a feedback mechanism to negatively regulate HIF-1α and eventually AAH expression, thereby halting cell motility.
We summarize our proposed scheme for extrinsic regulation and cross-talk between the AAH-Notch- Jagged-HES and FIH-HIF-1α hydroxylase signaling pathways in Figure 5. In brief, insulin and IGF regulate AAH and HIF-1α protein expression and function through posttranslational mechanisms including phosphorylation and attendant inhibition of GSK-3β activity. In addition, insulin and IGF stimulate AAH and HIF-1α gene expression, increasing their mRNA levels. Oxidative stress and hypoxia activate HIF-1α signaling by inhibiting FIH. This results in HIF-1α-mediated increases in AAH mRNA. Attendant increases in AAH protein expression lead to increased interactions between AAH and Notch/Jagged. AAH and HIF-1α both increase Notch signaling and cell motility. AAH functions by interacting with and hydroxylating Notch and Jagged. The cleaved N-terminal fragment of Notch translocates to the nucleus where it functions as a transcription factor and regulates target genes such as HES-1. HIF-1α potentiates Notch signaling via the mastermind-like protein 1 (MAML1) co-activator, with attendant stimulation of Notch target genes including HES-1 and HEY-1 [30]. Increased Notch signaling through HES enhances expression of hypoxia responsive elements and hypoxia-inducible genes. However, attendant increased expression of FIH could serve as a negative feed-back mechanism for HIF-1α-AAH-Notch signaling. Notch activated signaling increases cell motility in part by altering expression of cell adhesion molecules [30, 40, 41]. We hypothesize that AAH and HIF-1α cross-talk within a hydroxylation-regulated signaling pathway that is transiently driven by fluctuations in oxidative stress, while more sustained stimulation of motility is mediated by signaling through insulin/IGF cascades. Therefore, therapeutic measures to prevent or limit invasion and metastatic spread of neuroblastic tumor cells will likely require inhibition of both redox- and growth factor-mediated mechanisms. Prevention of neuroblastic tumor metastasis will likely require inhibition of growth factor and redox-mediated mechanisms.
Figure 5.
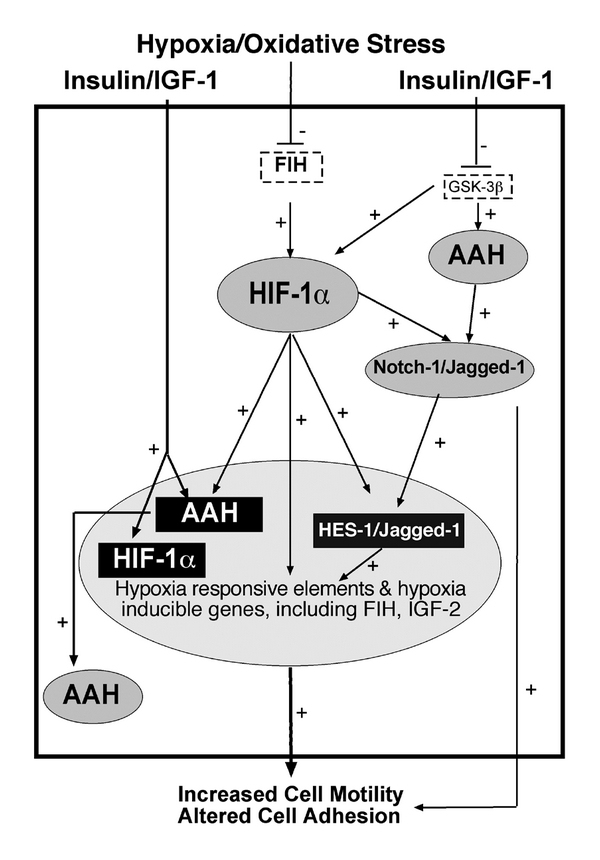
Proposed scheme for extrinsic regulation and cross-talk between the AAH-Notch-Jagged-HES and FIH-HIF-1α hydroxylase signaling pathways. Large shaded oval toward the bottom of the diagram represents the nucleus, large rectangle represents the cytoplasm and outside the rectangle, extrinsic stimuli and cellular responses are indicated. Small shaded ovals represent proteins, black shaded rectangles represent genes and dash-lined rectangles depict post-transcriptional regulators of AAH and HIF-1α signaling. Pluses correspond to positive stimulatory effects and minus signs represent inhibitory effects. Insulin and IGF regulate AAH and HIF-1α through inhibition of GSK-3β and by increasing their mRNA levels. Oxidative stress and hypoxia activate HIF-1α via inhibition of FIH, resulting in increased AAH gene expression. Both AAH and HIF-1α increase Notch signaling. AAH interacts with and hydroxylates Notch and Jagged, resulting in nuclear translocation of Notch and increased expression of Notch-regulated genes, e.g., HES-1. HIF-1α potentiates Notch signaling and stimulation of Notch target genes [30]. Consequences include increased expression of hypoxia responsive elements and hypoxia-inducible genes that promote cell motility and alter cell adhesion.
4. Methods
Cell culture. Human CNS-derived Primitive Neuroectodermal Tumor 2 (PNET2) cells [44] were maintained as previously described [3, 32]. We examined the effects of oxidative stress on HIF-1α, AAH and FIH expression by treating 96-well microcultures with 0–45 μM H2O2 for 20 h and measuring immunoreactivity by a cellular enzyme-linked immunosorbent assay (ELISA) [45]. The protocol for the H2O2 exposures was based on previous studies demonstrating that CNS neuronal cells exhibit oxidative injury, but remain viable with altered gene expression, 24 to 48 hours after treatment with up to 45 μM H2O2 [46, 47]. Applying a more limited dose range of H2O2 (0, 13.2 and 22 μM), we examined the effects of mild oxidative stress on directional motility. We assessed cross-talk among the AAH, FIH, HIF-1α and Notch signaling pathways in cells transfected with commercially prepared (Dharmacon, Inc., Chicago, IL) small interfering RNA duplexes (si-RNA) that targeted the AAH (ASPH NM_004318), HIF-1α (NM_001530, NM_181054) or Notch-1 (NM_0176617) genes. Finally, we examined the consequences of AAH overexpression in cells transfected with recombinant plasmid carrying the full-length AAH cDNA (pAAH) in which gene expression was under the control of a CMV promoter [1]. Control cells were transfected with recombinant plasmid carrying the green fluorescent protein gene (pGFP). Cells were transfected in suspension using the Amaxa “v” nucleofector cell line reagents and the Amaxa nucleofector apparatus (Amaxa, Inc., Gaithersburg, MD) according to the manufacturer's protocol. With this approach, we consistently achieved 75–90% transfection efficiencies as determined by GFP labeling of co-transfected cells. 16–24 hours later, cells were used to examine protein and mRNA expression.
Quantitative reverse transcriptase polymerase chain reaction (qRT-PCR) analysis. We used qRT-PCR to measure mRNA expression [11, 48, 49]. In brief, cells were lysed in Qiazol reagent (Qiagen Inc., Valencia, CA) and total RNA was isolated using the EZ1 RNA universal tissue kit and the BIO Robot EZ1 (Qiagen, Inc.). RNA was reverse transcribed using random oligodeoxynucleotide primers and the AMV First Strand cDNA synthesis kit (Roche Diagnostics Corporation, Indianapolis, IN). The resulting cDNA templates were used in qPCR amplification reactions with gene specific primer pairs (Table 1) [48]. Primers were designed using MacVector 10 software (MacVector, Inc., Cary, NC) and their target specificity was verified using NCBI-BLAST (Basic Local Alignment Search Tool). The amplified signals from triplicate reactions were detected and analyzed using the Mastercycler ep realplex instrument and software (Eppendorf AG, Hamburg, Germany). Relative mRNA abundance was calculated from the ng ratios of specific mRNA to 18S rRNA measured in the same samples. Inter-group statistical comparisons were made using the calculated mRNA/18S ratios.
Table 1.
Primer pairs for quantitative RT-PCR*
| Gene-specific primer | Forward/Reverse | Sequence 5'-3' | Position (mRNA) | Amplicon size (bp) |
|---|---|---|---|---|
| 18S rRNA | Forward | GGA CAC GGA CAG GAT TGA GCA | 1274 | 50 |
| 18S rRNA | Reverse | ACC CAC GGA ATC GAG AAA GA | 1323 | |
| AAH | Forward | GGG AGA TTT TAT TTC CAC CTG GG | 1650 | 257 |
| AAH | Reverse | CCT TTG GCT TTA TCC ATC ACT GC | 1906 | |
| HIF-1α | Forward | GCC TTG GAT GGT TTT GTT ATG G | 567 | 385 |
| HIF-1α | Reverse | TCA GCA CCA AGC AGG TCA TAG G | 951 | |
| FIH HIF | Forward | CTT ACC TCT AA C CTG CTG CTC ATT G | 619 | 196 |
| FIH HIF | Reverse | GAT TGT CAA AGT CCA CCT GGC T | 814 | |
| Notch-1 | Forward | AGG ACC TCA TCA ACT CAC ACG C | 6035 | 117 |
| Notch-1 | Reverse | CGT TCT TCA GGA GCA CAA CTG C | 6151 | |
| Jagged-1 | Forward | TGT CTG TCC CAC TGG TTT CTC | 1950 | 142 |
| Jagged-1 | Reverse | AGT TCT TGC CCT CAT AGT CCT CG | 2091 | |
| HES-1 | Forward | CCA AA G ACA GCA TCT GAG CA | 318 | 91 |
| HES-1 | Reverse | TCA GCT GGC TCA GAC TTT CA | 408 |
*Nucleic acid sequences of gene specific forward and reverse oligodeoxynucleotide primers used for quantitative RT-PCR analysis. Position refers to 5' binding site on cDNA. Amplicon is the length of the PCR amplified product in base pairs (bp).
Enzyme linked immunosorbent assay (ELISA). Cells were lysed in radioimmunoprecipitation assay (RIPA) buffer containing protease and phosphatase inhibitors [49, 50]. Protein concentrations were determined using the bicinchoninic acid (BCA) assay (Pierce, Rockford, IL). We performed direct binding ELISAs to measure AAH, HIF-1α, HIF-1β, FIH, Notch-1, Jagged-1 and β-Actin immunoreactivity. Samples containing 50 ng protein diluted in Tris-buffered saline, pH 7.4 (TBS) were adsorbed to the bottom flat surfaces of 96-well polystyrene plates (Nunc, Rochester, NY) overnight at 4°C [36]. Non-specific binding sites were blocked by a 3-hour room temperature incubation with 300 μl/well of TBS + 0.05% Tween 20 + 3% BSA. Samples were then incubated with 0.1–0.5 μg/ml primary antibody for 1 h at 37°C. Immunoreactivity was detected with horseradish peroxidase (HRP)-conjugated secondary antibody and Amplex Red soluble fluorophore (Molecular Probes, Eugene, OR) [36, 50]. Fluorescence was measured (Ex 530/Em 590) in a SpectraMax M5 microplate reader (Molecular Devices Corp., Sunnyvale, CA). Parallel negative control assays had primary, secondary or both antibodies omitted. Between steps, reactions were rinsed 3 times with TBS + 0.05% Tween 20 using a Nunc ELISA plate washer.
Microtiter immunocytochemical ELISA (MICE) assay. The MICE assay is a cellular ELISA that was used to measure the effects of oxidative stress on AAH, HIF-1α, FIH and β-Actin immunoreactivity directly in fixed cultured cells (96-well plates) [45]. The main modification of the original protocol was that immunoreactivity was measured with the Amplex Red fluorophore (Ex 579/Em 595) (Molecular Probes, Eugene, OR) instead of a colorimetric reagent. Cell density was assessed by subsequently staining the cells with Hoechst H33342 (Molecular Probes, Eugene, OR) and measuring fluorescence (Ex360 nm/Em460 nm) in a Spectramax M5 microplate reader (Molecular Dynamics, Inc., Sunnyvale, CA). The calculated ratios of fluorescence immunoreactivity to H33342 were used for inter-group comparisons. At least eight replicate cultures were analyzed in each experiment.
Directional motility assay. Directional motility was measured using the ATP Luminescence-Based Motility-Invasion (ALMI) assay [28]. Briefly, culture medium containing 2% FCS was placed in the lower chambers (Neuro Probe, Gaithersburg, MD) and 8-micrometer pore diameter polycarbonate filters divided the upper and lower chambers. 100,000 viable (Trypan Blue exclusion) PNET2 cells were seeded into the upper chambers and cell migration was allowed to proceed for 30 minutes at 37°C in a CO2 incubator. Cells collected from the upper chambers (non-motile), under surfaces of the filters (motile adherent) and bottoms of the wells (motile non-adherent) were quantified using ATPLite reagent (Perkin-Elmer, Waltham, MA) because ATP luminescence is linearly correlated with cell density [28]. Luminescence was measured in a TopCount Machine (Perkin-Elmer). The percentages of non-motile, motile adherent, motile non-adherent cells in 8 replicate assays were calculated and used for statistical analysis. Because this assay separately quantifies motile-adherent and motile-non-adherent sub-populations, it provides information about cell motility and adhesion.
Sources of reagents. QuantiTect SYBR Green PCR Mix was obtained from (Qiagen Inc.). Monoclonal antibodies to HIF-1α, HIF-1β, FIH and Notch-1 and Jagged-1, β-Actin and were purchased from Abcam Inc. (Cambridge, MA), Santa Cruz Biotechnology Inc. (Santa Cruz, CA) or Chemicon International (Tecumsula, CA). The 85G6 and 85E6 AAH and Humbug monoclonal antibodies were generated to human recombinant protein and purified over Protein G columns (Healthcare, Piscataway, NJ) [36].
Statistical analysis. Data depicted in the graphs represent the means ± S.E.M.'s for each group. Inter-group comparisons were made using Student t-tests or analysis of variance (ANOVA) with the Tukey post-hoc test. Statistical analyses were performed using the GraphPad Prism 5 software (San Diego, CA) and significant p-values (<0.05) are indicated over the graphs.
Acknowledgements
This research was supported by grants AA-11431, AA-12908 and AA-16126 from the National Institutes of Health. The authors also wish to acknowledge the assistance of Mr. Rolf Carlson and Ms. Donna Pratt for their support in conducting this research and preparing the manuscript.
References
- 1.Lavaissiere L, Jia S, Nishiyama M, et al. Overexpression of human aspartyl(asparaginyl)β-hydroxylase in hepatocellular carcinoma and cholangiocarcinoma. The Journal of Clinical Investigation. 1996;98(6):1313–1323. doi: 10.1172/JCI118918. [DOI] [PMC free article] [PubMed] [Google Scholar]
- 2.Ince N, de la Monte SM, Wands JR. Overexpression of human aspartyl (asparaginyl) β-hydroxylase is associated with malignant transformation. Cancer Research. 2000;60(5):1261–1266. [PubMed] [Google Scholar]
- 3.Carter JJ, Tong M, Silbermann E, et al. Ethanol impaired neuronal migration is associated with reduced aspartyl-asparaginyl-β-hydroxylase expression. Acta Neuropathologica. 2008;116(3):303–315. doi: 10.1007/s00401-008-0377-z. [DOI] [PMC free article] [PubMed] [Google Scholar]
- 4.Lahousse SA, Carter JJ, Xu XJ, Wands JR, de la Monte SM. Differential growth factor regulation of aspartyl-(asparaginyl)-β-hydroxylase family genes in SH-Sy5y human neuroblastoma cells. BMC Cell Biology. 2006;7, article 41 doi: 10.1186/1471-2121-7-41. [DOI] [PMC free article] [PubMed] [Google Scholar]
- 5.de la Monte SMDL, Tamaki S, Cantarini MC, et al. Aspartyl-(asparaginyl)-β-hydroxylase regulates hepatocellular carcinoma invasiveness. Journal of Hepatology. 2006;44(5):971–983. doi: 10.1016/j.jhep.2006.01.038. [DOI] [PubMed] [Google Scholar]
- 6.Monkovic DD, VanDusen WJ, Petroski CJ, et al. Invertebrate aspartyl/asparaginyl β-hydroxylase: potential modification of endogenous epidermal growth factor-like modules. Biochemical and Biophysical Research Communications. 1992;189(1):233–241. doi: 10.1016/0006-291x(92)91549-6. [DOI] [PubMed] [Google Scholar]
- 7.Dinchuk JE, Henderson NL, Burn TC, et al. Aspartyl β-hydroxylase (Asph) and an evolutionarily conserved isoform of Asph missing the catalytic domain share exons with junctin. The Journal of Biological Chemistry. 2000;275(50):39543–39554. doi: 10.1074/jbc.M006753200. [DOI] [PubMed] [Google Scholar]
- 8.Dinchuk JE, Focht RJ, Kelley JA, et al. Absence of post-translational aspartyl β-hydroxylation of epidermal growth factor domains in mice leads to developmental defects and an increased incidence of intestinal neoplasia. The Journal of Biological Chemistry. 2002;277(15):12970–12977. doi: 10.1074/jbc.M110389200. [DOI] [PubMed] [Google Scholar]
- 9.Cotter D, Honavar M, Lovestone S, et al. Disturbance of Notch-1 and Wnt signalling proteins in neuroglial balloon cells and abnormal large neurons in focal cortical dysplasia in human cortex. Acta Neuropathologica. 1999;98(5):465–472. doi: 10.1007/s004010051111. [DOI] [PubMed] [Google Scholar]
- 10.Christiansen JH, Coles EG, Wilkinson DG. Molecular control of neural crest formation, migration and differentiation. Current Opinion in Cell Biology. 2000;12(6):719–724. doi: 10.1016/s0955-0674(00)00158-7. [DOI] [PubMed] [Google Scholar]
- 11.Cantarini MC, de la Monte SM, Pang M, et al. Aspartyl-asparagyl β hydroxylase over-expression in human hepatoma is linked to activation of insulin-like growth factor and Notch signaling mechanisms. Hepatology. 2006;44(2):446–457. doi: 10.1002/hep.21272. [DOI] [PubMed] [Google Scholar]
- 12.Ryan HE, Lo J, Johnson RS. HIF-1α is required for solid tumor formation and embryonic vascularization. The EMBO Journal. 1998;17(11):3005–3015. doi: 10.1093/emboj/17.11.3005. [DOI] [PMC free article] [PubMed] [Google Scholar]
- 13.Semenza GL. HIF-1 and tumor progression: pathophysiology and therapeutics. Trends in Molecular Medicine. 2002;8(4):S62–S67. doi: 10.1016/s1471-4914(02)02317-1. [DOI] [PubMed] [Google Scholar]
- 14.Lando D, Peet DJ, Gorman JJ, Whelan DA, Whitelaw ML, Bruick RK. FIH-1 is an asparaginyl hydroxylase enzyme that regulates the transcriptional activity of hypoxia-inducible factor. Genes and Development. 2002;16(12):1466–1471. doi: 10.1101/gad.991402. [DOI] [PMC free article] [PubMed] [Google Scholar]
- 15.Lando D, Peet DJ, Whelan DA, Gorman JJ, Whitelaw ML. Asparagine hydroxylation of the HIF transactivation domain: a hypoxic switch. Science. 2002;295(5556):858–861. doi: 10.1126/science.1068592. [DOI] [PubMed] [Google Scholar]
- 16.Ivan M, Kondo K, Yang H, et al. HIFα targeted for VHL-mediated destruction by proline hydroxylation: implications for O2 sensing. Science. 2001;292(5516):464–468. doi: 10.1126/science.1059817. [DOI] [PubMed] [Google Scholar]
- 17.Sutter CH, Laughner E, Semenza GL. Hypoxia-inducible factor 1α protein expression is controlled by oxygen-regulated ubiquitination that is disrupted by deletions and missense mutations. Proceedings of the National Academy of Sciences of the United States of America. 2000;97(9):4748–4753. doi: 10.1073/pnas.080072497. [DOI] [PMC free article] [PubMed] [Google Scholar]
- 18.Feldser D, Agani F, Iyer NV, Pak B, Ferreira G, Semenza GL. Reciprocal positive regulation of hypoxia-inducible factor 1α and insulin-like growth factor 2. Cancer Research. 1999;59(16):3915–3918. [PubMed] [Google Scholar]
- 19.Schofield CJ, Ratcliffe PJ. Oxygen sensing by HIF hydroxylases. Nature Reviews Molecular Cell Biology. 2004;5(5):343–354. doi: 10.1038/nrm1366. [DOI] [PubMed] [Google Scholar]
- 20.Zagzag D, Nomura M, Friedlander DR, et al. Geldanamycin inhibits migration of glioma cells in vitro: a potential role for hypoxia-inducible factor (HIF-1α) in glioma cell invasion. Journal of Cellular Physiology. 2003;196(2):394–402. doi: 10.1002/jcp.10306. [DOI] [PubMed] [Google Scholar]
- 21.Yang MH, Wu KJ. TWIST activation by hypoxia inducible factor-1 (HIF-1): implications in metastasis and development. Cell Cycle. 2008;7(14):2090–2096. doi: 10.4161/cc.7.14.6324. [DOI] [PubMed] [Google Scholar]
- 22.Yang MH, Wu MZ, Chiou SH, et al. Direct regulation of TWIST by HIF-1α promotes metastasis. Nature Cell Biology. 2008;10(3):295–305. doi: 10.1038/ncb1691. [DOI] [PubMed] [Google Scholar]
- 23.Li W, Li Y, Guan S, et al. Extracellular heat shock protein-90α: linking hypoxia to skin cell motility and wound healing. The EMBO Journal. 2007;26(5):1221–1233. doi: 10.1038/sj.emboj.7601579. [DOI] [PMC free article] [PubMed] [Google Scholar]
- 24.Påhlman S, Stockhausen MT, Fredlund E, Axelson H. Notch signaling in neuroblastoma. Seminars in Cancer Biology. 2004;14(5):365–373. doi: 10.1016/j.semcancer.2004.04.016. [DOI] [PubMed] [Google Scholar]
- 25.Gustafsson MV, Zheng X, Pereira T, et al. Hypoxia requires Notch signaling to maintain the undifferentiated cell state. Developmental Cell. 2005;9(5):617–628. doi: 10.1016/j.devcel.2005.09.010. [DOI] [PubMed] [Google Scholar]
- 26.Coleman ML, McDonough MA, Hewitson KS, et al. Asparaginyl hydroxylation of the notch ankyrin repeat domain by factor inhibiting hypoxia-inducible factor. The Journal of Biological Chemistry. 2007;282(33):24027–24038. doi: 10.1074/jbc.M704102200. [DOI] [PubMed] [Google Scholar]
- 27.Zheng X, Linke S, Dias JM, et al. Interaction with factor inhibiting HIF-1 defines an additional mode of cross-coupling between the Notch and hypoxia signaling pathways. Proceedings of the National Academy of Sciences of the United States of America. 2008;105(9):3368–3373. doi: 10.1073/pnas.0711591105. [DOI] [PMC free article] [PubMed] [Google Scholar]
- 28.de la Monte SM, Lahousse SA, Carter J, Wands JR. ATP luminescence-based motility-invasion assay. BioTechniques. 2002;33(1):98–106. doi: 10.2144/02331rr01. [DOI] [PubMed] [Google Scholar]
- 29.Treves S, Feriotto G, Moccagatta L, Gambari R, Zorzato F. Molecular cloning, expression, functional characterization, chromosomal localization, and gene structure of junctate, a novel integral calcium binding protein of sarco(endo)plasmic reticulum membrane. The Journal of Biological Chemistry. 2000;275(50):39555–39568. doi: 10.1074/jbc.M005473200. [DOI] [PubMed] [Google Scholar]
- 30.Chen J, Imanaka N, Chen J, Griffin JD. Hypoxia potentiates Notch signaling in breast cancer leading to decreased E-cadherin expression and increased cell migration and invasion. British Journal of Cancer. 2010;102(2):351–360. doi: 10.1038/sj.bjc.6605486. [DOI] [PMC free article] [PubMed] [Google Scholar]
- 31.Sahlgren C, Gustafsson MV, Jin S, Poellinger L, Lendahl U. Notch signaling mediates hypoxia-induced tumor cell migration and invasion. Proceedings of the National Academy of Sciences of the United States of America. 2008;105(17):6392–6397. doi: 10.1073/pnas.0802047105. [DOI] [PMC free article] [PubMed] [Google Scholar]
- 32.Sepe PS, Lahousse SA, Gemelli B, et al. Role of the aspartyl-asparaginyl-β-hydroxylase gene in neuroblastoma cell motility. Laboratory Investigation. 2002;82(7):881–891. doi: 10.1097/01.lab.0000020406.91689.7f. [DOI] [PubMed] [Google Scholar]
- 33.Giovannone B, Scaldaferri ML, Federici M, et al. Insulin receptor substrate (IRS) transduction system: distinct and overlapping signaling potential. Diabetes/Metabolism Research and Reviews. 2000;16(6):434–441. doi: 10.1002/1520-7560(2000)9999:9999<::aid-dmrr159>3.0.co;2-8. [DOI] [PubMed] [Google Scholar]
- 34.Yanagida T, Tsushima J, Kitamura Y, et al. Oxidative stress induction of DJ-1 protein in reactive astrocytes scavenges free radicals and reduces cell injury. Oxidative Medicine and Cellular Longevity. 2009;2(1):36–42. doi: 10.4161/oxim.2.1.7985. [DOI] [PMC free article] [PubMed] [Google Scholar]
- 35.Pristov JB, Spasojevic I, Mikovic Z, Mandic V, Cerovic N, Spasic M. Antioxidative defense enzymes in placenta protect placenta and fetus in inherited thrombophilia from hydrogen peroxide. Oxidative Medicine and Cellular Longevity. 2009;2(1):14–18. doi: 10.4161/oxim.2.1.7705. [DOI] [PMC free article] [PubMed] [Google Scholar]
- 36.de la Monte SM, Tong M, Carlson RI, et al. Ethanol inhibition of aspartyl-asparaginyl-β-hydroxylase in fetal alcohol spectrum disorder: potential link to the impairments in central nervous system neuronal migration. Alcohol. 2009;43(3):225–240. doi: 10.1016/j.alcohol.2008.09.009. [DOI] [PMC free article] [PubMed] [Google Scholar]
- 37.Flügel D, Görlach A, Michiels C, Kietzmann T. Glycogen synthase kinase 3 phosphorylates hypoxia-inducible factor 1α and mediates its destabilization in a VHL-independent manner. Molecular and Cellular Biology. 2007;27(9):3253–3265. doi: 10.1128/MCB.00015-07. [DOI] [PMC free article] [PubMed] [Google Scholar]
- 38.Hooper C, Tavassoli M, Chapple JP, et al. TAp73 isoforms antagonize Notch signalling in SH-SY5Y neuroblastomas and in primary neurones. Journal of Neurochemistry. 2006;99(3):989–999. doi: 10.1111/j.1471-4159.2006.04142.x. [DOI] [PubMed] [Google Scholar]
- 39.Iso T, Kedes L, Hamamori Y. HES and HERP families: multiple effectors of the Notch signaling pathway. Journal of Cellular Physiology. 2003;194(3):237–255. doi: 10.1002/jcp.10208. [DOI] [PubMed] [Google Scholar]
- 40.Sivasankaran B, Degen M, Ghaffari A, et al. Tenascin-C is a novel RBPJκ-induced target gene for notch signaling in gliomas. Cancer Research. 2009;69(2):458–465. doi: 10.1158/0008-5472.CAN-08-2610. [DOI] [PubMed] [Google Scholar]
- 41.Mikhailik A, Mazella J, Liang S, Tseng L. Notch ligand-dependent gene expression in human endometrial stromal cells. Biochemical and Biophysical Research Communications. 2009;388(3):479–482. doi: 10.1016/j.bbrc.2009.07.037. [DOI] [PubMed] [Google Scholar]
- 42.Kopan R, Schroeter EH, Weintraub H, Nye JS. Signal transduction by activated mNotch: importance of proteolytic processing and its regulation by the extracellular domain. Proceedings of the National Academy of Sciences of the United States of America. 1996;93(4):1683–1688. doi: 10.1073/pnas.93.4.1683. [DOI] [PMC free article] [PubMed] [Google Scholar]
- 43.Schroeter EH, Kisslinger JA, Kopan R. Notch-1 signalling requires ligand-induced proteolytic release of intracellular domain. Nature. 1998;393(6683):382–386. doi: 10.1038/30756. [DOI] [PubMed] [Google Scholar]
- 44.The I, Murthy AE, Hannigan GE, et al. Neurofibromatosis type 1 gene mutations in neuroblastoma. Nature Genetics. 1993;3(1):62–66. doi: 10.1038/ng0193-62. [DOI] [PubMed] [Google Scholar]
- 45.de la Monte SM, Ganju N, Wands JR. Microtiter immunocytochemical ELISA assay. BioTechniques. 1999;26(6):1073–1078. doi: 10.2144/99266bm15. [DOI] [PubMed] [Google Scholar]
- 46.de la Monte SM, Neely TR, Cannon J, Wands JR. Oxidative stress and hypoxia-like injury cause Alzheimer-type molecular abnormalities in central nervous system neurons. Cellular and Molecular Life Sciences. 2000;57(10):1471–1481. doi: 10.1007/PL00000630. [DOI] [PMC free article] [PubMed] [Google Scholar]
- 47.de la Monte SM, Ganju N, Feroz N, et al. Oxygen free radical injury is sufficient to cause some Alzheimer-type molecular abnormalities in human CNS neuronal cells. Journal of Alzheimer's Disease. 2000;2(3-4):261–281. doi: 10.3233/jad-2000-23-406. [DOI] [PubMed] [Google Scholar]
- 48.Gundogan F, Elwood G, Longato L, et al. Impaired placentation in fetal alcohol syndrome. Placenta. 2008;29(2):148–157. doi: 10.1016/j.placenta.2007.10.002. [DOI] [PMC free article] [PubMed] [Google Scholar]
- 49.Lester-Coll N, Rivera EJ, Soscia SJ, Doiron K, Wands JR, de la Monte SM. Intracerebral streptozotocin model of type 3 diabetes: relevance to sporadic Alzheimer’s disease. Journal of Alzheimer’s Disease. 2006;9(1):13–33. doi: 10.3233/jad-2006-9102. [DOI] [PubMed] [Google Scholar]
- 50.Cohen AC, Tong M, Wands JR, de la Monte SM. Insulin and insulin-like growth factor resistance with neurodegeneration in an adult chronic ethanol exposure model. Alcoholism: Clinical and Experimental Research. 2007;31(9):1558–1573. doi: 10.1111/j.1530-0277.2007.00450.x. [DOI] [PubMed] [Google Scholar]