Abstract
Quantitative ultrasound (QUS) techniques have been widely used to estimate the size, shape and mechanical properties of tissue microstructure for specified regions of interest (ROIs). For conventional methods, an ROI size of 4 to 5 beamwidths laterally and 15 to 20 spatial pulse lengths axially has been suggested to estimate accuracy and precision better than 10% and 5%, respectively. A new method is developed to decrease the standard deviation of the quantitative ultrasound parameter estimate in terms of effective scatterer diameter (ESD) for small ROIs. The new method yielded estimates of the ESD within 10% of actual values at an ROI size of five spatial pulse lengths axially by two beamwidths laterally, and the estimates from all the ROIs had a standard deviation of 15% of the mean value. Such accuracy and precision cannot be achieved using conventional techniques with similar ROI sizes.
I. INTRODUCTION
The frequency dependence of ultrasonic backscattered signals can be related to microstructural properties of the biological media such as the shape and size of sub-resolution scatterers [1]–[3]. Specifically, quantitative ultrasound (QUS) techniques have been used to describe microstructure through parameters such as the effective scatterer diameter (ESD) [4]. QUS images can provide a new source of image contrast different from conventional B-mode imaging.
Typically, regions of interest (ROIs) are selected and the RF time signals corresponding to the selected ROIs are extracted using a gating function. Smaller ROIs are preferred because they result in improved spatial resolution of parametric images and because smaller ROIs are more likely to encompass tissue with uniform scattering properties. However, smaller ROIs can produce high-frequency fluctuations in the power spectra because of truncation that can result in biased estimates and larger standard deviation. Larger ROIs can produce smoother power spectra by compounding spectra from independent lines. However, larger ROIs reduce spatial resolution of QUS images and are more likely to include tissues with different scattering properties. Therefore, a trade-off exists between the size of the ROI, the spatial resolution of QUS imaging, and the bias and standard deviation of scatterer property estimates [5], [6].
In the current study, a Welch’s method [7] is used with small window sizes to provide additional improvement in estimation standard deviation. The subsequent bias of scatterer property estimates for small windows is compensated using a previously developed gate-edge correction method for ultrasonic backscatter [8].
II. THEORY
A scattered signal from a media with nearly identical scatterers located spatially at random can be written as
| (1) |
where h(t) is the impulse response that incorporates the electromechanical characteristics of the transducer and diffraction, N is the total number of scatterers in the volume, and s(t − ti) represents the echo signal from the ith scatterer located temporally at time t − ti. For simplicity, the impulse response h(t) is assumed to be shift-invariant here, but can be implemented using h(x, t) if required. The sign ⋆ represents the convolution operator. The backscattered power spectrum is the squared magnitude of the frequency domain scattered signal from a single scan line given by [5]
| (2) |
where the first and the second terms represent the incoherent and the coherent spectra, respectively. For a medium with randomly positioned scatterers, the form of N|S(f)|2 can be modeled assuming that the incoherent spectrum is the backscattered spectrum and the coherent spectrum is small and acts as noise to the estimation process. The presence of the coherent signal usually increases the bias and standard deviation of the QUS estimates.
In the present work, the Welch method is used to obtain smoother power spectra by compounding power spectra from overlapping windows. However, unlike the conventional Welch method, rectangular windows were used instead of tapered windows and smaller windows were used compared with conventional Welch techniques. Corrections for truncation error using the smaller windows were applied to reduce the bias of spectral estimates [8].
The smoothing of the backscattered power spectrum using Welch’s approach can be explained by considering scattering from a finite number of randomly located scatterers. The coherent part of the backscattered power spectrum results from a finite number of scatterers located within the range gate. The coherent part of the backscattered power spectrum is characterized by the cosine terms in (2). The frequency of the oscillations of the coherent spectrum are dictated by the separation of the scatterers in the range gate, tn − tm. Because of the smaller gate lengths in the Welch’s method the cosine terms with larger values of [tn − tm] are eliminated, which is similar to applying a low-pass filter on the coherent noise in the power spectrum. As a result of this filtering, the spectrum is smoothed.
When a time-domain signal is truncated using a rectangular window, the signal will be truncated at the edge of the signal with a sharp discontinuity, resulting in added low- and high-frequency components in the backscattered power spectrum. Oelze and O’Brien [8] developed a method to correct for truncation errors introduced by small gate lengths in ultrasonic backscatter. In the current work, the nonconventional Welch method is used in conjunction with the gate edge correction factor to decrease the bias and the standard deviation of the estimated ESD by using small Welch windows, i.e., windows only a few spatial pulse lengths (SPLs) long.
The new method is computationally costlier than the other two methods because it involves an iteration process for the algorithm to converge within the given tolerance limits. For all of the results shown here, the algorithm converged to the solution within two iterations using a 10% tolerance limit. Generally the computation time for the new method is linearly proportional to the number of iterations used (i.e., two iterations will take twice as long as the conventional method) because the ESD estimation algorithm is executed at each iteration.
III. SIMULATION AND EXPERIMENTAL METHODS
Simulations were conducted to predict the improvements afforded by combining the Welch’s method with small windows and the gate-edge correction technique. The software phantoms were constructed in MATLAB (The Mathworks Inc., Natick, MA) as discussed in a previous study [5]. A three-dimensional volume matrix was constructed that was 10 mm in depth, 20 mm in the direction parallel to the transducer face, and 2 mm in height. The simulated source was placed 50 mm from the front surface of the numerical phantom. The source consisted of a sinusoidal pulse with center frequency of 10 M Hz and a pulse length of approximately 1.5 cycles. The beamwidth (−6 dB) was 600 µm for the source, assuming a Gaussian beamwidth for an f/4 aperture having a focal length of 50.8 mm and aperture diameter of 12.7 mm. Scatterers were placed at random spatial locations in the phantom volume using a uniform probability density function; overlapping of scatterer locations was avoided.
The first simulation consisted of a software phantom containing spherical Gaussian scatterers with 15 scatterers per resolution cell volume on average. The spherical scatterers had an effective diameter of 50 µm, which corresponds to a ka value of 1 at the center frequency of the excitation pulse. The attenuation coefficient was set to 0.5 dB·MHz−1cm−1 in the phantom and the speed of sound was 1540 m/sec. The gate-edge correction factor was calculated. ROIs with different axial and lateral lengths were examined and the bias and standard deviation versus ROI size were estimated for ESD using the new method. For comparison, the estimates were also obtained using a conventional rectangular window covering the whole ROI axial length and a conventional Welch method. For the conventional Welch method, a Hanning window of half the size of the total ROI axial length was used for the Welch sub-gate length with a window overlap of 50%. Typically, the standard deviation is minimized with 50% overlap [9]. Multiple estimates of the ESD were obtained from different ROIs. The standard deviation and bias of the estimates were calculated to quantify the precision and accuracy of the estimation methods.
The second software phantom was constructed with a cylindrical lesion having a diameter of 6 mm located at the center. The height of the cylinder was equal to the height of the numerical phantom. The scatterers in the background and in the lesion had ESDs of 40 µm and 80 µm, respectively. The attenuation coefficient in the background and in the lesion was set to 0.5 dB·MHz−1cm−1. The scattered pulses were created based on the exact solution for scattering from glass spheres over the simulated source bandwidth [10]. QUS images were constructed of the simulated phantom and the contrast of the lesion in an image was assessed using the contrast-to-noise ratio (CNR) metric [11]. The CNR is defined as
| (3) |
where μB and μL are the mean brightness of the background and the target lesion and are the variance of the background and target lesion, respectively. CNR computations were conducted on the B-mode and ESD images. In this simulation, the exact location of the lesion was known. Therefore, the pixels within the lesion and outside the lesion are referred to as the target and the background, respectively. An increased variance of scatterer property estimates will result in more variations in pixel color both in the lesion and background of the ESD images. As a result, with larger variance in the scatterer property estimates, the CNR will degrade. It is predicted that improving the variance of scatterer property estimates using the new Welch’s method should result in improved contrast of the lesion as quantified by an increasing CNR.
Finally, to validate the simulations, experimental measurements were conducted on a tissue-mimicking phantom containing glass-bead scatterers of diameter 41 ± 2 µm placed spatially at random in an agar background. The phantom measurements were made with a single-element weakly-focused transducer (f/4) that had a 7.5-MHz center frequency as measured (resulting in a ka of ~0.61 at the center frequency). The transducer had a focal length and aperture diameter of 76.2 mm and 19.05 mm, respectively. The −6-dB pulse/echo bandwidth of the transducer was 6 M Hz and the −6-dB pulse/echo beamwidth at the focus was measured to be 0.8 mm using a wire technique [12]. The pulse reflected from the Plexiglas was used as the reference pulse in the spectral normalization.
The experiment was performed in the normal incident configuration, in which the normal to the transducer was perpendicular to the front surface of the phantom. The attenuation coefficient of 0.19 dB·MHz−1cm−1 was estimated from the physical phantom using an insertion loss method over a range of 1 to 18 M Hz. The phantom had a glass bead density of 47 mm−3. Estimates of the scatterer diameter were obtained from ROIs in the phantom. The bias and standard deviation of estimates were calculated from the estimates from several ROIs using the different methods and compared.
IV. SIMULATION AND EXPERIMENTAL RESULTS
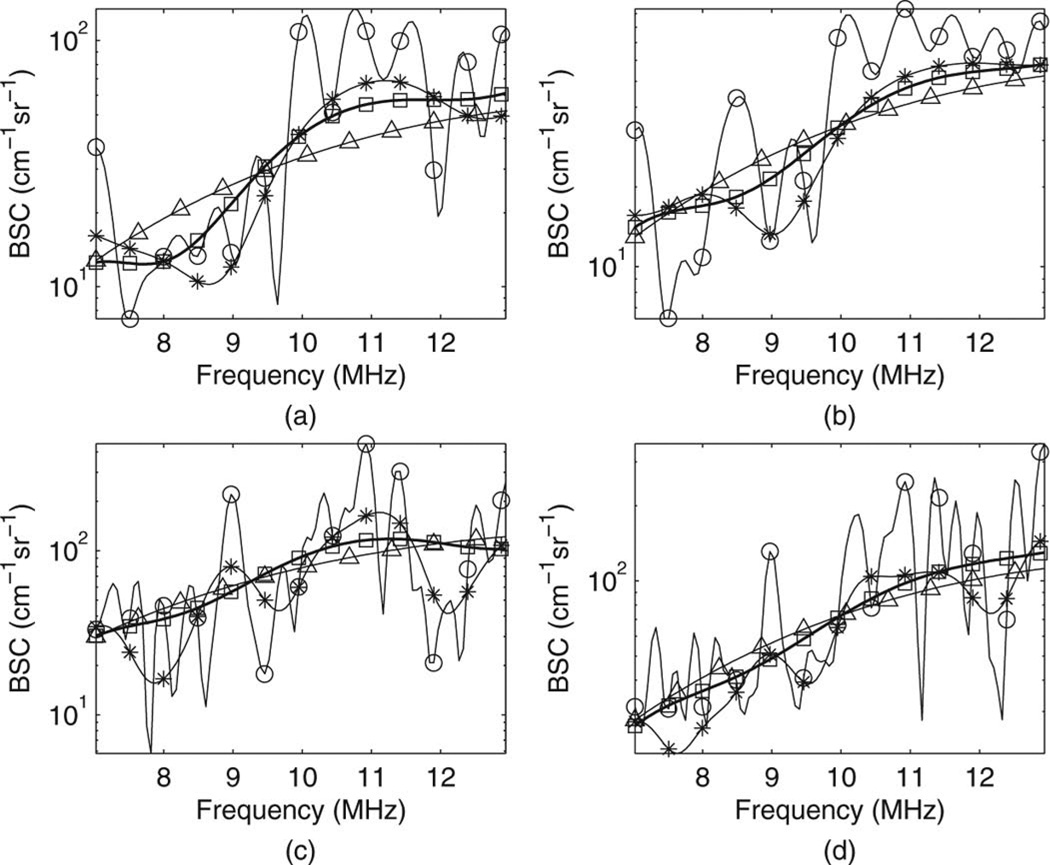
The estimated backscatter coefficients (BSCs) from single ROIs of different sizes using the three different methods and the theoretical BSCs are shown in Fig. 1. Although the conventional Welch method reduced the high-frequency fluctuations, the new method minimized the high-frequency fluctuations even more because smaller gate sizes could be used. The smaller high-frequency fluctuations in the BSC curves should result in a decreased bias and standard deviation of estimates. Mean squared error (MSE) was calculated for each method using different ROI sizes to quantify the goodness of fit between the theoretical backscattered coefficient and the estimated values using the different methods as shown in Table I. The BSC obtained using the new method had smaller MSE values than the other methods.
Fig. 1.
Simulated backscattered coefficients using various ROI sizes of (a) 5 spatial pulse lengths (SPL) axially by 1 beamwidth (BW) laterally, (b) 5 SPL axially by 2 BW laterally, (c) 10 SPL axially by 1 BW laterally, and (d) 10 SPL axially by 2 BW laterally. Circle, asterisk, square, and triangle denote results from the non-Welch method with rectangular window, conventional Welch method, the new method, and the theoretical backscatter coefficient (BSC), respectively.
TABLE I.
Mean Squared Error for Three Different Methods* Using Various ROI Sizes.
| ROI size (axial × lateral)† |
Method I | Method II | Method III |
|---|---|---|---|
| 5 SPL × 1 BW | 11.07 | 4.98 | 2.58 |
| 5 SPL × 2 BW | 5.64 | 2.16 | 0.78 |
| 10 SPL × 1 BW | 14.24 | 6.26 | 0.59 |
| 10 SPL × 2 BW | 6.81 | 1.92 | 0.38 |
Methods I, II, and III refer to non-Welch method with rectangular window, conventional Welch method, and the new method, respectively.
SPL = spatial pulse length; BW = beamwidth.
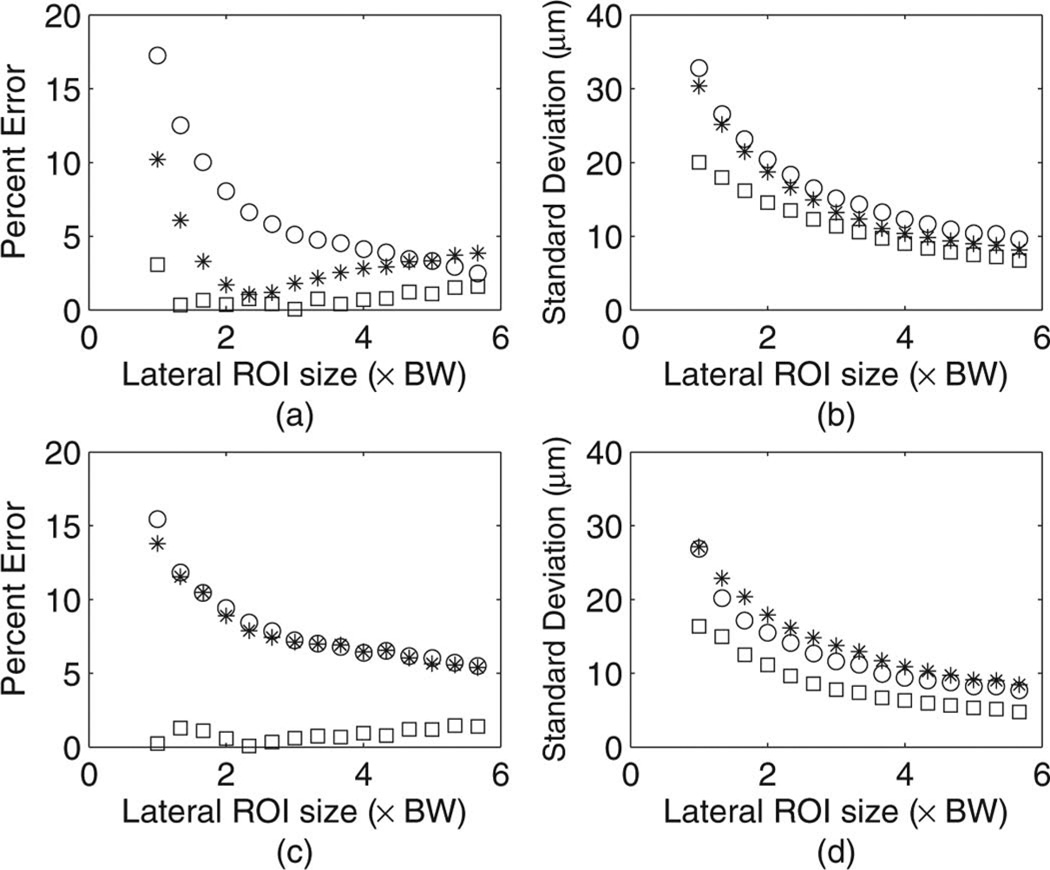
The BSC obtained from the new and the conventional methods were then analyzed to estimate ESD. The ESD was estimated by using Born’s approximation and single scattering assumption [13]. The percentage errors in the estimated ESDs were calculated by comparing the estimated values to the actual values of the ESD. The percentage errors for ESD estimates and the absolute standard deviations of the estimates using various sizes of the ROIs are shown in Fig. 2. The lateral sizes of the ROIs are shown in terms of number of beamwidths used. The separation between consecutive scan lines was 0.2 mm, which corresponds to 1/3 of the source beamwidth. The new method resulted in improvement both in terms of the bias and the standard deviation of the ESD estimates as compared with the other methods for small ROI sizes. For larger ROIs with a lateral size of 4 beamwidths, the three methods yielded approximately equal trends in the bias and the standard deviation of the estimates. For an axial ROI length of 10 SPLs, the new method resulted in low bias (less than 5%), even when few scan lines were used.
Fig. 2.
Estimated ESD from simulated phantom for randomly spaced Gaussian scatterers in terms of (a) percent error of estimation using 5 spatial pulse lengths (SPL) axial ROI size, (b) absolute standard deviation using 5 SPL axial ROI size, (c) percent error of estimation using 10 SPL axial ROI size, and (d) absolute standard deviation using 10 SPL axial ROI size. Circle, asterisk, and square denote results from non-Welch method with rectangular window, conventional Welch method, and the new method, respectively. The horizontal axis is shown in terms of beamwidths (BW).
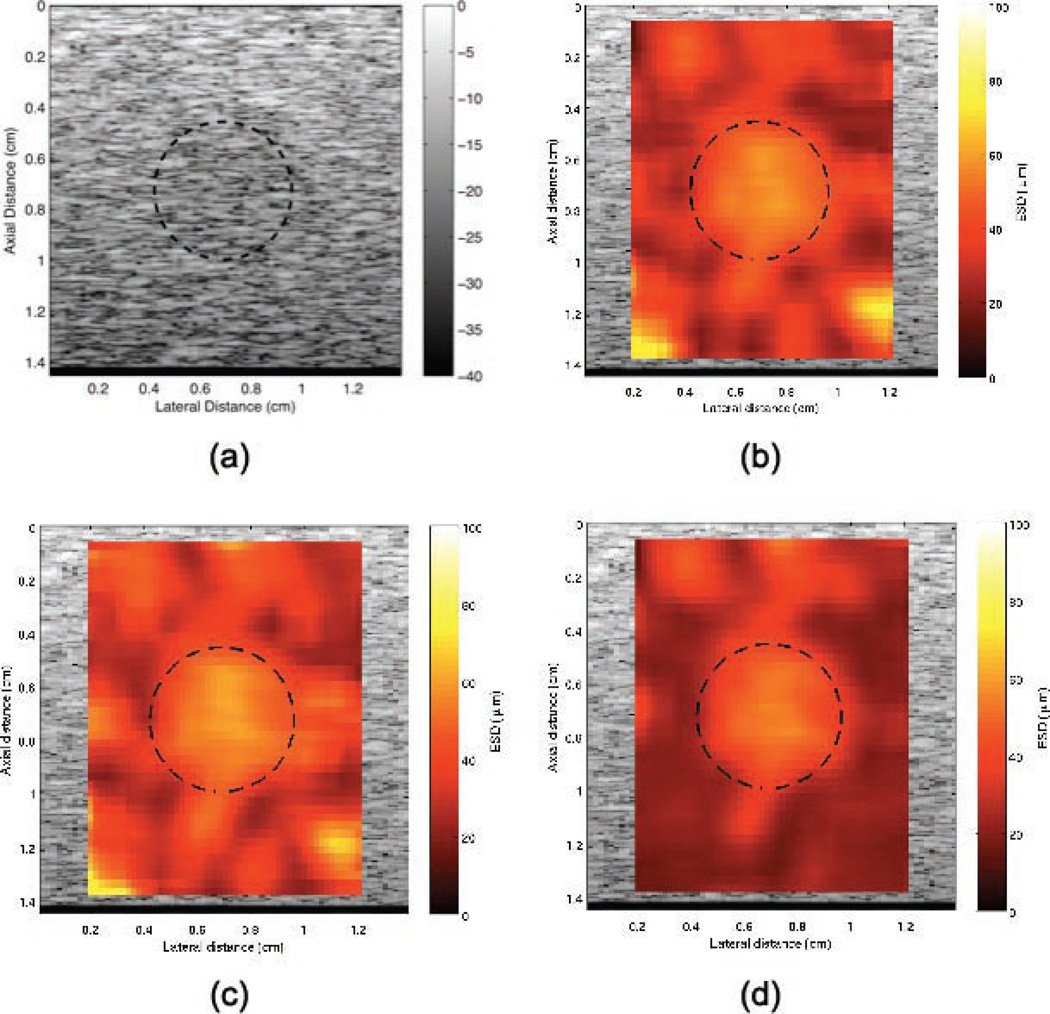
The second simulated phantom had a lesion at the center of the scattering volume. A conventional B-mode image of the phantom is shown in Fig. 3(a). In the B-mode image, the contrast between the lesion and the background is low (Table II), such that the lesion cannot be distinguished from the background. QUS images of the phantom were constructed and enhanced by the estimated ESD as shown in Figs. 3(b)–3(d) using the three different methods. The sizes of the ROIs were 5 SPLs axially and 3 beamwidths laterally. ROIs were overlapped by 80% to achieve smaller pixel sizes in the QUS images. The QUS image constructed using the new method was observed to provide better contrast than the image constructed using the conventional method. Using (3), the calculated CNR values were 1.37, 1.31, and 1.85 for the non-Welch, conventional Welch and the new method, respectively. The various statistical quantities for the three different methods are shown in Table II. The non-Welch and conventional Welch methods estimated higher ESD outside the lesions for both smaller and larger ROI sizes, which can be observed from the bright red pixels in the images outside the lesion shown in Figs. 3 (color in the online image only). The new method resulted in better CNR for smaller ROI sizes compared with the other methods. Thus, the spatial resolution of the QUS image can be improved with the new method by using smaller ROIs and achieving similar CNR compared with using the larger ROIs. Using the new method resulted in higher CNR because the variance of the estimates decreased but the mean of the estimated quantities did not change significantly, thus also improving the spatial resolution. It should be noted that the CNR of the QUS images improved significantly when compared with the conventional B-mode image.
Fig. 3.
(a) B-mode image of the simulated phantom with an inclusion at the center. Parametric images enhanced by effective scatterer diameter using (b) non-Welch method, (c) conventional Welch’s method, and (d) new method. The size of each region of interest is 5 spatial pulse lengths and 3 beamwidths in the axial and the lateral direction, respectively. The thick broken lines denote the boundary of the lesion.
TABLE II.
Statistical Properties of the Quantitative Ultrasound Image Enhanced by Effective Scatterer Diameter Using Different Methods* for the Images Shown in Fig. 3.
| μB | μL | σB | σL | CNR | |
|---|---|---|---|---|---|
| B-mode | 157.65 | 160.52 | 1764.74 | 1779.18 | 0.0482 |
| Method I | 128.44 | 88.93 | 244.30 | 591.97 | 1.37 |
| Method II | 131.37 | 94.87 | 275.30 | 529.39 | 1.31 |
| Method III | 115.19 | 67.90 | 330.48 | 322.68 | 1.85 |
Methods I, II, and III refer to non-Welch method with rectangular window, conventional Welch method, and the new method, respectively.
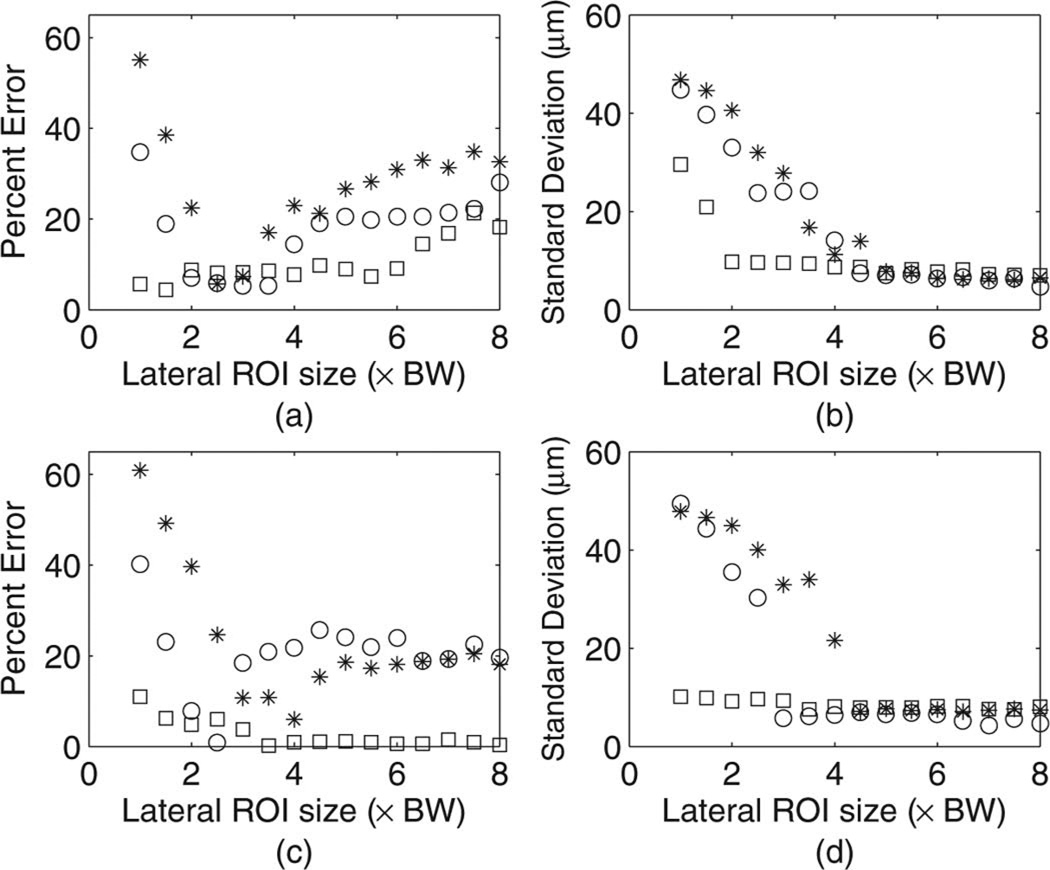
Finally, backscatter experiments were conducted in the physical phantoms. The distance between consecutive scan lines was 0.4 mm, which corresponds to 0.5 beamwidths. The gate-edge correction factor was calculated using established theory [10]. The results using different ROI sizes are shown in Fig. 4. For smaller ROI sizes, the new method had lower bias and standard deviation in the estimated ESD than the other two methods. When lateral ROI sizes larger than 5.5 beamwidths were used, all the three methods resulted in low and approximately similar bias and standard deviation in the estimated ESD. The characteristics of the experimental and simulation results agreed well with respect to the estimated ESD for particular ROI sizes.
Fig. 4.
Estimated effective scatterer diameter from experimental data for glass beads in tissue-mimicking phantom in terms of (a) percent error using 5 spatial pulse lengths (SPL) axial ROI size, (b) absolute standard deviation using 5 SPL axial ROI size, (c) percent error using 10 SPL axial ROI size, and (d) absolute standard deviation using 10 SPL axial ROI size. Circle, asterisk, and square denote results from non-Welch method with rectangular window, conventional Welch method, and the new method, respectively. The horizontal axis is shown in terms of beamwidths (BW).
V. CONCLUSION
The new method estimated ESD with lower standard deviation when small ROI sizes were used compared with conventional windowing and a Welch method. The new method estimated ESD with less than 10% error even for the smallest ROI size considered in the study. All three methods estimated ESD with similar performance when the size of the ROI was larger than 10 SPLs axially and 5 beamwidths laterally. The results of the study indicate that the new method can be used to estimate QUS parameters from smaller ROIs with lower bias and standard deviation.
The new method resulted in higher precision of the ESD estimates, resulting in higher spatial resolution QUS images. The new method has the potential to decrease the ROI size by half while maintaining comparable accuracy and precision in the ESD estimates. Therefore, the new technique has extended the trade-off between spatial resolution in QUS imaging and the bias and standard deviation of QUS estimates.
Acknowledgments
This work was supported by the NIH grant R01-EB008992.
APPENDIX
It should be noted that [8, Eq. (17)], which is the averaged backscattered power spectra caused by scattered wavelets truncated over the length of the scattered pulse, is corrected as
| (4) |
where α(f) is the frequency-dependent attenuation coefficient, x0 is the distance from the beginning of the interrogated medium to the front edge of the gated region, and tp is the time duration of the echo signal. The function s(t) is approximated from the excitation pulse and scatterer properties, and g(t, t′) is a rectangular gate function.
REFERENCES
- 1.Lizzi FL, Ostromogilsky M, Feleppa EJ, Rorke MC, Yaremko MM. Relationship of ultrasonic spectral parameters to features of tissue microstructure. IEEE Trans. Ultrason. Ferroelectr. Freq. Control. 1987;vol. 34(no. 3):319–329. doi: 10.1109/t-uffc.1987.26950. [DOI] [PubMed] [Google Scholar]
- 2.Insana MF, Wagner RF, Brown DG, Hall TJ. Describing small-scale structure in random media using pulse-echo ultrasound. J. Acoust. Soc. Am. 1990;vol. 87(no. 1):179–192. doi: 10.1121/1.399283. [DOI] [PMC free article] [PubMed] [Google Scholar]
- 3.Oelze ML, Zachary JF, O’Brien WD., Jr Parametric imaging of rat mammary tumors in vivo for the purpose of tissue characterization. J. Ultrasound Med. 2002;vol. 21(no. 11):1201–1210. doi: 10.7863/jum.2002.21.11.1201. [DOI] [PubMed] [Google Scholar]
- 4.Oelze ML, O’Brien WD, Jr, Blue JP, Zachary JF. Differentiation and characterization of rat mammary fibroadenomas and 4T1 mouse carcinomas using quantitative ultrasound imaging. IEEE Trans. Med. Imaging. 2004;vol. 23(no. 6):764–771. doi: 10.1109/tmi.2004.826953. [DOI] [PubMed] [Google Scholar]
- 5.Oelze ML, O’Brien WD., Jr Defining optimal axial and lateral resolution for estimating scatter properties from volume using ultrasound backscatter. J. Acoust. Soc. Am. 2004;vol. 115(no. 6):3226–3234. doi: 10.1121/1.1739484. [DOI] [PubMed] [Google Scholar]
- 6.Huisman HJ, Thijssen JM. Precision and accuracy of acoustospectrographic parameters. Ultrasound Med. Biol. 1996;vol. 22(no. 7):855–871. doi: 10.1016/0301-5629(96)00105-6. [DOI] [PubMed] [Google Scholar]
- 7.Welch PD. The use of fast fourier transform for the estimation of power spectra: A method based on time averaging over short, modified periodograms. IEEE Trans. Audio Electroacoust. 1967;vol. AU-15(no. 2):70–73. [Google Scholar]
- 8.Oelze ML, O’Brien WD., Jr Improved scatterer property estimates from ultrasound backscatter for small gate lengths using a gate-edge correction factor. J. Acoust. Soc. Am. 2004;vol. 116(no. 5):3212–3223. doi: 10.1121/1.1798353. [DOI] [PubMed] [Google Scholar]
- 9.Stoica P, Moses RL. Introduction to Spectral Analysis. New Jersey: Prentice Hall; 1997. [Google Scholar]
- 10.Faran JJ., Jr Sound scattering by solid cylinders and spheres. J. Acoust. Soc. Am. 1951;vol. 23(no. 4):405–418. [Google Scholar]
- 11.Sanchez JR, Oelze ML. An ultrasonic imaging speckle-suppression and contrast-enhancement technique by means of frequency compounding and coded excitation. IEEE Trans. Ultrason. Ferroelectr. Freq. Control. 2009;vol. 56(no. 7):1327–1339. doi: 10.1109/TUFFC.2009.1189. [DOI] [PubMed] [Google Scholar]
- 12.Raum K, O’Brien WD., Jr Pulse-echo field distribution measurement technique for high-frequency ultrasound sources. IEEE Trans. Ultrason. Ferroelectr. Freq. Control. 1997;vol. 44(no. 4):810–815. [Google Scholar]
- 13.Lizzi FL, Greenabaum M, Feleppa EJ, Elbaum M, Coleman DJ. Theoretical framework for spectrum analysis in ultrasonic tissue characterization. J. Acoust. Soc. Am. 1983;vol. 73(no. 4):1366–1373. doi: 10.1121/1.389241. [DOI] [PubMed] [Google Scholar]


