

Abstract
Background
Control of hyperglycemia improves outcomes, but increases the risk of hypoglycemia. Recent evidence suggests that blood glucose variability (BGV) is more closely associated with mortality than either isolated or mean BG. We hypothesized that differences in BGV over time are associated with hypoglycemia and can be utilized to estimate risk of hypoglycemia (<50 mg/dL).
Materials & Methods
Patients treated with intravenous insulin in the Surgical Intensive Care Unit of a tertiary care center formed the retrospective cohort. Exclusion criteria included death within 24 hours of admission. We describe BGV in patients over time and its’ temporal relationship to hypoglycemic events. The risk of hypoglycemia for each BG measurement was estimated in a multivariable regression model. Predictors were measures of BGV, infusions of dextrose and vasopressors, patient demographics, illness severity, and BG measurements.
Results
66,592 BG measurements were collected on 1392 patients. Hypoglycemia occurred in 154 patients (11.1%). Patient BGV fluctuated over time, and increased in the 24 hours preceding a hypoglycemic event. In crude and adjusted analyses, higher BGV was positively associated with a hypoglycemia (OR 1.41, p<0.001). Previous hypoglycemic events and time since previous BG measurement were also positively associated with hypoglycemic events. Severity of illness, vasopressor use, and diabetes were not independently associated with hypoglycemia.
Conclusions
BGV increases in the 24 hours preceding hypoglycemia, and patients are at increased risk during periods of elevated BG variability. Prospective measurement of variability may identify periods of increased risk for hypoglycemia, and provide an opportunity to mitigate this risk.
Keywords: Blood glucose variability, hypoglycemia, glycemic control, critical illness
INTRODUCTION
Hyperglycemia in both the peri-operative and intensive care unit (ICU) settings is associated with increased morbidity and mortality among diverse patient populations[1–7]. As a result, the use of intensive insulin therapy (IIT) to control blood glucose has been widely adopted in the ICU setting. Since the first study on IIT and outcomes by Van den Berghe[8], an extensive body of literature has emerged. While the 2001 study showed a decrease in mortality associated with IIT, a number of large randomized studies since that time have not been able to reproduce the benefits in terms of morbidity and mortality[9–11]. A recent meta-analysis showed no significant benefit with the use of IIT when combining all studies[12]. However, a subgroup analysis showed that the data still favors the use of IIT in the surgical ICU population. In this group, IIT still appears to be beneficial in decreasing infectious complications and improving survival[8, 13–19]. However, controversy persists over the appropriate patient population, and optimum target range for blood glucose (BG) control. This is due, in part, to concerns over hypoglycemia with tight glucose control (80–110 mg/dL)[9, 11, 12, 20, 21].
A number of factors have been shown to be associated with risk of hypoglycemia, including time on intensive insulin therapy [22], requirement for dialysis, decreases in nutrition provided without concurrent decreases in insulin, diabetes mellitus, sepsis, need for vasopressors, and BMI[23–25]. Hypoglycemia’s contribution to the risk of mortality remains uncertain, due to variability in the severity of hypoglycemia, accuracy of monitoring, time intervals between monitoring (altering the period of hypoglycemia), institutional differences in insulin therapy protocols, and the variability in patient severity of illness and clinical disease state among various studies. Thus, studies have yielded conflicting results[26–28]. While target range for glucose control and insulin protocol type and compliance contribute to hypoglycemic events, patient-specific factors also contribute to the overall risk of hypoglycemia. Recent evidence suggests that BG variability is more strongly associated with mortality than either isolated or mean BG levels in the critically ill patient population[29–45]. In the outpatient diabetic population, wide fluctuations in BG level and increased BG variability have been associated with hypoglycemia[46]. Whether or not a patient’s blood glucose variability is associated with subsequent hypoglycemia in critically ill patients has not been previously studied. We hypothesized that individual differences in BG variability over time in critically ill surgical patients are associated with hypoglycemia and can be utilized to estimate a patient’s risk of hypoglycemia.
MATERIALS AND METHODS
A retrospective analysis was performed on a cohort of critically ill surgical patients admitted to the Surgical Intensive Care Unit (SICU) of a tertiary care, academic medical center from June 1, 2006 to September 1, 2009. All patients within the SICU receive critical care consultation and management until discharge from the ICU. Patient care management is at the discretion of the ICU attending physician according to established evidence-based practice management guidelines.
This study was approved by the Vanderbilt University Institutional Review Board. Inclusion criteria consisted of treatment with a computerized IIT protocol to maintain euglycemia (80–110 mg/dL) and remaining on protocol for at least five BG measurements and 12 hours. All patients in the cohort were 18 years of age or older, and were admitted to the SICU either directly (from the operating or upon transfer from another facility), or transferred from the surgical floor after a prior period of hospitalization requiring a sub-acute level of care. Vanderbilt University has a separate trauma ICU and medical ICU; therefore, all patients included in the study were surgical patients and did not include trauma or medical ICU patients. Patients who died within 24 hours of admission to the ICU were excluded.
Insulin Protocol and Blood Glucose Measurements
All critically ill, mechanically ventilated patients with serum BG values above 110 mg/dL are placed on an intravenous computerized insulin protocol. Vanderbilt University Medical Center uses a computerized, automated care provider order entry (CPOE) system to achieve euglycemia with the use of an intravenous insulin infusion. Blood glucose measurements are scheduled every 2 hours by registered nurses using the SureStep®(OneTouch®) Professional Blood Glucose Monitoring System (Lifescan, Inc., Milpitas, CA). This CPOE euglycemia algorithm has been previously described[47, 48]. It uses a modification to a protocol published by White et al. [49] and Bode et al. [50] with dose computed according to the following formula:
The multiplier (M) variable is initially set to 0.03 and adapts according to a set protocol, although it can never fall below zero. Blood glucose values exceeding the high target threshold on two consecutive BG measurements, or exceeding 200 mg/dL on one reading, trigger a multiplier increase of 0.01. Blood glucose values below the low target threshold decrease the multiplier by 0.01, and BG values below 60 mg/dL decrease the multiplier by 0.02. When BG values fall below the low target threshold, the protocol orders a calculated dose of intravenous 50% dextrose to correct or prevent hypoglycemia. The intravenous insulin infusion is simultaneously withheld for two hours. Insulin is dispensed by the pharmacy as 150 units of regular insulin in 150 mL of normal saline (1U/1mL concentration). Blood glucose levels are measured at least every 2 hours for patients who are not hypoglycemic, and every hour for patients with a recent hypoglycemic episode.
Data Collection
Patient factors including gender, age, weight, date of hospital and ICU admission, mortality, Acute Physiology and Chronic Health Evaluation II (APACHE II) score at ICU admission, and diagnosed diabetes were obtained from the electronic health record and the SICU registry. The SICU registry is an IRB-approved repository of clinical data that is prospectively collected and maintained on every patient admitted to the SICU. Patient weight was missing for 92 patients (6.6% of the study group) and was imputed to the population median (85 kg) and APACHE II score was missing for 43 patients and imputed to the population median (22). All components of the insulin protocol (BG values, test times, insulin dose, multiplier, adherence to IIT protocol, and treatment with a dose of 50% dextrose) are recorded prospectively, and each eligible patient had multiple recorded BG measurements. Blood glucose measurements during the first 12 hours (induction phase) on the IIT protocol were excluded. Because blood glucose levels are not symmetrically distributed, blood glucose values were transformed to symmetrize and normalize the distribution of BG values as described by Kovatchev[51]. Time variable data for each patient included data from the IIT protocol, current vasopressor use, and current dextrose-containing intravenous fluid (IVF) provision.
Assessment of Blood Glucose Variability
Blood glucose variability was measured in two ways. First, the standard deviation of BG measurements and median absolute change in successive BG values (current BG-previous BG) was calculated for each patient’s ICU stay, and comparisons made between patients who experienced a hypoglycemic event compared to patients who did not. Then, BG variability was evaluated temporally in the 24 hours preceding an individual BG measurement of interest (index BG) by computing the absolute difference between successive BG measurements. Patient-specific blood glucose variability is reported using the standard deviation and the average absolute change in successive BG measurements, calculated over the entire SICU stay. In the multivariable model, at each point in time when blood glucose was tested, recent blood glucose variability was defined as the absolute change in BG over the previous 3 test intervals (Figure I). Because blood glucose variability is not stable within individual patients over their entire ICU stay, cumulative measures of BG variability over the entire encounter are inappropriate when modeling a patient’s risk of hypoglycemia at a single time point in their ICU stay. The modeling data set contains one record for each BG test in an eligible patient after the patient has been on the IIT protocol for 12 hours and has had four previous blood glucose measurements. Recent blood glucose data are not used when there is a gap of 6 or more hours between blood glucose measurements.
Figure I. Computing recent blood glucose variability.
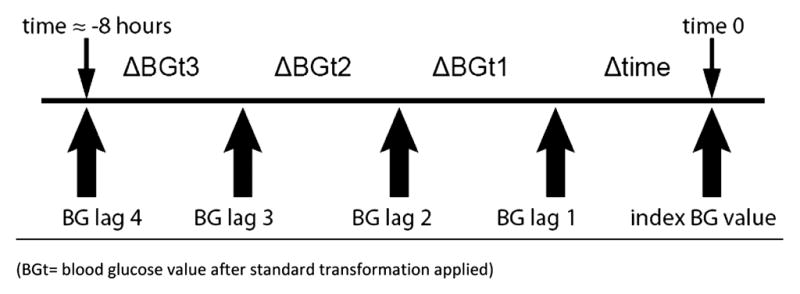
Recent blood glucose variability is the absolute difference between the four preceding BG values.
Statistical analysis
Normally distributed continuous variables were summarized by reporting the mean and standard deviation and compared using two sample t tests for independent samples. Continuous variables that were not normally distributed were presented by reporting the median and interquartile range (IQR) and compared using the Wilcoxon rank-sum test. Differences in proportions were compared using a χ2 test.
Multivariate logistic regression models were fit to predict hypoglycemia (<50 mg/dL) at the next BG test. A hypoglycemic event was defined as BG <50 mg/dL in order to maximize power (a cut point of 40 mg/dL provided too few hypoglycemic patients to allow robust modeling) while still selecting a BG level that would be expected to be clinically important. Measurements of BG, time between successive BG measurements, and BG variability were calculated using data beginning at 12 hours after SICU admission to allow for stabilization on the IIT protocol. Blood glucose variability during this early period after admission is likely dominated by protocol-based insulin dosing striving to bring a patient’s BG into the target range, rather than patient-specific characteristics. Blood glucose values are repeated measures within patients and this correlation must be accounted for within the model to prevent overly optimistic standard errors. Therefore, robust covariance estimates using the Huber-White method to adjust the variance-covariance matrix for clustered data are presented[52, 53]. Model terms included absolute change from previous BG over the three previous BG measurements, diagnosed diabetes, patient age (4 knot spline), gender, weight (3 knot spline), current vasopressor use and volume of 5% dextrose infused in the two hours preceding the index measurement, time elapsed from the previous blood glucose test, and the cumulative count of previous hypoglycemic events (<60 mg/dL). For regression modeling, a BG of <60 mg/dL was used to define previous hypoglycemia, in order to include ‘near miss’ hypoglycemic events. Patient weight, rather than BMI, was included in the model due to missing height values for patients early in the study period. Variables were fit as restricted cubic splines where relationships were non-linear[54]. The model was cross-validated with 40 data segments using the R Design package[54]. All confidence intervals (CI) are at the 95% level, and a two-sided p value of <0.05 indicated statistical significance. Analysis was performed using R version 2.11.0 (www.r-project.org).
RESULTS
During the study period, a total of 78, 136 BG measurements were collected on 1392 patients. After excluding BG measurements taken in the first 12 hours after SICU admission and following 6 hour gaps in IIT treatment, 66, 592 BG measurements (85.2%) remained for analysis and modeling. Hypoglycemia (<50 mg/dL) occurred in 154/1392 patients (11.1%). Demographics and clinical characteristics of those who experienced one or more hypoglycemic events compared to those who did not are displayed in Table I. Patients who experienced a hypoglycemic episode were older, weighed less, were sicker (higher APACHE II score and had an increased length of stay (LOS)), with higher maximum glucose, higher BG variability, and higher mortality.
Table I. Patient demographics.
There are 1,392 patients. Because we are only using blood glucose test results after the patient has been on the protocol for 12 initial hours and has 4 valid previous blood glucose test results, we are using 66,592 distinct blood glucose test results out of 78,136 blood glucose tests performed on these 1,392 patients during the study period.
| Hypoglycemic Patients n= 154 | Non-Hypoglycemic Patients n= 1,238 | p-value | |
|---|---|---|---|
| Age (yrs)* | 60.7 (14.3) | 58.2 (14.5) | 0.04 |
| Males (%) † | 58.4 | 59.7 | 0.8 |
| Patient weight (Kg)* | 81.3 (26.2) | 87.4 (26.6) | 0.01 |
| History of diabetes (%) † | 26.6 | 33.4 | 0.11 |
| APACHE II ‡ | 21 (16–25) | 19 (15–23) | 0.001 |
| Hospital LOS ‡ | 22.6 (14.2 – 35.1) | 12.5 (7.6 – 21.1) | <0.0001 |
| ICU LOS ‡ | 14.8 (8.7–24.5) | 5 (2.9 – 9.9) | <0.0001 |
| Average blood glucose ‡ | 109 (105–114) | 108 (101 – 117) | 0.9 |
| Max glucose ‡ | 197 (169 – 239) | 150 (126 – 185) | <0.0001 |
| SD transformed blood glucose‡ | 0.48 (0.42 – 0.57) | 0.33 (0.23–0.42) | <0.0001 |
| Average change in transformed blood glucose values | 0.33 (0.27 – 0.41) | 0.27 (0.21 – 0.36) | <0.0001 |
| Mortality (%)† | 24.7 | 12.5 | <0.0001 |
Mean ±SD; compared using two sample t-test
Proportion; compared using χ2 test
Median (IQR); compared using Wilcoxon rank-sum test
For average blood glucose, the median transformed blood glucose was determined for each patient. The values in this table represent the back-transformed median and IQR of these values by outcome.
Bold values indicate statistical significance
Blood Glucose Control
During the study period, nearly half of the BG values recorded fell in the IIT target range of 80–110 mg/dL, indicating that the computerized tool functions well to control BG in a narrow range (Table II). Only 0.3% of values fell below 50 mg/dL for an overall hypoglycemic rate of 11.1% of patients. 9.2% of values were hyperglycemic in the >150 mg/dL range.
Table II.
Blood Glucose Control
| Blood Glucose Category | Count (%) |
|---|---|
| <=50 mg/dL | 208 (0.3) |
| 51–80 mg/dL | 4,155 (6.2) |
| 81–110 mg/dL | 29,895 (45.0) |
| 111–150 mg/dL | 26,182 (39.3) |
| 151–200 mg/dL | 5,198 (7.8) |
| >200 mg/dL | 954 (1.4) |
Measures of Variability
Fifty patients who experienced a hypoglycemic event during their SICU stay and fifty patients who did not experience a hypoglycemia event during their SICU stay were randomly selected, and their blood glucose values over time were plotted in spaghetti plots. Figure II shows the raw blood glucose values over time for these 100 patients. Blood glucose variability is higher for patients who experienced a hypoglycemic event, compared to those who did not. Blood glucose variability was then quantitatively assessed over the entirety of patients’ SICU stays (using data from all patients) by calculating the SD of BG measurements and median absolute change in BG values (current blood glucose-previous blood glucose). Both the cumulative SD of BG measurements (0.48 vs. 0.33, p <0.001), and the cumulative median absolute change in blood glucose values (0.33 vs. 0.27, p <0.001) was significantly higher in patients who experienced a hypoglycemic event compared to those who did not (Table I). Blood glucose variability was then evaluated temporally in the 24 hours preceding each individual BG measurement, and using all available BG tests. In the 24 hours preceding a hypoglycemic event, blood glucose variability increased compared to the 24 hours preceding a non-hypoglycemic BG value (Figure III). Blood glucose variability also increased in the 24 hours preceding a BG value of >200 mg/dL. BG variability in individual patients is not stable, as seen in Figure IV, in which patients are classified as being, on average, in the highest quartile of BG variability or the low/normal quartiles in each 12 hour segment. In this unadjusted analysis, the risk of hypoglycemia was 3.2 times higher when a patient was in a state of high BG variability. Overall, there were 3.3 hypoglycemic events/1,000 hours of high BG variability compared to 1 hypoglycemic event/1,000 hours of low BG variability.
Figure II. Blood glucose over time for Hypoglycemic and Non-Hypoglycemic patients.

Blood glucose values for 50 randomly-selected hypoglycemic patients (defined as one or more hypoglycemic events) and 50 randomly-selected non-hypoglycemic patients (defined as zero hypoglycemic events) plotted over time. Each plot represents 10 patients.
Figure III. Blood glucose variability in 24 hours preceding BG measurement of interest (index BG).
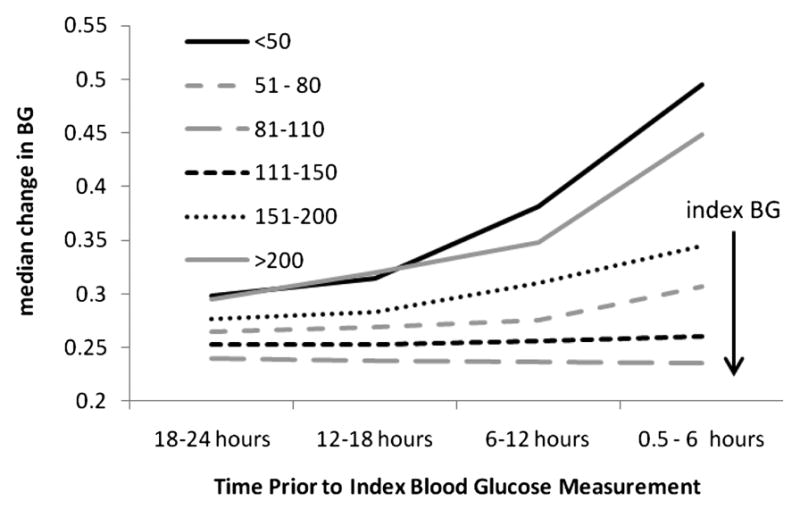
Blood glucose variability is higher prior to hypo- and hyper- glycemic glucose values, while euglycemic values are preceded by very low blood glucose variability. For all patient glucose values within a particular range (line style) at the index BG, variability is plotted for the preceding 24 hours in 6-hour intervals. Immediately prior to hypoglycemic events (BG <= 50 mg/dL), BG variability increases rapidly. BG variability also increased in the 24 hours preceding a BG value of >200 mg/dL.
Figure IV. The Relationship Between Hypoglycemia, Blood Glucose Variability, and Time in ICU Stay.

This figure shows the relationship between hypoglycemia and BG variability. Proportion of patients are on the y axis, and time is on the x axis. Each horizontal row is a patient, showing BG variability over time, with similar patients grouped together. Medium gray is low variability and dark grey is high variability. Hypoglycemic events during periods of low variability are noted by light dots, and hypoglycemic events during periods of high variability are noted by dark dots. The size of the dot corresponds to number of events, with larger dots indicating more events. Most patients have low BG variability. But, variability changes over time, with patients moving from periods of low variability to periods of high variability. When BG variability is high, the risk of hypoglycemia is higher. Overall, there are 3.3 hypoglycemic events (BG <= 50 mg/dL) for every 1,000 hours of high blood glucose variability and 1 hypoglycemic event for every 1,000 hours of low BG variability.
Multivariate Regression Models
A multivariate logistic regression model was fit with occurrence of hypoglycemia at the next BG measurement as the outcome of interest. Odds ratios for predictors with confidence intervals based on robust covariance estimates are presented in Table III. Recent blood glucose variability (i.e. in the preceding 8 hours) was significantly higher in patients who experienced a hypoglycemic event at the next BG measurement (OR 1.39, p-value <0.0001). While recent BG variability is independently associated with hypoglycemia, increasing age, lower weight, longer BG measurement intervals, and previous hypoglycemic events were also associated with higher risk. Baseline severity of illness, gender, patient age, vasopressor use, and history of diabetes were not independently associated with hypoglycemia when controlling for BG variability, weight, and time between measurements.
Table III.
Model covariates with odds ratios and 95% confidence intervals based on robust covariance estimates.
| Predictors independently associated with hypoglycemia | Exposure | OR | 95% CI |
|---|---|---|---|
| Change in BG lag1† | IQR (0.1–0.45) | 1.42* | 1.29 – 1.57 |
| Change in BG lag2† | IQR (0.1–0.46) | 1.07* | 0.96 – 1.19 |
| Change in BG lag3† | IQR (0.1–0.46) | 1.17* | 1.07 – 1.28 |
| Weight (kg) | IQR (70–103) | 0.72* | 0.56 – 0.93 |
| Time since previous BG measurement (hours) | IQR (1.68–2.33) | 1.45* | 1.33 – 1.58 |
| Count of previous hypoglycemic episodes (41 60) | 0 | Reference | |
| 1 | 1.69 | 1.12 – 2.53 | |
| 2 | 1.45 | 0.94 – 1.90 | |
| 3 or more | 4.14 | 2.56 – 6.70 | |
|
| |||
| Predictors not independently associated with hypoglycemia | IQR/exposure | OR | 95% CI |
| Diagnosed diabetes | Y/N | 0.88 | 0.63 – 1.22 |
| Female sex | Y/N | 0.96 | 0.75 – 1.37 |
| Current vasopressors | Y/N | 1.19 | 0.86 – 1.64 |
| Patient age (years) | IQR (50.6–69.9) | 1.39* | 0.92–2.12 |
| Volume of 5% dextrose infused (ml) | IQR (0–73) | 0.98* | 0.87–1.12 |
| Baseline APACHE II score | IQR (17–26) | 0.95* | 0.75–1.21 |
| Hours on protocol | IQR (49–247) | 0.91* | 0.82–1.02 |
OR for risk associated with 75th percentile compared to 25th percentile is shown
Represents BG after standard transformation applied
DISCUSSION
The use of IIT to control BG in ICU settings has been fairly widely adopted, particularly in surgical ICUs. Controversy regarding appropriate targets for glycemic control persists and interpretation of the data from various trials are confounded by varying rates of hypoglycemia and hypoglycemia’s possible influence on outcome. In addition, there is considerable controversy surrounding the issue of whether IIT is beneficial or harmful, and to which populations. In surgical patients, the weight of data still supports controlling blood glucose[12], although the best target range remains elusive. Certainly, IIT protocols increase patients’ risk of hypoglycemia, and methods by which to minimize this risk represent an important clinical challenge. Our data shows that a computerized provider order entry insulin protocol is effective in maintaining BG values in a narrow range relative to most published protocols, with nearly half of recorded BG values falling between 80–110 mg/dL. However, in our SICU, 11.1% of patients placed on IIT experience a hypoglycemic episode of less than 50 mg/dL. In order to limit hypoglycemic events without altering successful glucose control, we sought to identify markers that could stratify an individual patient’s risk of hypoglycemia to allow intervention prior to its occurrence.
The analysis presented demonstrates that BG variability differs between patients and within individual patients over the course of critical illness in response to the same CPOE based insulin therapy protocol. Factors identified to be independently associated with subsequent hypoglycemic events (<50 mg/dL) include previous episodes of hypoglycemia (<60 mg/dL, to include ‘near miss hypoglycemic events’), time since the previous BG measurement, BG variability in the last 8 hrs, and patient weight. Analysis of BG variability demonstrates that patients who experience a hypoglycemic event while in the ICU have higher BG variability over the course of their ICU stay. In addition, BG variability increases in the 24 hours preceding a hypoglycemic event. Blood glucose variability also increases in the 24 hours preceding a hyperglycemic BG value (>200 mg/dL). This finding likely represents either patients whose BG is highly variable, such that they are rapidly moving between hyperglycemic and hypoglycemic values (defining the population at highest risk for hypoglycemia), or else patients who have had a clinical change, such as the occurrence of an infection, who are hyperglycemic and the IIT protocol is ordering higher doses of insulin to bring their BG values back into goal range. In the latter group of patients, this variability is expected during the normal functioning of an IIT tool designed to drive BG to a goal range of 80–110 mg/dL. The computerized protocol is designed to limit BG variability when BG values are within range. Therefore, elevated BG variability prior to a hypoglycemic event is a function of differences in patient behavior on IIT, while elevated BG variability prior to a BG value of >200 mg/dL in patients who are experiencing a short period of hyperglycemia is secondary to proper functioning of the tool to bring patient BG to a euglycemic range of 80–110 mg/dL.
An individual patient’s BG variability also differs over the course of critical illness and increased variability is associated with increased risk of hypoglycemia. These differences in patient response during the course of critical illness suggest that potentially dynamic patient characteristics may be as important as insulin therapy protocol implementation in driving a patient’s risk of hypoglycemia. Whether the prospective detection of increased BG variability can be used to limit the rate of hypoglycemia remains to be determined. Additionally, the physiologic etiology of increased variability is unknown.
That the time since the previous BG analysis is independently associated with hypoglycemia deserves some further discussion. These findings are consistent with our previous work that demonstrated a 3% rate of BG less than 60 mg/dL if blood sample analysis extended beyond 3 hours and only 1% if it did not[55]. Our protocol calls for analysis at least every 2 hours, regardless of glucose range and stability. In some cases, IIT protocols have allowed less frequent measurements after glucose values are “stable”. A recent randomized study of nurse titration every 2 hours with and without the availability of every 5 minute glucose values also demonstrated that more frequent glucose analysis can reduce severe hypoglycemia (1.6% intervention vs. 11.5 % control, p − 0.031)[56]
The strengths of this study include its large sample size, robust data collection into a centralized data warehouse, and effectiveness of the computerized IIT protocol in both bringing patients into target range and minimizing hypoglycemia. There are several important limitations however. First, as with many retrospective, uncontrolled analyses, causality cannot be inferred. For example, the role of increased BG variability as an effect of increased disease severity, or a contributing cause, cannot be determined from this data. Additionally, these findings are particular to the computerized IIT protocol to maintain BG of 80–110 mg/dL in use at Vanderbilt University Medical Center, and may not be generalizable to other IIT protocols or less rigorous IIT guidelines. Finally, APACHE II scores and weight were imputed for patients with missing values, thus introducing potential bias if true values differed significantly from imputed values.
CONCLUSIONS
Patients who experience hypoglycemia are characterized by higher BG variability prior to the hypoglycemic event. BG variability increases in the 24 hours preceding a hypoglycemic event, and patients with high BG variability are at increased risk of hypoglycemia during the period of time their BG remains highly variable. Prospectively measuring BG variability may provide a means for early identification of high-risk patients on IIT, and provide new diagnostic and therapeutic opportunities to mitigate this risk. Future studies should focus on identifying the phenotypic and genotypic factors that determine BG variability.
Acknowledgments
Financial support was provided in part by NIH T32 training grant in Diabetes and Endocrinology 5T32DK007061-35 (RK).
Footnotes
Presented at the Academic Surgical Congress, Huntington Beach, CA, 2011.
Publisher's Disclaimer: This is a PDF file of an unedited manuscript that has been accepted for publication. As a service to our customers we are providing this early version of the manuscript. The manuscript will undergo copyediting, typesetting, and review of the resulting proof before it is published in its final citable form. Please note that during the production process errors may be discovered which could affect the content, and all legal disclaimers that apply to the journal pertain.
References
- 1.Dungan KM, Braithwaite SS, Preiser JC. Stress hyperglycaemia. Lancet. 2009;373(9677):1798–807. doi: 10.1016/S0140-6736(09)60553-5. [DOI] [PMC free article] [PubMed] [Google Scholar]
- 2.Furnary AP. Diabetes, hyperglycemia, and the cardiac surgery patient: introduction. Semin Thorac Cardiovasc Surg. 2006;18(4):278–80. doi: 10.1053/j.semtcvs.2006.06.001. [DOI] [PubMed] [Google Scholar]
- 3.Furnary AP, Wu Y. Clinical effects of hyperglycemia in the cardiac surgery population: the Portland Diabetic Project. Endocr Pract. 2006;12(Suppl 3):22–6. doi: 10.4158/EP.12.S3.22. [DOI] [PubMed] [Google Scholar]
- 4.Egi M, et al. Blood glucose concentration and outcome of critical illness: the impact of diabetes. Crit Care Med. 2008;36(8):2249–55. doi: 10.1097/CCM.0b013e318181039a. [DOI] [PubMed] [Google Scholar]
- 5.Umpierrez GE, et al. Hyperglycemia: an independent marker of in-hospital mortality in patients with undiagnosed diabetes. J Clin Endocrinol Metab. 2002;87(3):978–82. doi: 10.1210/jcem.87.3.8341. [DOI] [PubMed] [Google Scholar]
- 6.Latham R, et al. The association of diabetes and glucose control with surgical-site infections among cardiothoracic surgery patients. Infect Control Hosp Epidemiol. 2001;22(10):607–12. doi: 10.1086/501830. [DOI] [PubMed] [Google Scholar]
- 7.Masla M, et al. HbA1c and Diabetes Predict Perioperative Hyperglycemia and Glycemic Variability in On-Pump Coronary Artery Bypass Graft Patients. J Cardiothorac Vasc Anesth. doi: 10.1053/j.jvca.2010.09.028. [DOI] [PubMed] [Google Scholar]
- 8.Van den Berghe G, et al. Intensive insulin therapy in the critically ill patients. N Engl J Med. 2001;345(19):1359–67. doi: 10.1056/NEJMoa011300. [DOI] [PubMed] [Google Scholar]
- 9.Devos P, Presier JC. Current Controversies Around Tight Glucose Control in Critically Ill Patients. Curr Opin Clin Nutr Metab Care. 2007;10:206–209. doi: 10.1097/MCO.0b013e3280147d2d. [DOI] [PubMed] [Google Scholar]
- 10.Brunkhorst FM, et al. Intensive insulin therapy and pentastarch resuscitation in severe sepsis. N Engl J Med. 2008;358(2):125–39. doi: 10.1056/NEJMoa070716. [DOI] [PubMed] [Google Scholar]
- 11.Investigators. NICE-SUGAR Trial, Intensive versus conventional glucose control in critically ill patients. N Engl J Med. 2009;360(13):1283–97. doi: 10.1056/NEJMoa0810625. [DOI] [PubMed] [Google Scholar]
- 12.Griesdale DE, et al. Intensive insulin therapy and mortality among critically ill patients: a meta-analysis including NICE-SUGAR study data. CMAJ. 2009;180(8):821–7. doi: 10.1503/cmaj.090206. [DOI] [PMC free article] [PubMed] [Google Scholar]
- 13.Blondet JJ, Beilman G. Glycemic Control and Prevention of Perioperative Infection. Curr Opin Crit Care. 2007;13:421–427. doi: 10.1097/MCC.0b013e32826388a1. [DOI] [PubMed] [Google Scholar]
- 14.Furnary AP. Clinical benefits of tight glycaemic control: focus on the perioperative setting. Best Pract Res Clin Anaesthesiol. 2009;23(4):411–20. doi: 10.1016/j.bpa.2009.10.001. [DOI] [PubMed] [Google Scholar]
- 15.Furnary AP, et al. Continuous insulin infusion reduces mortality in patients with diabetes undergoing coronary artery bypass grafting. J Thorac Cardiovasc Surg. 2003;125(5):1007–21. doi: 10.1067/mtc.2003.181. [DOI] [PubMed] [Google Scholar]
- 16.Furnary AP, Wu Y, Bookin SO. Effect of hyperglycemia and continuous intravenous insulin infusions on outcomes of cardiac surgical procedures: the Portland Diabetic Project. Endocr Pract. 2004;10(Suppl 2):21–33. doi: 10.4158/EP.10.S2.21. [DOI] [PubMed] [Google Scholar]
- 17.Furnary AP, et al. Continuous intravenous insulin infusion reduces the incidence of deep sternal wound infection in diabetic patients after cardiac surgical procedures. Ann Thorac Surg. 1999;67(2):352–60. doi: 10.1016/s0003-4975(99)00014-4. discussion 360–2. [DOI] [PubMed] [Google Scholar]
- 18.Van den Berghe G, et al. Intensive insulin therapy in the medical ICU. N Engl J Med. 2006;354(5):449–61. doi: 10.1056/NEJMoa052521. [DOI] [PubMed] [Google Scholar]
- 19.Vlasselaers D, et al. Tight glycemic control protects the myocardium and reduces inflammation in neonatal heart surgery. Ann Thorac Surg. 90(1):22–9. doi: 10.1016/j.athoracsur.2010.03.093. [DOI] [PubMed] [Google Scholar]
- 20.Preiser JC, Devos P. Clinical Experience with Tight Glucose Control by Intensive Insulin Therapy. Crit Care Med. 2007;35(9):S503–S507. doi: 10.1097/01.CCM.0000278046.24345.C7. [DOI] [PubMed] [Google Scholar]
- 21.Schultz MJ, Harmsen RE, Spronk PE. Clinical review: Strict or loose glycemic control in critically ill patients--implementing best available evidence from randomized controlled trials. Crit Care. 2010;14(3):223. doi: 10.1186/cc8966. [DOI] [PMC free article] [PubMed] [Google Scholar]
- 22.Mowery NT, Dossett LA, Gunter OL, Guillamondegui OD, Diaz JJ, Jr, Collier BC, Dortch MJ, May AK. Duration on Protocol Predicts Severe Hypoglycemia While on Intensive Insulin Therapy in the Surgically Critically Ill Population [Google Scholar]
- 23.Vriesendorp TM, DeVries H, de Jonge E, Fosendaal FR, Schultz MJ, Hoekstra JBL. Predisposing Factors for Hypoglycemia in the Intensive Care Unit. Crit Care Med. 2006;34(1):96–101. doi: 10.1097/01.ccm.0000194536.89694.06. [DOI] [PubMed] [Google Scholar]
- 24.Arabi YM, Tamim HM, Rishu AH. Hypoglycemia with Intensive Insulin Therapy in Critically Ill Patients: Predisposing Factors and Association with Mortality. Crit Care Med. 2009;37(9):2536–2542. doi: 10.1097/CCM.0b013e3181a381ad. [DOI] [PubMed] [Google Scholar]
- 25.Dickerson RN, et al. Increased hypoglycemia associated with renal failure during continuous intravenous insulin infusion and specialized nutritional support. Nutrition. doi: 10.1016/j.nut.2010.08.009. [DOI] [PubMed] [Google Scholar]
- 26.Mowery NT, Guillamondegui O, Gunter OL, Diaz JJ, Jr, Collier BC, Dossett LA, Dortch MJ, May AK. Severe Hypoglycemia While on Intensive Insulin Therapy is not an Independent Predictor of Death after Trauma. doi: 10.1097/TA.0b013e3181c825f2. [DOI] [PubMed] [Google Scholar]
- 27.Hermanides J, Bosman RJ, Vriesendorp TM, Dotsch R, Rosendaal FR, Zandstra DF, Hoekstra JBL, DeVries JH. Hypoglycemia is Associated with Intensive Care Unit Mortality. Crit Care Med. 2010;38(6):1430–1434. doi: 10.1097/CCM.0b013e3181de562c. [DOI] [PubMed] [Google Scholar]
- 28.Kosiborod M, Inzucchi SE, Goyal A, Krumholz HM, Masoudi FA, Xiao L, Spertus JA. Relationship Between Spontaneous and Iatrogenic Hypoglycemia and Mortality in Patients Hospitalized with Acute MI. JAMA. 2009;301(15):1556–1564. doi: 10.1001/jama.2009.496. [DOI] [PubMed] [Google Scholar]
- 29.Al-Dorzi Tamim HM, Arabi YM. Glycaemic fluctuation predicts mortality in critically ill patients. Anaesth Intensive Care. 2010;38(4):695–702. doi: 10.1177/0310057X1003800413. [DOI] [PubMed] [Google Scholar]
- 30.Ali NA, O’Brien JM, Jr, Dungan K, Phillips G, Marsh CB, Lemeshow S, Connors AF, Jr, Presier J. Glucose Variability and Mortality in Patients with Sepsis. Crit Care Med. 2008;36(8):2316–2321. doi: 10.1097/CCM.0b013e3181810378. [DOI] [PMC free article] [PubMed] [Google Scholar]
- 31.Bagshaw SM, et al. The impact of early hypoglycemia and blood glucose variability on outcome in critical illness. Crit Care. 2009;13(3):R91. doi: 10.1186/cc7921. [DOI] [PMC free article] [PubMed] [Google Scholar]
- 32.Dossett LA, Cao H, Mowery NT, Dortch MJ, Morris JM, May AK. Blood Glucose Variability is Associated with Mortality in the Surgical Intensive Care Unit. American Surgeon. 2008;74:679–685. doi: 10.1177/000313480807400802. [DOI] [PubMed] [Google Scholar]
- 33.Egi M, Bellomo R. Reducing glycemic variability in intensive care unit patients: a new therapeutic target? J Diabetes Sci Technol. 2009;3(6):1302–8. doi: 10.1177/193229680900300610. [DOI] [PMC free article] [PubMed] [Google Scholar]
- 34.Egi M, Bellomo R, Stachowski E, French CJ, Hart G. Variability of Blood Glucose Concentration and Short-Term Mortality in Critically Ill Patients. Anesthesiology. 2006;105:244–252. doi: 10.1097/00000542-200608000-00006. [DOI] [PubMed] [Google Scholar]
- 35.Freire AX, Murillo LC. How “sweet” complexity is and how “bitter” variability can be; the new aspect of intensive care unit hyperglycemia. Crit Care Med. 2010;38(3):996–7. doi: 10.1097/CCM.0b013e3181ce217e. [DOI] [PubMed] [Google Scholar]
- 36.Hermanides J, Vriesendorp TM, Bosman RJ, Zandstra DF, Hoekstra JB, DeVries JH. Glucose Variability is Associated with Intensive Care Unit Mortality. Crit Care Med. 2010;38(3):838–842. doi: 10.1097/CCM.0b013e3181cc4be9. [DOI] [PubMed] [Google Scholar]
- 37.Hirshberg E, Larsen G, Van Duker H. Alterations in Glucose Homeostasis in the Pediatric Intensive Care Unit: Hyperglycemia and Glucose Variability are Associated with Increased Mortality and Morbidity. Pediatr Crit Care Med. 2008;9(4):361–366. doi: 10.1097/PCC.0b013e318172d401. [DOI] [PubMed] [Google Scholar]
- 38.Krinsely JS. Glycemic Variability: A Strong Independent Predictor of Mortality in Critically Ill Patients. Crit Care Med. 2008;36(11):3008–3012. doi: 10.1097/CCM.0b013e31818b38d2. [DOI] [PubMed] [Google Scholar]
- 39.Krinsley JS. Glycemic variability and mortality in critically ill patients: the impact of diabetes. J Diabetes Sci Technol. 2009;3(6):1292–301. doi: 10.1177/193229680900300609. [DOI] [PMC free article] [PubMed] [Google Scholar]
- 40.Pidcoke HF, et al. Glucose variability is associated with high mortality after severe burn. J Trauma. 2009;67(5):990–5. doi: 10.1097/TA.0b013e3181baef4b. [DOI] [PubMed] [Google Scholar]
- 41.Rake AJ, et al. Glucose variability and survival in critically ill children: allostasis or harm? Pediatr Crit Care Med. 2010;11(6):707–12. doi: 10.1097/PCC.0b013e3181e88b1f. [DOI] [PubMed] [Google Scholar]
- 42.Zhang XL, et al. Association between glucose variability and adverse in-hospital outcomes for Chinese patients with acute coronary syndrome. Saudi Med J. 31(10):1146–51. [PubMed] [Google Scholar]
- 43.Lundelin K, Vigil L, Bua S, Gomez-Mestre I, Honrubia T, Varela M. Differences in Complexity of Glycemic Profile in Survivors and Nonsurvivors in an Intensive Care Unit: A Pilot Study. Crit Care Med. 2010;38(3):849–854. doi: 10.1097/CCM.0b013e3181ce49cf. [DOI] [PubMed] [Google Scholar]
- 44.Raju TA, Torjman MC, Goldberg ME. Perioperative Blood Glucose Monitoring in the General Surgical Population. J Diabetes Sci Technol. 2009;3(6):1282–1287. doi: 10.1177/193229680900300607. [DOI] [PMC free article] [PubMed] [Google Scholar]
- 45.Jacka MJ, Torok-Both CJ, Bagshaw SM. Blood glucose control among critically ill patients with brain injury. Can J Neurol Sci. 2009;36(4):436–42. doi: 10.1017/s0317167100007757. [DOI] [PubMed] [Google Scholar]
- 46.Siegelaar SE, et al. Glucose variability; does it matter? Endocr Rev. 2010;31(2):171–82. doi: 10.1210/er.2009-0021. [DOI] [PubMed] [Google Scholar]
- 47.Boord JB, Sharifi M, Greevy RA, et al. Computer-Based Insulin Infusion Protocol Improves Glycemia Control over Manual Protocol. J Am Med Inform Assoc. 2007;14:278–287. doi: 10.1197/jamia.M2292. [DOI] [PMC free article] [PubMed] [Google Scholar]
- 48.Dortch MJ, Mowery N, Ozdas A, et al. A Computerized Insulin Infusion Titration Protocol Improves Glucose Control with Less Hypoglycemia Compared to a Manual Titration Protocol in a Trauma Intensive Care Unit. JPEN. 2008;32:18–27. doi: 10.1177/014860710803200118. [DOI] [PubMed] [Google Scholar]
- 49.White NH, Skor D, Santiago JV. Practical Closed-Loop Insulin Delivery. A Sytem for Maintenance of Overnight Euglycemia and the Calculation of Basal Insulin Requirements in Insulin-Dependent Diabetics. Ann Intern Med. 1982;97:210–213. doi: 10.7326/0003-4819-97-2-210. [DOI] [PubMed] [Google Scholar]
- 50.Bode BW, Braithwaite SS, Steed RD, Davidson PC. Intravenous Insulin Infusion Therapy: Indications, Methods, and Transition to Subcutaneous Insulin Therapy. Endocr Pract. 2004;10(Suppl 2):71–80. doi: 10.4158/EP.10.S2.71. [DOI] [PubMed] [Google Scholar]
- 51.Kovatchev BP, Cox DJ, Gonder-Frederick LA, Clarke WL. Symmetrization of the Blood Glucose Measurement Scale and its Applications. Diabetes Care. 1997;20:1655–1658. doi: 10.2337/diacare.20.11.1655. [DOI] [PubMed] [Google Scholar]
- 52.Huber PJ. Proc Fifth Berkeley Symposium Math Stat. 1967;1:221–233. [Google Scholar]
- 53.White H. Econometrica. 1982;50:1–25. [Google Scholar]
- 54.Harrell FE. Regression modeling strategies with applications to linear m odels, logistic regression, and survival analysis. 1. Springer-Verlag; New York, NY: 2001. [Google Scholar]
- 55.Dossett LA, Collier B, Donahue R, Mowery NT, Dortch MJ, Guillamondegui O, Diaz JJ, May AK. Intensive Insulin Therapy in Practice: Can We Do It? JPEN. 2009;33(1):14–20. doi: 10.1177/0148607108321703. [DOI] [PubMed] [Google Scholar]
- 56.Holzinger U, Warszowska J, Kitzberger R, Wewalka M, Miehslar W, Herkner H, Madl C. Real-Time Continuous Glucose Monitoring in Critically Ill Patients. Diabetes Care. 2010;33:467–472. doi: 10.2337/dc09-1352. [DOI] [PMC free article] [PubMed] [Google Scholar]