

Abstract
Background
Convection enhanced delivery (CED) permits site-specific therapeutic drug delivery within interstitial spaces at increased dosages through circumvention of the blood brain barrier. CED is currently limited by suboptimal methodologies for monitoring the delivery of therapeutic agents which would permit technical optimization and enhanced therapeutic efficacy.
Objective
To determine if a readily-available small molecule MRI contrast agent, gadolinium–diethylene triamine pentaacetic acid (Gd-DTPA), could effectively track the distribution of larger therapeutic agents.
Methods
Gd-DTPA was co-infused with the larger molecular tracer, 124I-labeled human serum albumin (124I-HSA), during CED of an EGFRvIII-specific immunotoxin as part of treatment for a patient with glioblastoma (GBM).
Results
Infusion of both tracers was safe in this patient. Analysis of both Gd-DTPA and 124I-HSA during and after infusion revealed a high degree of anatomical and volumetric overlap.
Conclusion
Gd-DTPA may be able to accurately demonstrate the anatomic and volumetric distribution of large molecules used for anti-tumor therapy with high resolution and in combination with fluid-attenuated inversion recovery (FLAIR) imaging, and provide additional information about leak into cerebrospinal fluid spaces and resection cavities. Similar studies should be performed in additional patients to validate our findings and help refine the methodologies we employed.
Keywords: brain neoplasms, convection, drug delivery systems, gadolinium DTPA, iodine radioisotopes, magnetic resonance imaging, positron-emission tomography
Introduction
Glioblastoma (GBM) remains universally fatal. To an important degree, this is because existing therapies are limited by an inability to cross the restrictive blood brain barrier. This results in non-targeted systemic or intrathecal delivery, which is ultimately limited by systemic toxicity or injury to surrounding tissues and produces suboptimal drug delivery at the tumor site. Convection-enhanced delivery (CED) is an innovative approach that uses a hydrostatic pressure gradient to percolate therapeutic compounds through the interstitial spaces of infiltrated brain and tumors.1 This bypasses the blood brain barrier and takes advantage of its restrictive nature to limit drug egress out of the brain.2,3 CED allows targeted regional delivery and dramatically increases the drug dose that can be provided at the tumor site.2, 3 Still, multiple phase III trials applying this or similar approaches have failed to meet their endpoints positively.4, 5 Although this could be due to ineffective therapeutic agents or heterogeneous targets,6 we and others have previously shown that catheter placement dramatically affects drug delivery.7, 8 Despite the use of rigorous guidelines and computer simulations,9 the vast majority of patients fail to receive a significant amount of coverage of the area at risk for tumor recurrence.
Within this context, it is surprising that so little work has been done to monitor the delivery of therapeutic agents using CED. Such monitoring would be akin to standard pharmacokinetics, which are a prerequisite for the development of drugs delivered systemically. In part, the low concentrations of therapeutic agents typically delivered locally limit the opportunities for direct monitoring of drug delivery. However, for some time now, the concept of surrogate tracers has been seen as an acceptable alternative for approximating drug delivery.10–14 We15 and others16, 17 have previously shown that in some cases magnetic resonance imaging (MRI) signal changes can provide insights to drug delivery in the absence of tracers, but these may be unreliable, especially in the context of preexisting edema, which is frequently seen when intracerebral tumors are being targeted. As an alternative, we have also used single photon emission computed tomography (SPECT) imaging during infusion of 123I-labeled human serum albumin (123I-HSA) to estimate drug delivery and to derive principles that govern CED.7, 9, 15, 18–20 While such imaging has led to a better understanding of CED, this imaging has, more than anything, demonstrated the dire need for drug monitoring. Unfortunately, the images provided by SPECT imaging of 123I-HSA are of relatively low resolution. In addition, the short half-life (13.2 hours) of 123I limits observation time with a single dose of 123I- HSA, and the technical capabilities to use 123I-HSA are not widely available.
While gadolinium–diethylene triamine pentaacetic acid (Gd-DTPA) is a widely available MRI contrast agent, there has been speculation that its small molecular weight (938 Dalton) could put serious constraints on its ability to predict the distribution of the larger molecules typically infused therapeutically with CED, especially with infusion volumes >2 mLs or infusion rates <0.5 μL/min, where diffusion is a dominant force in these distributions. As a result, others have creatively applied this surrogate tracer with some advantage by incorporating it into drug impregnated liposomes14 or by infusing it into the brainstem where volumes of infusion are low.10, 12, 14 Liposome constructs, however, require complex manufacturing processes and are also not widely available, and most tumors needing treatment are located in the supratentorial compartment.
Because the development of large molecule tracers labeled with gadolinium (Gd) has been problematic, we hypothesized that infusion of low molecular weight Gd-DTPA may be able to predict the distribution of larger molecules by systematic post-infusion manipulation of the images based on theoretical differences in the predicted distribution of the Gd-DTPA and the therapeutic drug being infused. To test this hypothesis, we simultaneously infused a patient with a supratentorial recurrent malignant glioma with an EGFRvIII-targeted immunotoxin in combination with 124I-HSA (to permit PET imaging) and Gd-DTPA. We demonstrate that Gd-DTPA infusions provide direct information about the distribution of large molecules with high resolution and in combination with fluid-attenuated inversion recovery (FLAIR) imaging, provide additional information about leak into cerebrospinal fluid spaces and resection cavities.
Methods
Patient Selection, Study Design, and Toxicity Monitoring
The patient reported here was treated under an Institutional Review Board- and U.S. Food and Drug Administration-approved protocol at Duke University (Pro00011617, BB-IND-12,589). For this protocol, adults with a Karnofsky performance status (KPS) score >70% and residual, progressive, or recurrent supratentorial malignant primary brain tumor with measurable disease (>0.5cm defined on contrast-enhanced brain MRI) were enrolled. Patients were excluded if they had evidence of cerebral uncal herniation or diffuse subependymal disease. An interval of at least 4 weeks between prior surgery, radiation or chemotherapy at enrollment was required.
This protocol was designed primarily to determine the maximum tolerated dose (MTD) and dose limiting toxicity (DLT) of tumor-specific immunotoxin, MR1-1KDEL (~64 KDa). MR1-1KDEL is a recombinant chimeric protein composed of a disulfide-stabilized variable region fragment (dsFv) of an epidermal growth factor receptor mutant-specific (EGFRvIII) monoclonal antibody, and a genetically engineered form of the Pseudomonas exotoxin, PE-38.21 The targeting moiety of this immunotoxin specifically binds the tumor-specific EGFRvIII. The escalating concentrations of MR1-1KDEL were selected for study as follows: 25 ng/ml, 50 ng/ml, 100 ng/ml, 200ng/mL, 400 ng/mL, 800 ng/mL, and 1600 ng/mL. The patient reported here received the study drug at the 25 ng/mL concentration and co-infused with Gd-DTPA and 124I-HSA at a concentration of 4 microcuries (μCi) per mL. MR1-1KDEL is delivered intracerebrally by CED using 2 intracerebral catheters with at least one catheter placed within the enhancing portion of the tumor. The infusion catheters were inserted at coordinates selected by the operating surgeon with the assistance of the clinically-approved BrainLAB iPlan Flow planning station. The catheters were tunneled beneath the scalp for a distance of at least 5 cm to aid in the prevention of infection. A pressure transducer was placed at the end of each of the infusion catheters to monitor intracerebral pressure. A CT scan was used to confirm catheter placement post-operatively. After the patient had the catheters placed under image guidance, the infusate was started with MRI imaging and PET/CT scans obtained at 24 and 72 hours after catheter placement. The patient was infused at a rate of 0.5 mL/h from each catheter for a total of 96 hours delivering 48 mL from each catheter for a total of 96 mLs. A fresh formulation of study drug is used each 24 hours. 124I-HSA is co-infused along with 1 mM Gd-DTPA and positron-emission tomography (PET)/computed tomography (CT) scans are obtained at 1 and 3 days after starting the infusion to monitor volume of drug distribution and leakage into the cerebrospinal fluid (CSF) spaces. Corticosteroids were administered prior to and during infusion.
The patient underwent serial neurological examinations up to 24 hours post transfusion in the neurological intensive care unit, and normal laboratory values were obtained regularly. The clinical study was monitored externally as well by the Duke Medical Center Protocol Review and Monitoring System in accordance with the NCI-approved and NIH sponsored research protocol.
MRI
MRI for infusate tracking was acquired on a 3T magnet (Siemens Tim Trio, Siemens Healthcare, Erlangen, Germany) using an 8-channel dedicated head coil prior to catheter placement and 1 and 3 days after the start of infusion. 3D Gradient Recalled Echo (3D-FLASH) images (TR=20msec, TE= 4.92 msec, 256×256 matrix, 25cm field of view, 1mm slice thickness) were acquired at two different flip angles: 6 and 34 degrees. These parameters were optimized for T1-mapping to quantify Gd-DTPA concentration.22 In addition, T2-weighted Turbo Spin Echo (TR=5000msec, TE=100msec, 140 degree flip angle) and FLAIR (TR=12280msec, TE=98msec, TI=2500msec, 160 degree flip angle) were both acquired with 3mm slices, no gap, 256×256 matrix, and 22cm field of view.
T1 maps were computed for the baseline, 1-day, and 3-day time points by the variable flip angle method22 using the 6- and 34-degree 3D-FLASH acquisition pairs. With only two flip angles, the T1 is calculated from the following formula:
where α1 and α2 represent the flip angles and s1 and s2 are the corresponding signal values at these two flip angles. Gd-DTPA concentration maps are then computed from the post-infusion T1 and the baseline T1 (denoted T10) using the relation:
where R1 is the T1 relaxivity constant and C is the concentration of the Gd compound. The relaxivity of Gd-DTPA is dependent on many factors, including the field strength, the pulse sequence, the temperature, and the surrounding tissue.23 In the 3T scanner, a value of approximately 4 L/mmol-sec is usually observed, and this value is used in our computations. Slightly lower relaxivities have been reported previously.24 Thus, our measure may be conservative and slightly underestimate the Gd-DTPA concentration.
PET/CT
Imaging was performed on a hybrid PET/CT scanner (GE STE) using 3D PET acquisition and low-dose CT (5 mAs) for attenuation-correction. The CT images were also used for anatomic reference for co-registration to the MRI scans. PET/CT imaging was acquired over a single bed position (15 cm) with an acquisition time of 10 min. Transaxial field of view was 25.6 cm with 3.27 mm slice thickness. PET images were produced using iterative reconstruction (OSEM; 28 subsets, 5 iterations; z-axis filter=light, post filter 3.5mm FWHM). Randoms corrected by singles, scatter, dead-time and decay corrections were applied.
Regions of interest on the PET scans were used to measure the 124I activity concentration at the 1-day and 3-day time points, immediately after the MRI. The activity concentrations were corrected for decay of the isotope from the calibration of the infusate prior to infusion to the time of PET measurement.
Co-registration
All of the MR and PET/CT images at the 1 and 3 day time points were co-registered to the baseline pre-placement MRI 34-degree 3D-FLASH, using a hierarchical optimization technique based on maximizing the mutual information.25 The PET scans were then transformed using the co-registration of their corresponding co-located CT.
Concordance of Distribution
The concordance of the volume of distribution of the infused Gd-DTPA and the 124I-HSA was evaluated by dividing the concordant volume (volume for which the Gd-DTPA and the 124I-HSA overlapped) by the union of the two volumes as previously described by us.9 The worst-case disparity in the boundaries of the two distributions was evaluated by measuring the maximum distance between the distribution of Gd-DTPA and the 124I-HSA at the 10% isodose level.
Results
Two catheters (PIC-030 Vygon Neuro in Norristown, PA) were placed into a 56 year-old male with recurrent anaplastic astrocytoma. Prior therapies had included craniotomy, radiation, temozolomide, irinotecan, and bevacizumab. The infusion rate was 0.5 mL/h. The catheter locations are shown in Figure 1 on T1-weighted unenhanced MR scans. The first catheter trajectory (Fig. 1, A&C) passed directly through the tumor, anterior to the resection cavity. The tip was 7mm from the nearest visible sulcus (at the midline) and 4mm from the resection cavity. No sulci were visible along the trajectory. There was a cluster of small air bubbles along the distal 1 cm of the catheter. The second catheter (Fig. 1, B&D) was placed in the white matter edema posterior to the resection cavity at a distance of 14mm from the resection cavity edge. The catheter tip is 2mm from a ventricle. The shaft does not appear to pass near any sulci. One large air bubble of about 240 μl was present along the catheter shaft between 2 and 3 cm from the catheter tip.
Figure 1.
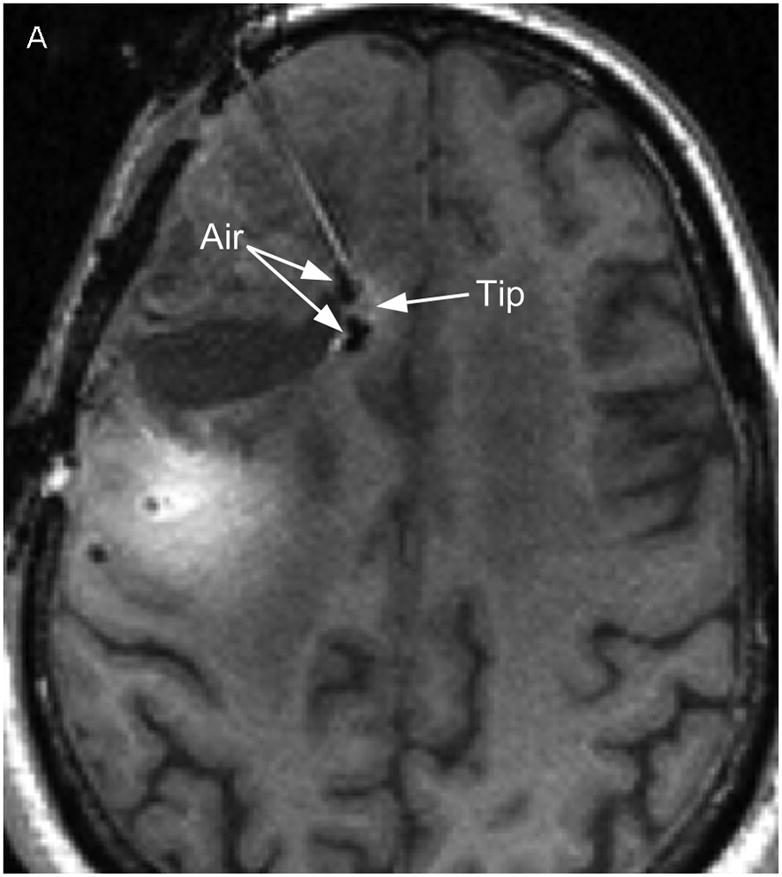
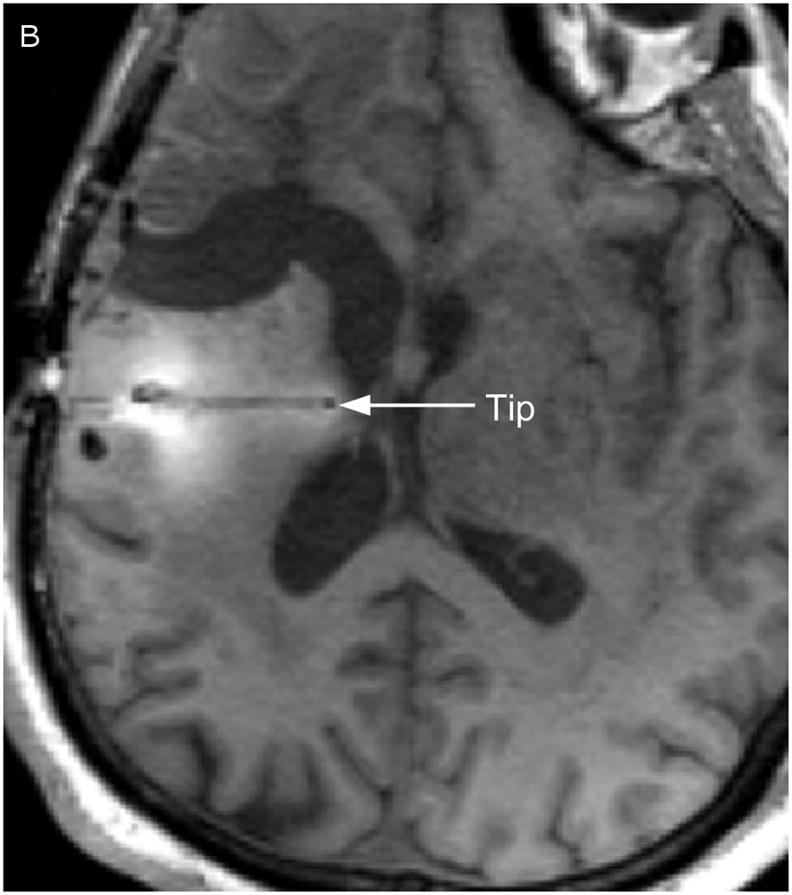
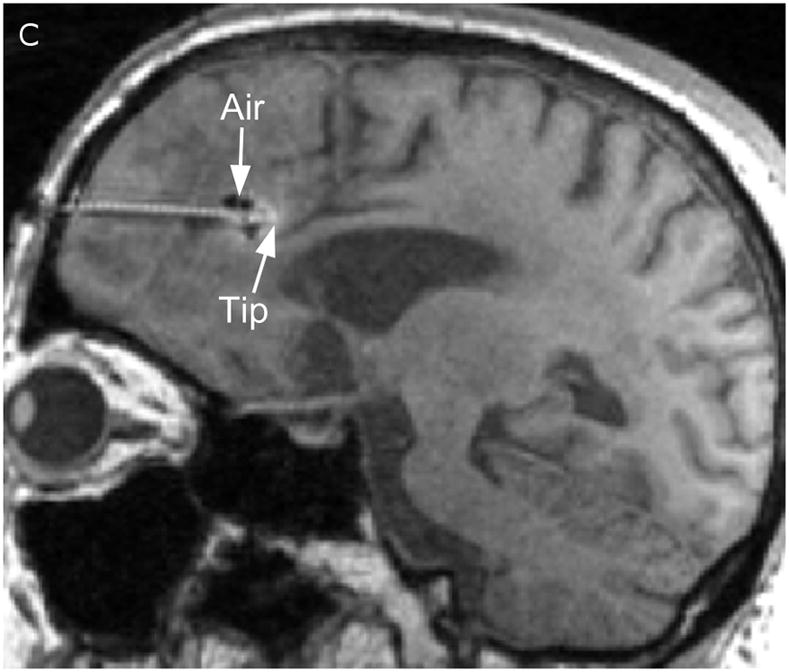
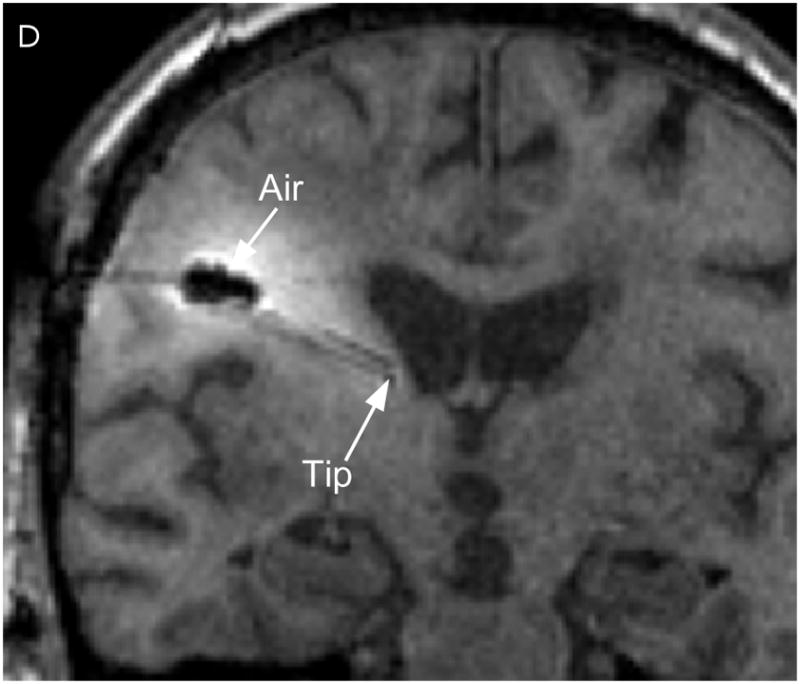
Catheter locations. A T1-weighted MRI acquisition after 24 hours of infusion was re-sliced obliquely to show the full catheter extent in two perpendicular planes. The anterior catheter is shown in two views on the left panels (A & C), and the posterior catheter in two planes on the right panels (B & D).
In Figure 2, the T1-weighted MRI images obtained at 24 (Fig. 2A) and 72 hours (Fig. 2C) are shown in the left column, and compared to the measured Gd-DTPA concentrations obtained from them on the right (Fig. 2, B &D). The minimum concentration that yielded a faint visible increase in signal intensity in the T1-weighted imaging is about 0.05 mmol/L or 5% of the infused concentration. This quantity was used at the lower end of the color-coded concentration range in the figure. Catheter 1 (anterior to the resection cavity and within enhancing tumor) generated a very low distribution volume, centered around the distal 1 cm of the tip. The tip was placed very near the resection cavity, and it is likely that the resection cavity served as a path for the loss of infusate. Catheter 2 (posterior to the resection cavity, in edematous white matter) resulted in a larger distribution volume in the white matter centered around the shaft at the location of the air bubble (2–3 cm from the tip). There was very little distribution near the tip.
Figure 2.
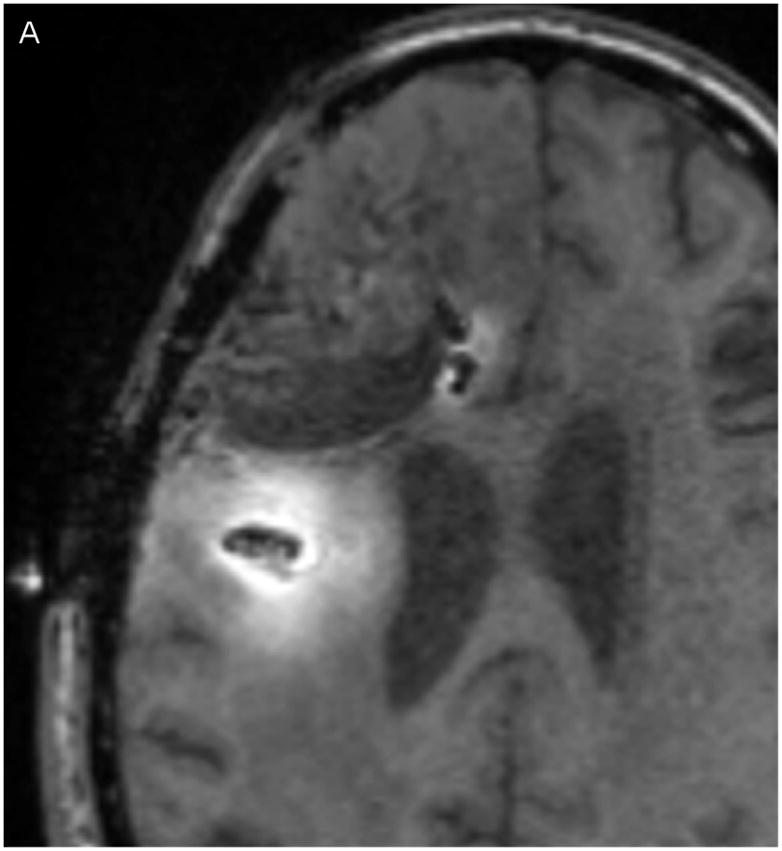
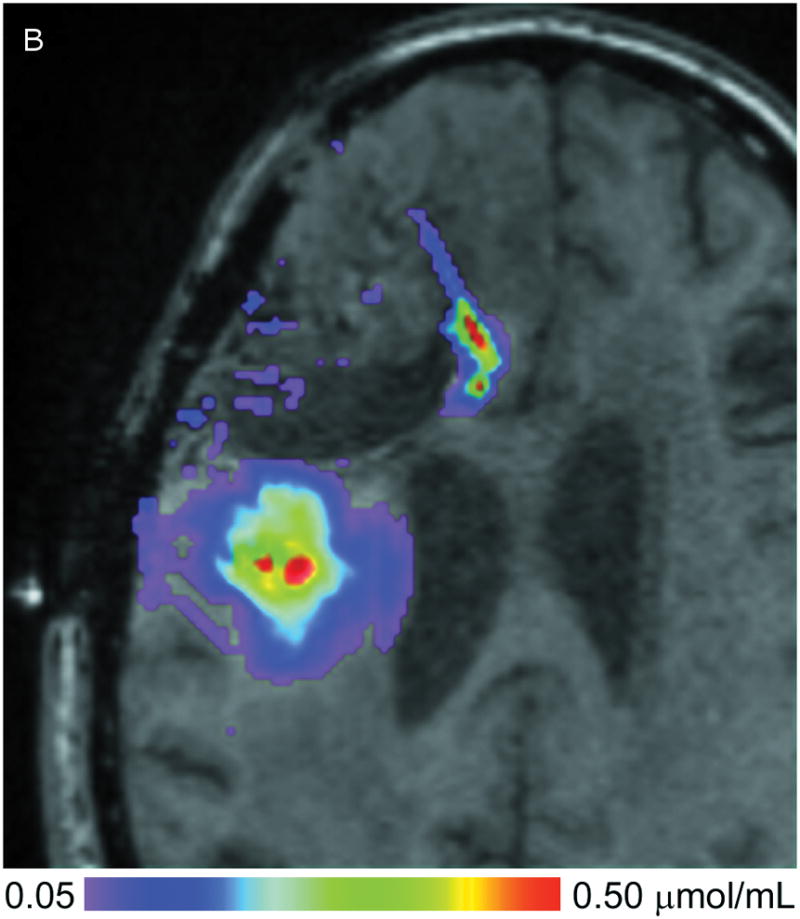
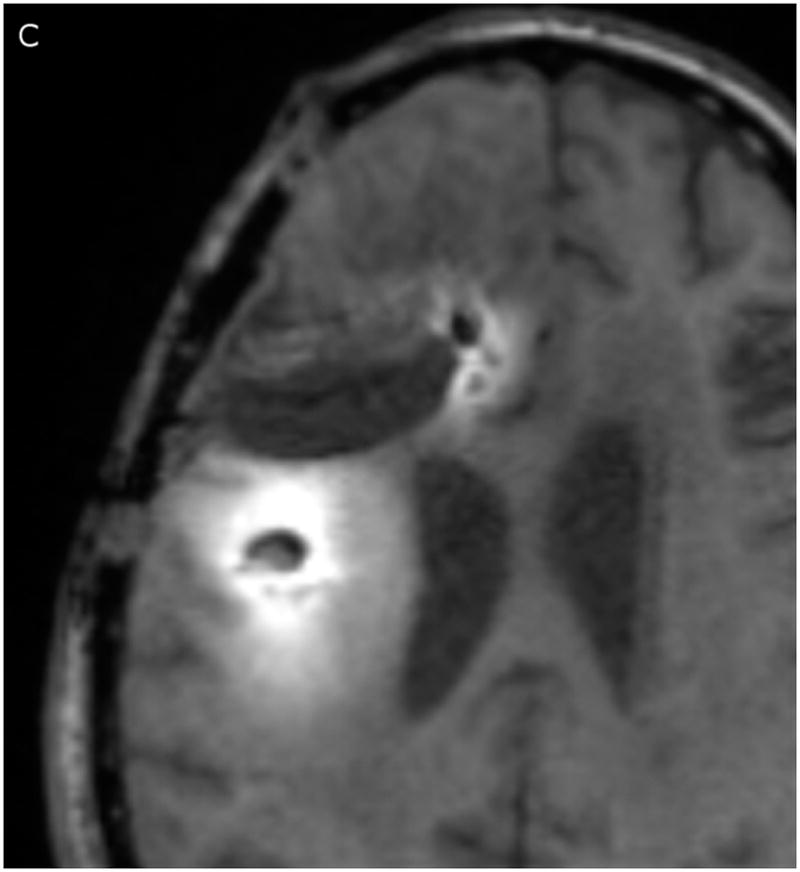
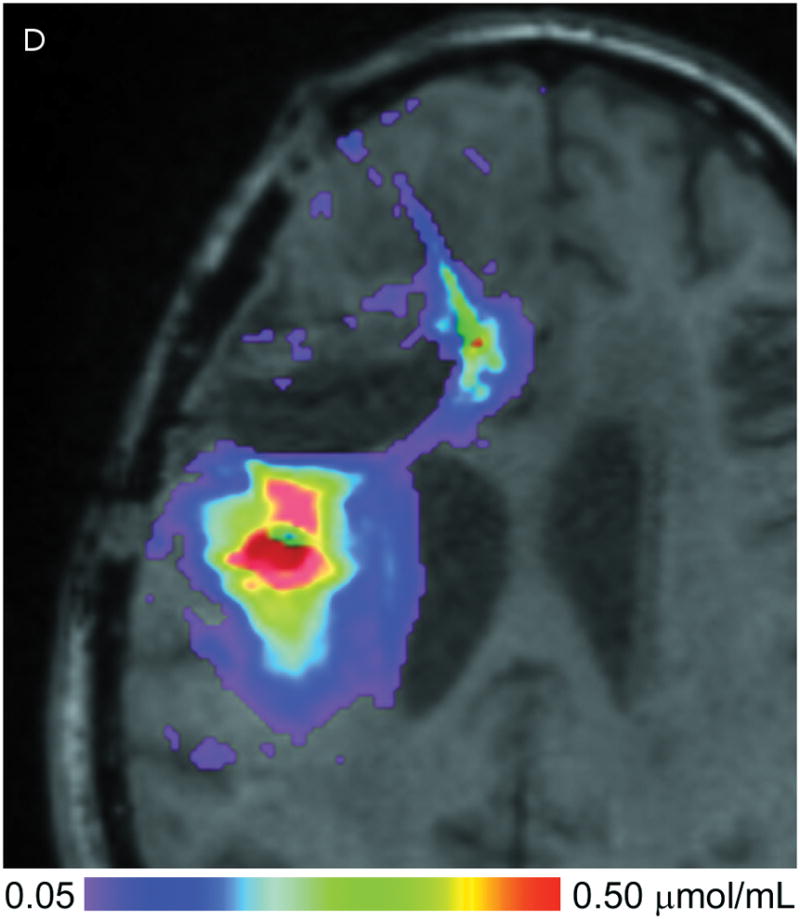

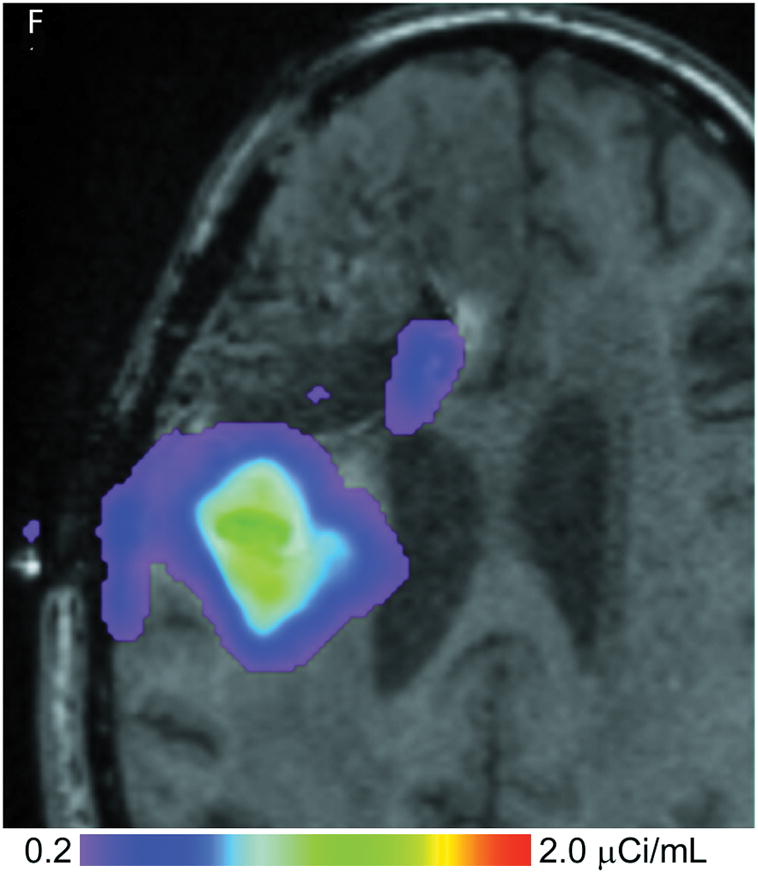

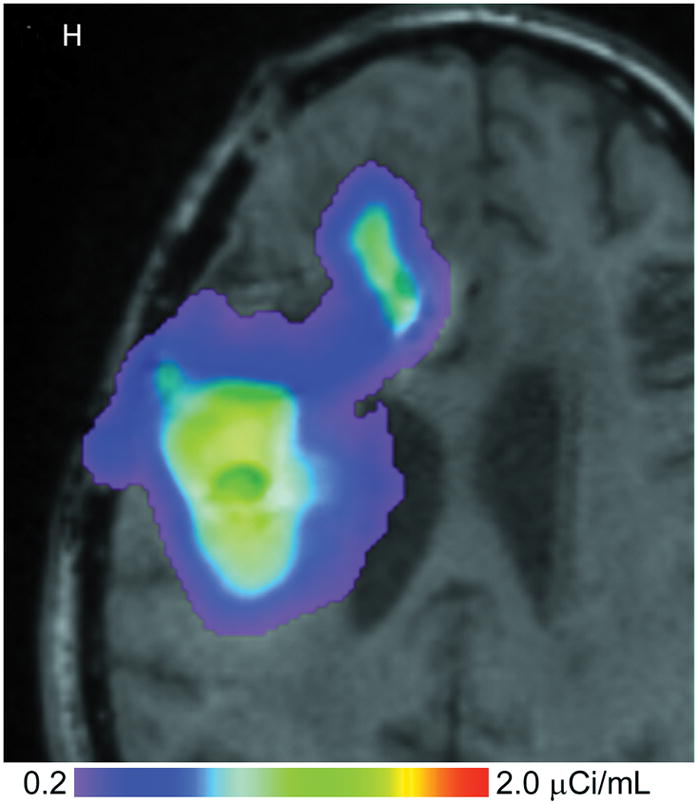
(A–D) T1-weighted MRI signal (left panels) compared to measured Gd-DTPA concentration profile (right panels). (E–H) T1-weighted MRI signal (left panels) with overlaid 124I-HSAconcentration (right panels). (A) T1-weighted signal at 24 hours, (B) Gd concentration at 24 hours, (C) T1-weighted signal at 72 hours, (D) Gd concentration at 72 hours. (E) T1-weighted signal at 24 hours, (F) 124I-HSA activity at 24 hours, (G) T1-weighted signal at 72 hours, (H) 124I-HSA activity at 72 hours.
Overall volumes, amounts, and peak concentrations of Gd-DTPA at the two measurement time points are shown in Table 1. Vi and Vd denote volumes of infusion and distribution, respectively. The volume of distribution was calculated at 0.1 mmol/L, representing 10% of the infused concentration. Note that both measured volumetric parameters roughly triple between the 1-day and the 3-days. The total amount of Gd-DTPA (μmoles) was also computed by integrating over the concentration in the volume. Only about 15% of the infused Gd-DTPA was measured. Very little measurable Gd-DTPA appears near the anterior catheter, which thus accounts for 50% of the 85% loss.
Table 1.
Quantitative gadolinium–diethylene triamine pentaacetic acid measurements at 1 and 3 days of infusion.
| Time (hours) | Vi (mL)a | Vd @ 10% (mL)b | Ai (μmol)c | Ad (μmol)d | Cmax (μmol/mL)e |
|---|---|---|---|---|---|
| 24 | 21.3 | 11.6 (54%) | 21.3 | 3.31 | 0.375 |
| 72 | 65.6 | 31.0 (47%) | 65.6 | 9.06 | 0.675 |
Vi = Volume of infusion in milliliters (mL);
Vd = Volume of distribution, measured above 10% of the infused concentration;
Ai = gadolinium tracer infused in micromoles (μmol);
Ad = amount of gadolinium tracer measured;
Cmax = peak measured gadolinium concentration.
The peak concentration values, denoted Cmax in the table, increased dramatically over the three days. Averages of several values in the regions of highest concentration that were clearly within tissue were taken to estimate Cmax. Concentration fell rapidly with distance from the catheter, but a large region of infusate had a concentration above 0.25 mmol/L, providing possible evidence that the tissue pore fraction has expanded in these regions.
The PET images were corrected for radionuclide decay by dividing the observed activity concentrations by the decay factor associated with the time between infusate preparation (at a concentration of 4.0 μCi/mL) and the time that it is measured, 24 hours later. There is an inherent difficulty with decay normalization, because each day the infused concentration is reformulated to the 4.0 μCi/mL value, while the already-infused 124I has already decayed. Thus, at the 72-hour measurement, the brain contains equal mixtures of 124I that has decayed 24, 48, and 72 hours, and these differing concentrations cannot be separated. We therefore correct only for the 24-hour decay because this infusate should be nearest the catheter. The concentration at the more distant edges of the infusion are thus somewhat underestimated by this method. This every day change of infusate is to adhere to current FDA guidelines and is not an intrinsic limitation of this technique.
The 24- and 72-hour 124I-HSA concentration maps are overlaid on a co-registered T1-weighted MRI in Figure 2. The color-coded display ranges from 5% to 50% of the approximate infused concentration of about 4 μCi/mL, which corresponds to the display range of the Gd-DTPA concentration. After 24 hours of infusion (Fig. 2, E&F), most of the infusate is centered around the posterior catheter shaft, similar to the distribution seen for the Gd-DTPA concentration measurement. 124I-HSA also appeared to fill the resection cavity and some of the ventricle at a lower concentration even at this earlier time point. After 72 hours of infusion (Fig. 2G&H), the same pattern was seen, but the distribution was expanded in all directions and the concentration near the center of the infusion was higher.
Volumes, amounts, and peak concentrations of 124I-labeled albumin at the two measurement time points are shown in Table 2. The volume of distribution was calculated at a threshold of 0.4 μCi/mL or 10% of the infused concentration. Unlike T1-weighted MRI detection of Gd-DTPA, the PET measurement of 124I-labeled HAS was directly sensitive to leakage into CSF spaces. The total amount of 124I activity (μCi) within the 10% volume of distribution region is computed by integrating the concentration within the Vd region. Approximately 11 – 14% of the infused tracer activity is found within this distribution region.
Table 2.
Quantitative 124I-labeled human serum albumin activity measurements at 1 and 3 days of infusion.
| Time (hours) | Vi (mL)a | Vd @ 10% (mL)b | Ai (μCi)c | Ad (μCi)d | Cmax (μCi/mL)e |
|---|---|---|---|---|---|
| 24 | 21.3 | 13.7 (64%) | 85.2 | 9.5 | 1.4 |
| 72 | 65.6 | 46.0 (70%) | 262.4 | 36.7 | 1.9 |
Vi = Volume of infusion in milliliters (mL);
Vd = Volume of distribution, measured above 10% of the infused concentration;
Ai = amount of radioactive tracer infused, total activity in microcuries (μCi);
Ad = amount of radioactive tracer measured (corrected for decay);
Cmax = peak measured activity level.
Correlation between the Gd-DTPA and 124I-HSA concentration measurements were computed using a threshold of 10% (Figure 3) of the infused concentrations of the two tracer molecules. The two concentrations follow each other surprisingly closely. Using the techniques previously described by us,9 the volume of overlap between the Gd-DTPA and PET distributions at the 10% isodose level was found to be 53% at 24 hours and 56% at 72 hours (Table 3). Perhaps more importantly, the maximum linear distance between the distributions outlined by PET and by Gd-DTPA was only 7 mm at 24 hours and 11 mm at 72 hours. In fact, 90% of the PET distribution that did not match the Gd-DTPA was within 3.5 mm of the Gd-DTPA distribution at 24 hours and 6 mm at 72 hours. The main differences occurred in areas of CSF (resection cavity, brain surface, and ventricle) where the 124I-HSA is detected directly by PET imaging, but is not seen on standard T1-weighted MRIs. It is not clear whether there is an actual difference in concentrations of the two tracers within the CSF or that the Gd-DTPA was simply not as easily measured in CSF. Ignoring leakage into the CSF, which would be rapidly cleared, the areas of overlap between the images of the large and small tracer molecules is remarkable.
Figure 3.
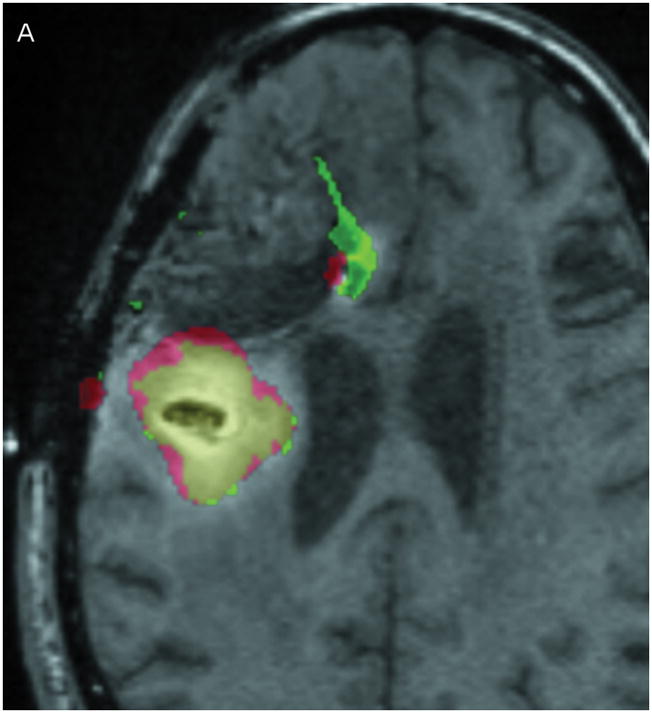
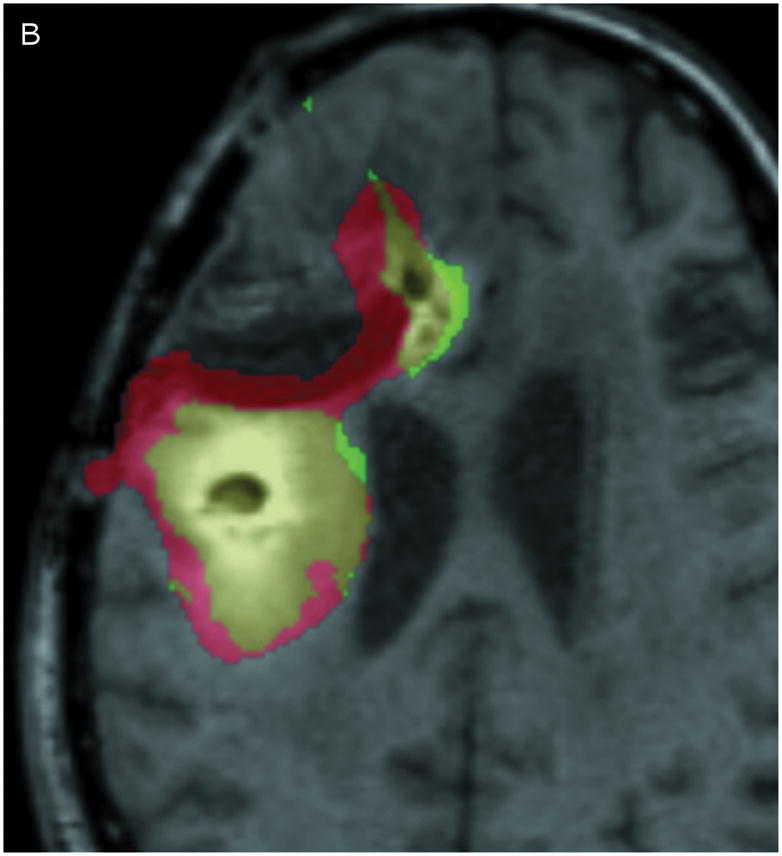
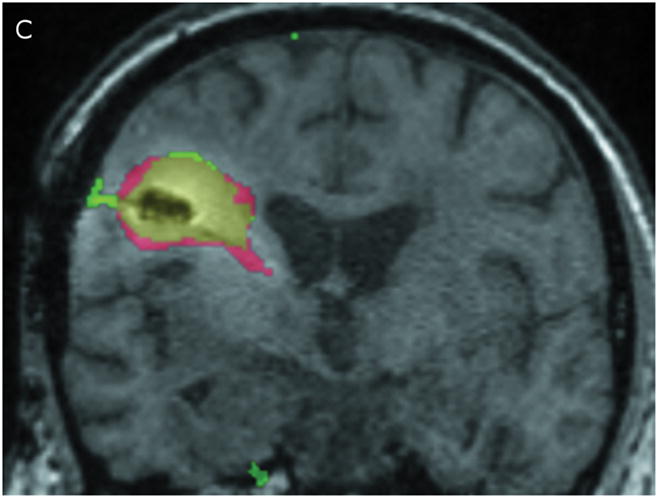
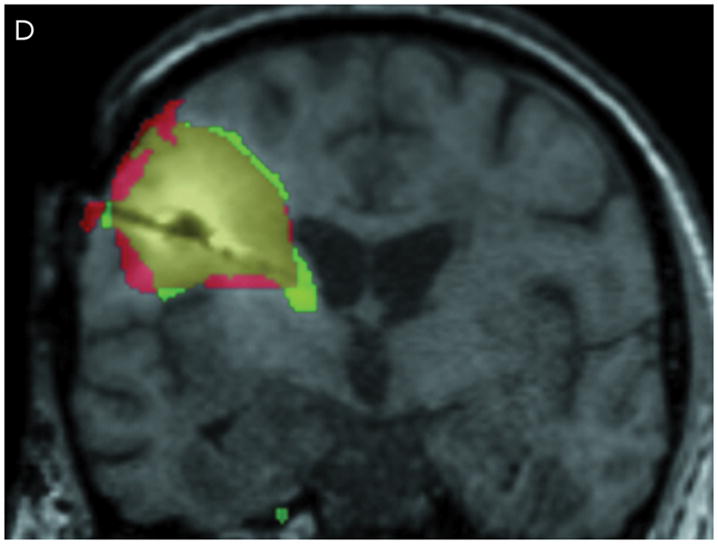
Comparison of Gd-DTPA and 124I-HSAdistribution at 10% of infused concentration. (A & B) Axial images at 24 and 72 hours respectively. (C & D) Coronal images at 24 and 72 hours respectively. Green: Gd-DTPA 10% isodose (0.1 μmol/mL), Red: 124I-HSA10% isodose (0.4 μCi/mL), Yellow: Overlap between the 10% Gd-DTPA and 124I-HSAregions.
Table 3.
Gadolinium–diethylene triamine pentaacetic acid and 124I-labeled human serum albumin overlap measurements.
| Time (hours) | PET Volume (mL) | Overlap Volume Gd+PET (mL) | Maximum Deviationa (mm) | 90th Percentile Deviationb (mm) |
|---|---|---|---|---|
| 24 | 14.5 | 7.7 (53%) | 7 | 3.5 |
| 72 | 46.3 | 25.9 (56%) | 11 | 6.0 |
Maximum Deviation = distance of PET tracer from nearest Gd tracer;
90th Percentile Deviation means that 90% of the portion of the PET distribution that is outside the region of overlap with the Gd tracer, is nevertheless within the quoted distance from the nearest Gd-tracer.
One way to detect CSF leakage using Gd-DTPA, however, is through FLAIR imaging.10, 12, 26, 27 FLAIR imaging is highly sensitive to low concentrations of Gd-DTPA in the CSF. While the concentration cannot be measured, the images can be used to detect the presence of Gd in the CSF. Figure 4 shows a comparison of co-registered FLAIR images taken before catheter placement and after 24 hours of infusion. CSF appears dark in the baseline scan. After 24 hours, the ventricles, resection cavity, and much of the subarachnoid space have increased signal due to low concentrations of Gd-DTPA distributed throughout the CSF.
Figure 4.
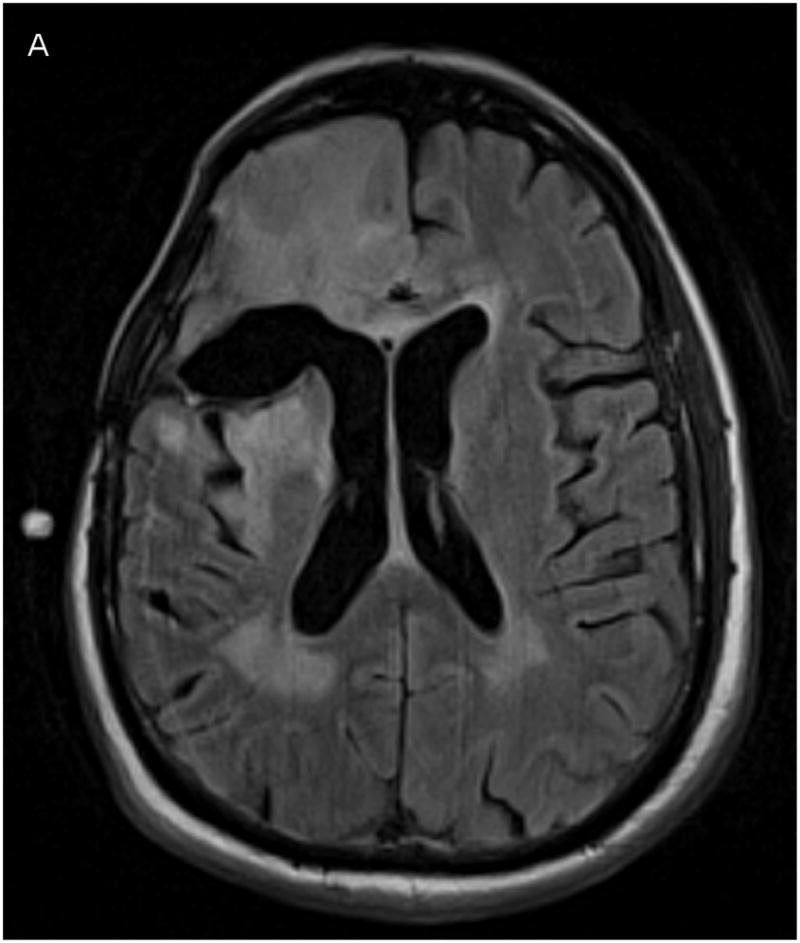
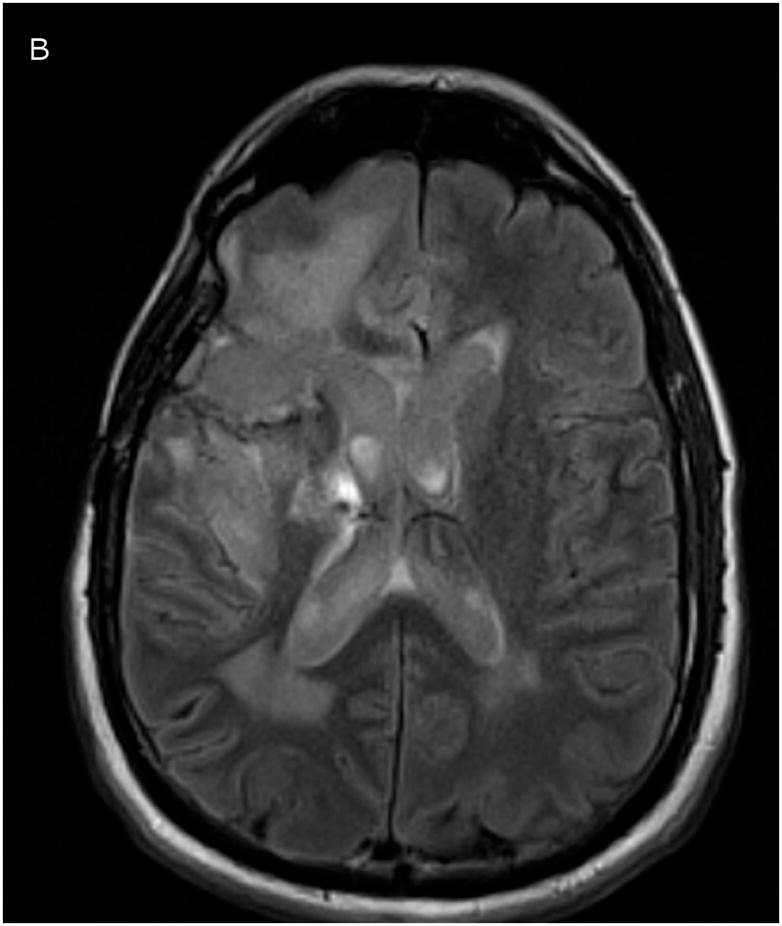
Co-registered FLAIR imaging, taken prior to catheter placement (A, baseline) and after 1 day of infusion (B, 24 hours). Signal increase due to Gd-DTPA presence appears in ventricles, resection cavity, and subarachnoid space.
Discussion
Here we evaluate the ability of a readily-available small molecule MRI contrast agent, Gd-DTPA, to predict distribution of a large molecule, in this case 124I-labeled HSA, when co-infused intracerebrally into a patient with a GBM using CED. We demonstrate, unexpectedly, that the volumetric and anatomic overlap between the two differently sized and simultaneously infused molecules is close. There should be differences in both diffusivity and loss rate between the two molecules, but these two effects may be relatively small or may tend to cancel each other out. Finally, in this novel context, we confirm the results of others that FLAIR imaging can be used to detect Gd-DTPA within the subarachnoid space suggesting extraparenchymal leakage.10, 12, 26,27 These results are important because prior applications of CED have been severely limited by an inability to document and thereby understand and correct ineffective delivery.
Although brief infusions of low volumes of Gd-DTPA have been previously used to image distribution in the brain stem,10, 12 this work represents the first attempt to track drug distribution during a prolonged, high volume infusion in the supratentorial compartment where most applications for this technique will probably reside. Direct infusions of Gd-DTPA into the brain have been previously shown by our group28, 29 and others17 to be safe in rodent models. From this case study it appears that prolonged Gd-DTPA infusion into the brain may be a safe way to estimate the distribution of drug and provide a tool for identifying reasons for inadequate drug distribution while increasing our knowledge of the factors influencing optimal application of CED. Using this information should assist in increasing the efficacy of these infusions by enhancing and documenting coverage of the target zones.
It has long been thought that the volume of distribution of small and large molecules using CED, at least under most conditions, would be quite different. Others have previously described differing convection delivery volumes of distribution in animal models when using adeno-associated virus (24 nm-diameter) capsids in comparison with smaller proteins and compounds using real time MR imaging.30 As such, the close anatomic and volumetric overlap of these two differently sized molecules in this study is somewhat surprising. At least three factors would be expected to differentially affect the distribution of Gd-DTPA and HSA: retardation, egress, and diffusion. While the diameter of HSA is ~7nm, the width of the extracellular spaces varies, but is thought to average near 50nm.31 This would seem to indicate that albumin is unlikely to be significantly retarded particularly in expandable white matter, which should allow sufficient interstitial space for enhanced fluid flow and transport of larger particle sizes (than gray matter) and so should not result in a significant retardation of the larger molecule. Egress from interstitium into the capillaries, in normal brain at least, is certainly expected to be much higher for the smaller molecule. The effect of this depends on the duration of the infusion, however. With infusions of short duration, this is unlikely to play a significant role. In our case, however, with infusions up to 72 hours, this factor should have a significant effect, which would tend to reduce the relative distribution of the smaller molecule. Conversely, the diffusivity of the smaller molecule is higher, which would tend to increase the relative distribution of the smaller molecule.
Our data provides some evidence that tissue pore fraction has expanded in regions of CED based on the imaged concentration of Gd-DTPA. However, clumping could result in increased concentrations of Gd-DTPA and could lead to the same imaging findings. Similarly, it may be thought that clearance of infusate fluid from the interstitium could also result in increased concentration of the tracers. However, using the figures for the capillary permeability-area product per unit tissue volume from Morrison et al.,32 it is easy to compute in the simple model of a spherically symmetric infusion that the increase in Gd concentration is only several parts in 100,000, and over the first couple of millimeters away from the catheter. While the model is admittedly simplified (a homogeneous brain), we do not expect any dramatic alterations in this conclusion, which would have to be incorrect to a factor of over 10,000 for it to have any effect.
Simulations, not reported here, can be performed to confirm the relative contributions of diffusivity and loss through the capillaries (i.e., neglecting retardation) if we make some assumptions. The rates of egress for either Gd-DTPA or HSA through the capillaries in the normal brain have not been measured, but the egress rate of small molecules is expected to be 5–10-fold greater. Similarly, the diffusivities of these molecules in normal human brain have also not been reliably measured but can be estimated by using the Stokes-Einstein relation, which says diffusivity is inversely proportional to the size of the molecule. Using this relation, the diffusivity of the Gd-DTPA molecule cannot be much more than 5-fold that of HSA. Based on these assumptions, the loss of tracer due to egress through the capillaries should dominate the distributions, and the Gd-DTPA will not spread as far as the larger molecule. In fact, the Gd-DTPA should not spread much beyond the 24–48 hour boundaries of the HSA. This is contrary to what we have observed here. The results we have obtained here can be explained, however, if (i) the loss through capillaries is smaller for Gd-DTPA or larger for 124I-HSA than predicted; (ii) significant losses into the CSF spaces occur for both molecules, which we did observe; or (iii) albumin is significantly retarded relative to Gd-DTPA due to causes not yet understood. Clearly, complete explanation of our results then will await direct, accurate, and regionally-specific measurements of parameters relevant to this physiology in humans with brain tumors and additional patient data.
While encouraging, this approach has some significant limitations. First, only a single patient is reported here. Our goal in reporting this single patient in a timely fashion was to make the information about the safety of Gd-DTPA infusion and its potential utility available to other investigators early on so that additional experience with this technique could be rapidly achieved. Also, while the FLAIR images nicely show leakage of Gd-DTPA into the CSF, they are poorly quantitative. FLAIR images do not directly measure tissue T1. The amount of T1 weighting in FLAIR depends on the repetition time, but conventional FLAIR images are not designed to be sensitive to T1 changes at all, but rather are designed to depict T2 abnormality (similar to a T2-weighted image) while suppressing the intensity of cerebrospinal fluid. Gd-DTPA may also not be usable as a tracer in patients with renal failure due to the risk of nephrogenic systemic fibrosis, although the total dose of Gd-DTPA used here is quite small. Finally, radiolabeled HSA or Gd-DTPA are both surrogates for drug delivery and many factors may influence drug distribution specifically. In addition, the differences in maximum linear distribution of the two tracers may not be trivial and may lead to erroneous assumptions. Finally, leakage into the subarachnoid space or ventricle could have limited tissue distribution and may have biased our results in favor of the two tracers appearing more similar than they might under ideal conditions. The leakage observed is significant. Only about 14% of the total dose infused was measured in brain parenchyma at 24 hours. Still, this technique appears to be valuable for gross estimates of drug delivery and has the advantage of being readily available. In addition, information gained from these infusions may well be useful in the context of enhancing simulation software, which will ultimately be useful for preoperative planning.9 While this report documents the first time that quantification of Gd-DTPA as a tracer has been done in humans and compared with a radiolabeled larger molecule, refinements will undoubtedly improve these techniques. The quantitative limitations of this approach are inherent in the poor resolution of SPECT or PET imaging and the assumptions used for quantitating the concentrations of Gd-DTPA. For example, taking images early in the infusion (2 hours into it) may help quantitate backflow leakage and track its effects on the infusion. Similarly, the effects of air bubbles might be evaluated using these earlier images.
Acknowledgments
Grant Information: This work was supported in part by the US National Institutes of Health P50-NS020023 (to D.D.B.), 1R25-NS065731-01 (to J.H.S.) and by Duke University’s CTSA grant 1 UL1 RR024128-01 from NCRR/NIH (to J.H.S.).
Footnotes
Financial disclosure: The authors have no financial interests in the techniques described.
Disclosure of Funding: This work was supported in part by grants from the National Institutes of Health
References
- 1.Bobo RH, Laske DW, Akbasak A, Morrison PF, Dedrick RL, Oldfield EH. Convection-enhanced delivery of macromolecules in the brain. Proc Natl Acad Sci U S A. 1994 Mar 15;91(6):2076–2080. doi: 10.1073/pnas.91.6.2076. [DOI] [PMC free article] [PubMed] [Google Scholar]
- 2.Grossi PM, Ochiai H, Archer GE, et al. Efficacy of intracerebral microinfusion of trastuzumab in an athymic rat model of intracerebral metastatic breast cancer. Clin Cancer Res. 2003 Nov 15;9(15):5514–5520. [PubMed] [Google Scholar]
- 3.Heimberger AB, Archer GE, McLendon RE, et al. Temozolomide delivered by intracerebral microinfusion is safe and efficacious against malignant gliomas in rats. Clin Cancer Res. 2000 Oct;6(10):4148–4153. [PubMed] [Google Scholar]
- 4.Kunwar S, Chang S, Westphal M, et al. Phase III randomized trial of CED of IL13-PE38QQR vs Gliadel wafers for recurrent glioblastoma. Neuro Oncol. 2010 Feb 4; doi: 10.1093/neuonc/nop054. [DOI] [PMC free article] [PubMed] [Google Scholar]
- 5.Gill SS, Patel NK, Hotton GR, et al. Direct brain infusion of glial cell line-derived neurotrophic factor in Parkinson disease. Nat Med. 2003 May;9(5):589–595. doi: 10.1038/nm850. [DOI] [PubMed] [Google Scholar]
- 6.Jarboe JS, Johnson KR, Choi Y, Lonser RR, Park JK. Expression of interleukin-13 receptor alpha2 in glioblastoma multiforme: implications for targeted therapies. Cancer Res. 2007 Sep 1;67(17):7983–7986. doi: 10.1158/0008-5472.CAN-07-1493. [DOI] [PubMed] [Google Scholar]
- 7.Sampson JH, Brady ML, Petry NA, et al. Intracerebral infusate distribution by convection-enhanced delivery in humans with malignant gliomas: descriptive effects of target anatomy and catheter positioning. Neurosurgery. 2007 Feb;60(2 Suppl 1):ONS89–98. doi: 10.1227/01.NEU.0000249256.09289.5F. discussion ONS98-89. [DOI] [PubMed] [Google Scholar]
- 8.Sampson JH, Archer G, Pedain C, et al. Poor drug distribution as a possible explanation for the results of the PRECISE trial. J Neurosurg. 2009 Dec 18;113(2):301–309. doi: 10.3171/2009.11.JNS091052. [DOI] [PubMed] [Google Scholar]
- 9.Sampson JH, Raghavan R, Brady ML, et al. Clinical utility of a patient-specific algorithm for simulating intracerebral drug infusions. Neuro Oncol. 2007 Jul;9(3):343–353. doi: 10.1215/15228517-2007-007. [DOI] [PMC free article] [PubMed] [Google Scholar]
- 10.Lonser RR, Walbridge S, Murray GJ, et al. Convection perfusion of glucocerebrosidase for neuronopathic Gaucher’s disease. Ann Neurol. 2005 Apr;57(4):542–548. doi: 10.1002/ana.20444. [DOI] [PubMed] [Google Scholar]
- 11.Murad GJ, Walbridge S, Morrison PF, et al. Real-time, image-guided, convection-enhanced delivery of interleukin 13 bound to pseudomonas exotoxin. Clin Cancer Res. 2006 May 15;12(10):3145–3151. doi: 10.1158/1078-0432.CCR-05-2583. [DOI] [PubMed] [Google Scholar]
- 12.Lonser RR, Schiffman R, Robison RA, et al. Image-guided, direct convective delivery of glucocerebrosidase for neuronopathic Gaucher disease. Neurology. 2007 Jan 23;68(4):254–261. doi: 10.1212/01.wnl.0000247744.10990.e6. [DOI] [PubMed] [Google Scholar]
- 13.Song DK, Lonser RR. Convection-enhanced delivery for the treatment of pediatric neurologic disorders. J Child Neurol. 2008 Oct;23(10):1231–1237. doi: 10.1177/0883073808321064. [DOI] [PMC free article] [PubMed] [Google Scholar]
- 14.Saito R, Bringas JR, McKnight TR, et al. Distribution of liposomes into brain and rat brain tumor models by convection-enhanced delivery monitored with magnetic resonance imaging. Cancer Res. 2004 Apr 1;64(7):2572–2579. doi: 10.1158/0008-5472.can-03-3631. [DOI] [PubMed] [Google Scholar]
- 15.Sampson JH, Raghavan R, Provenzale JM, et al. Induction of hyperintense signal on T2-weighted MR images correlates with infusion distribution from intracerebral convection-enhanced delivery of a tumor-targeted cytotoxin. AJR Am J Roentgenol. 2007 Mar;188(3):703–709. doi: 10.2214/AJR.06.0428. [DOI] [PubMed] [Google Scholar]
- 16.Mardor Y, Roth Y, Lidar Z, et al. Monitoring response to convection-enhanced taxol delivery in brain tumor patients using diffusion-weighted magnetic resonance imaging. Cancer Res. 2001 Jul 1;61(13):4971–4973. [PubMed] [Google Scholar]
- 17.Mardor Y, Rahav O, Zauberman Y, et al. Convection-enhanced drug delivery: increased efficacy and magnetic resonance image monitoring. Cancer Res. 2005 Aug 1;65(15):6858–6863. doi: 10.1158/0008-5472.CAN-05-0161. [DOI] [PubMed] [Google Scholar]
- 18.Sampson JH, Reardon DA, Friedman AH, et al. Sustained radiographic and clinical response in patient with bifrontal recurrent glioblastoma multiforme with intracerebral infusion of the recombinant targeted toxin TP-38: case study. Neuro Oncol. 2005 Jan;7(1):90–96. doi: 10.1215/S1152851703000589. [DOI] [PMC free article] [PubMed] [Google Scholar]
- 19.Sampson JH, Akabani G, Friedman AH, et al. Comparison of intratumoral bolus injection and convection-enhanced delivery of radiolabeled antitenascin monoclonal antibodies. Neurosurg Focus. 2006;20(4):E14. doi: 10.3171/foc.2006.20.4.9. [DOI] [PubMed] [Google Scholar]
- 20.Sampson JH, Akabani G, Archer GE, et al. Intracerebral infusion of an EGFR-targeted toxin in recurrent malignant brain tumors. Neuro Oncol. 2008 Jun;10(3):320–329. doi: 10.1215/15228517-2008-012. [DOI] [PMC free article] [PubMed] [Google Scholar]
- 21.Beers R, Chowdhury P, Bigner D, Pastan I. Immunotoxins with increased activity against epidermal growth factor receptor vIII-expressing cells produced by antibody phage display. Clin Cancer Res. 2000 Jul;6(7):2835–2843. [PubMed] [Google Scholar]
- 22.Deoni SC, Rutt BK, Peters TM. Rapid combined T1 and T2 mapping using gradient recalled acquisition in the steady state. Magn Reson Med. 2003 Mar;49(3):515–526. doi: 10.1002/mrm.10407. [DOI] [PubMed] [Google Scholar]
- 23.Pickup S, Wood AK, Kundel HL. Gadodiamide T1 relaxivity in brain tissue in vivo is lower than in saline. Magn Reson Med. 2005 Jan;53(1):35–40. doi: 10.1002/mrm.20336. [DOI] [PubMed] [Google Scholar]
- 24.Rohrer M, Bauer H, Mintorovitch J, Requardt M, Weinmann HJ. Comparison of magnetic properties of MRI contrast media solutions at different magnetic field strengths. Invest Radiol. 2005 Nov;40(11):715–724. doi: 10.1097/01.rli.0000184756.66360.d3. [DOI] [PubMed] [Google Scholar]
- 25.Wells WM, 3rd, Viola P, Atsumi H, Nakajima S, Kikinis R. Multi-modal volume registration by maximization of mutual information. Med Image Anal. 1996 Mar;1(1):35–51. doi: 10.1016/s1361-8415(01)80004-9. [DOI] [PubMed] [Google Scholar]
- 26.Morris JM, Miller GM. Increased signal in the subarachnoid space on fluid-attenuated inversion recovery imaging associated with the clearance dynamics of gadolinium chelate: a potential diagnostic pitfall. AJNR Am J Neuroradiol. 2007 Nov-Dec;28(10):1964–1967. doi: 10.3174/ajnr.A0694. [DOI] [PMC free article] [PubMed] [Google Scholar]
- 27.Bozzao A, Floris R, Fasoli F, Fantozzi LM, Colonnese C, Simonetti G. Cerebrospinal fluid changes after intravenous injection of gadolinium chelate: assessment by FLAIR MR imaging. Eur Radiol. 2003 Mar;13(3):592–597. doi: 10.1007/s00330-002-1546-4. [DOI] [PubMed] [Google Scholar]
- 28.Ding D, Kanaly CW, Bigner DD, et al. Convection-enhanced delivery of free gadolinium with the recombinant immunotoxin MR1-1. J Neurooncol. 2010 May;98(1):1–7. doi: 10.1007/s11060-009-0046-7. [DOI] [PMC free article] [PubMed] [Google Scholar]
- 29.Ding D, Kanaly CW, Cummings TJ, Ii JE, Raghavan R, Sampson JH. Long-term safety of combined intracerebral delivery of free gadolinium and targeted chemotherapeutic agent PRX321. Neurol Res. 2009 Dec 21; doi: 10.1179/174367509X12581069052090. [DOI] [PMC free article] [PubMed] [Google Scholar]
- 30.Szerlip NJ, Walbridge S, Yang L, et al. Real-time imaging of convection-enhanced delivery of viruses and virus-sized particles. J Neurosurg. 2007 Sep;107(3):560–567. doi: 10.3171/JNS-07/09/0560. [DOI] [PubMed] [Google Scholar]
- 31.Thorne RG, Nicholson C. In vivo diffusion analysis with quantum dots and dextrans predicts the width of brain extracellular space. Proc Natl Acad Sci U S A. 2006 Apr 4;103(14):5567–5572. doi: 10.1073/pnas.0509425103. [DOI] [PMC free article] [PubMed] [Google Scholar]
- 32.Morrison PF, Laske DW, Bobo H, Oldfield EH, Dedrick RL. High-flow microinfusion: tissue penetration and pharmacodynamics. Am J Physiol. 1994 Jan;266(1 Pt 2):R292–305. doi: 10.1152/ajpregu.1994.266.1.R292. [DOI] [PubMed] [Google Scholar]