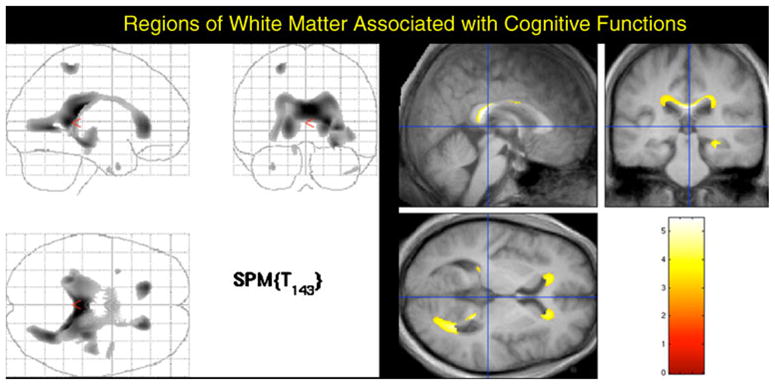
Fig. 3.

WM atrophy associated with lower scores on the neuropsychological tests. These regions were in the same WM regions as those observed for the aging effect, but with less spatial extent. The left-hand image shows a “glass brain” view in which all voxels are visible in each of the three perspectives. The images on the right show the areas of significant association between white matter volume and test performance
