Abstract
This study examined the selectivity of organic anion transporters OAT1 and OAT3 for structural congeners of the heavy metal chelator 2,3-dimercapto-1-propanesulfonic acid (DMPS). Thiol-reactive reagents were also used to test structural predictions based on a homology model of OAT1 structure. DMPS was near equipotent in its ability to inhibit OAT1 (IC50 = 83 μM) and OAT3 (IC50 = 40 μM) expressed in Chinese hamster ovary cells. However, removal of a thiol group (3-mercapto-1-propanesulfonic acid) resulted in a 2.5-fold increase in IC50 toward OAT1 vs. a ∼55-fold increase in IC50 toward OAT3. The data suggested that compound volume/size is important for binding to OAT1/OAT3. The sensitivity to HgCl2 of OAT1 and OAT3 was also dramatically different, with IC50 values of 104 and 659 μM, respectively. Consistent with cysteines of OAT1 being more accessible from the external medium than those of OAT3, thiol-reactive reagents reacted preferentially with OAT1 in cell surface biotinylation assays. OAT1 was less sensitive to HgCl2 inhibition and less reactive toward membrane-impermeant thiol reactive reagents following mutation of cysteine 440 (C440) to an alanine. These data indicate that C440 in transmembrane helix 10 of OAT1 is accessible from the extracellular space. Indeed, C440 was exposed to the aqueous phase of the presumptive substrate translocation pathway in a homology model of OAT1 structure. The limited thiol reactivity in OAT3 suggests that the homologous cysteine residue (C428) is less accessible. Consistent with their homolog-specific selectivities, these data highlight structural differences in the substrate binding regions of OAT1 and OAT3.
Keywords: heavy metal chelator, cysteine accessibility, homology modeling, proximal tubule
renal excretion, accomplished in part by active proximal tubular secretion, represents a major pathway for elimination from the body of exogenous and endogenous organic compounds that carry a net negative charge at physiological pH (organic anions; OAs) (13). Importantly, numerous clinically important therapeutic drugs, including antiviral agents, antibiotics, chemotherapeutics, nonsteroidal anti-inflammatory drugs, and heavy metal chelators are OAs (14). The rate at which these drugs undergo tubular secretion can dictate both their efficacy and potential for toxicity. The organic anion transporters 1 (OAT1) and 3 (OAT3) represent the initial and rate-limiting step (uptake across the basolateral membrane) in the renal tubular secretion of the majority of these clinically important OAs (21).
The OATs are members of the OCT family of transport proteins (SLC22A), which in addition to OATs includes the organic cation transporters (OCTs). In general, SLC22A family members display broad structural selectivity, making them potential sites of harmful drug-drug interactions (14). Additionally, genetic polymorphisms in SLC22A family members have been linked to altered drug pharmacokinetics and pharmacodynamics in humans (17, 22). Thus an understanding of the structural basis of the binding of anionic and cationic drugs with SLC22A transporters moves closer to anticipating the interaction of substrates with these proteins and may help predict drug-drug interactions and the potential impact of genetic diversity on their renal elimination. Toward this end, the generation of homology models of several SLC22A family members, including rat OCT1 (12), rabbit OCT2 (24), and human OAT1 (11) should prove useful in predicting the functional consequences of their unique structural attributes.
The present study addresses several important questions regarding structure-activity relationships in OAT1 vs. OAT3. First, does the selectivity of OAT1 and OAT3 for structural congeners of the clinically important heavy metal chelator 2,3-dimercapto-1-propanesulfonic acid (DMPS) differ? Acknowledging that rodents and rabbits are preclinical species used to study the pharmacodynamic/pharmacokinetic properties of new chemical entities, are there species differences in the selectivity of OAT1 and OAT3 for DMPS and its congeners? Finally, thiol-reactive probes were used to examine structural differences in the putative substrate binding regions of OAT1 and OAT3, while providing an initial assessment of the validity of a homology model of hOAT1 structure.
MATERIALS AND METHODS
Reagents.
Platinum High-Fidelity DNA polymerase, zeocin, hygromycin, Flp recombinase expression plasmid (pOG44), Chinese hamster ovary (CHO) cells containing a single integrated Flp recombination target (FRT) site (CHO Flp-In), and the mammalian expression vector pcDNA5/FRT/V5-His TOPO were obtained from Invitrogen (Carlsbad, CA). Ham's F12-Kaign's modification medium, PAH, estrone-3-sulfate (ES), glutarate (GA), DMPS, 3-mercapto-1-propansulfonic acid (MPS), 1-propanesulfonic acid (PSA), 1-butanesulfonic acid (BSA), and HgCl2 were obtained from Sigma (St. Louis, MO). [3H]ES (57.3 Ci/mmol), [3H]PAH (4.1 Ci/mmol), and [14C]GA (55 mCi/mM) were obtained from PerkinElmer Life Sciences (Waltham, MA). [(+)-Biotinyl-3-maleimidopropionamidyl-3, 6-dioxaoctanediamine (maleimide-PEO2-biotin; MB)] and sulfosuccinimidyl 2-(biotinamido)-ethyl-1,3-dithiopropionate (sulfo-NHS-SS-biotin; NHS-B) were obtained from Pierce Biotechnology (Rockford, IL). N-biotinylaminoethyl methanethiosulfonate (MTSEA-biotin; MTSEA-B), [2-(trimethylammonium)ethyl] methanethiosulfonate bromide (MTSET), sodium (2-sulfonatoethyl)methanethiosulfonate (MTSES), and MTSEA were from Toronto Research Chemicals (New York, Ontario). The MTS reagents have in common a methanethiosulfonate group, which can covalently modify free thiols in cysteines. However, MTSEA is weakly basic at physiological pH (pKa of the primary amine, ∼8.2), MTSET is positively charged (quaternary amine), and MTSES is negatively charged (sulfonate group).
Cloning and site-directed mutagenesis.
The open reading frames of human (h), mouse (m), and rabbit (r) orthologs of OAT1 and OAT3 (contained in pcDNA3.1) were amplified using Platinum High Fidelity DNA polymerase and sequence-specific primers. To facilitate Western blotting for biotinylation studies, the sequence-specific primers for OAT1 and OAT3 were designed to remove the native stop codon and include the V5 epitope tag at the C-terminal end of the transport protein. PCR conditions consisted of 35 cycles of 94°C for 1 min, 54°C for 1 min, and 72°C for 3.5 min. A final elongation step of 7 min was included after the last cycle. The PCR products were gel purified and cloned into the pcDNA5/FRT/V5-His TOPO mammalian expression vector. Mutation of cysteine residues in hOAT1 was done by site-directed mutagenesis using the QuickChange system (Stratagene, La Jolla, CA). Plasmid DNA was prepared using standard methods (Genesee Scientific, San Diego, CA), and sequences were confirmed with an Applied Biosystems 3730xl DNA analyzer at the University of Arizona sequencing facility.
Cell culture and stable expression of OAT1 and OAT3.
CHO cells containing the Flp recombination target site were grown in Ham's F12-Kaighn's modification medium supplemented with 10% fetal calf serum and 100 μg/ml zeocin. Cultures were split every 3 days. Cells (5 × 10⁶) were transfected by electroporation (BTX ECM 630, San Diego; 260 V and time constant of ∼25 ms) with 10 μg of salmon sperm, 18 μg of pOG44, and 2 μg of pcDNA5/FRT/V5-His TOPO containing either an OAT1 or OAT3 construct. Cells were seeded in a T-75 flask following transfection and maintained under selection pressure with hygromycin (100 μg/ml). Individual clones containing the desired construct were identified from their ability to accumulate the fluorescent organic anion 6-carboxyfluorescein, and were subsequently isolated by dilution cloning. Clones that continued to accumulate 6-carboxyfluorescein were tested for transport of [3H]PAH (OAT1) or [3H]ES (OAT3), and the stable clones expressing the highest rates of transport were used in subsequent experiments.
Transport experiments.
All transport experiments were conducted using buffers equilibrated to room temperature. CHO cells expressing human, mouse, or rabbit orthologs of OAT1 or OAT3 were grown to confluence in 12-well plates. Before transport experiments, the media was aspirated and the cells were rinsed twice with Waymouth buffer (WB) containing (in mM) 135 NaCl, 28 d-glucose, 5 KCl, 1.2 MgCl2, 2.5 CaCl2, 0.8 MgSO4, and 13 HEPES-NaOH, pH 7.4. Transport was initiated by adding transport solution containing WB with either 1 μCi/ml [3H]PAH (250 nM), 1 μCi/ml [3H]ES (15 nM), or 0.15 μCi/ml [14C]GA (3 μM), in the absence or presence of increasing concentrations of unlabeled PAH, ES, or GA. Since initial experiments showed that uptake of [3H]PAH and [3H]ES was linear for ∼1 min, 30-s uptakes were used to approximate the initial rate. One-minute uptakes of [14C]GA were used in the GA transport measurements. After the transport period, the transport solution was aspirated and the wells were rinsed three times with 1 ml of ice-cold WB. The cells were solubilized in 0.4 ml of 0.5 N NaOH with 1% SDS (vol/vol), and the resulting lysate was neutralized with 0.2 ml of 1 N HCl. Accumulated radioactivity was determined by liquid scintillation spectrometry (Beckman model LS3801). Individual transport observations were performed in triplicate for each experiment, and observations were usually confirmed, at least three times, in separate experiments using cells of a different passage. Kinetic parameters, Michaelis constant (Kt) and maximal rate of transport (Jmax), were determined as described previously (8).
Inhibition of OAT1- and OAT3-mediated transport by DMPS and congeners.
CHO cells expressing human, mouse, or rabbit orthologs of OAT1 or OAT3 were prepared for transport experiments as described above. [3H]PAH and [3H]ES, at concentrations approximating those noted above (and well below their Kt values), were included in the transport buffers and served as substrates of OAT1 and OAT3, respectively. Transport experiments were conducted at initial rates (see above) with [3H]PAH or [3H]ES and increasing concentrations of DMPS or the congeners of DMPS, including MPS, PSA, or BSA. After the transport period, the samples were handled identically as outlined above. The concentration of DMPS or congener to produce IC50 values of transport activity was determined as described previously (7, 9).
Inhibition of hOAT1- and hOAT3-mediated transport by HgCl2 and MTS reagents.
CHO cells expressing hOAT1 or hOAT3 were prepared for transport experiments as described above. [3H]PAH and [3H]ES, at concentrations approximating those noted above, were included in the transport buffers and served as substrates of hOAT1 and hOAT3, respectively. In the HgCl2 experiments, transport was conducted in the presence of increasing concentrations of HgCl2 in the transport buffer. In the MTS reagent experiments, cells were exposed to the MTS reagents (final concentration of 1 mM) for 2 min and then rinsed twice with WB before transport measurement. Transport experiments were conducted at initial rates (see above) with [3H]PAH or [3H]ES. After the transport period, the samples were handled identically as outlined above. The IC50 values for HgCl2 inhibition of hOAT1- and hOAT3-mediated transport were determined as described previously (7).
Cell surface biotinylation and Western blotting.
The membrane-impermeant biotinylating reagent NHS-B was used to assess total plasma membrane expression of hOAT1 and hOAT3, whereas membrane-impermeant MB and MTSEA-B were used to analyze cysteine accessibility. The method described here is a minor modification of that described by Pelis et al. (8). All solutions were kept ice-cold throughout the procedure, and long incubations on ice were conducted with gentle shaking. Cells plated to confluence in a 12-well plate were initially washed three times with 2 ml of PBS solution containing calcium and magnesium [PBS/CM; containing (in mM) 137 NaCl, 2.7 KCl, 8 Na2HPO4, 1.5 KH2PO4, 0.1 CaCl2, and 1 MgCl2, pH 7.0 with 1 N HCl for MTSEA-B and MB or pH 8.0 with 1 N NaOH for NHS-SS-B] followed by one 20-min incubation in MB, MTSEA-B, or NHS-B diluted in PBS/CM. The concentrations and times of exposure to MB, MTSEA-B, and NHS-B are described in the figure legends. Following biotinylation, cells treated with MB or MTSEA-B were washed twice with 3 ml of PBS-CM (pH 7), while cells treated with NHS-B were washed twice with 3 ml PBS-CM (pH 8) containing 100 mM glycine. The washes were followed by one 20-min incubation in the appropriate PBS-CM solution. The cells were lysed in 1 ml of lysis buffer (150 mM NaCl, 10 mM Tris·HCl, 1% Triton X-100, 1% sodium deoxycholate, and 0.1% SDS, pH 7.4) containing protease inhibitors [in μM: 200 4-(2-aminoethyl)-bezenesulfonyl-fluoride, 0.16 aprotinin, 4 leupeptin, 8 bestatin, 3 pepstatin A, and 2.8 E-64; Sigma] for 1 h. Fifty microliters of streptavidin-agarose beads (Pierce) were added to the lysates and incubated overnight at 4°C with constant mixing. After extensive washing with the above lysis buffer, 50 μl of Laemmli sample buffer was added, and the proteins were eluted from the beads at 100°C for 5 min. Proteins were separated on 8% SDS-PAGE gels, transferred to polyvinylidene difluoride membranes, and immunoreactivity corresponding to the V5 epitope tag of hOAT1 or hOAT3 was detected as previously described (7, 9). Semiquantitative densitometry analysis of immunoreactivity corresponding to the V5 epitope tag was determined from scanned images using Image calc (C. H. A. van de Lest, Dutch Asthma Foundation) as described (10). Biotinylation experiments with the mutant constructs of hOAT1 (or hOAT3) were always run in parallel on the same day as wild-type hOAT1. Additionally, protein precipitated from CHO cells expressing the mutant constructs of hOAT1 (or hOAT3) were run on SDS-PAGE gels that always contained biotinylated protein precipitated from wild-type hOAT1-expressing CHO cells.
Statistics.
All data are expressed as means ± SE, with calculations of SE based on the number of separate experiments conducted on cells of a different passage number. Comparison of sample means was done using Student's t-test. All statistical analyses were performed with ProStat 3.81c (Poly Software International, Pearl River, NY) and deemed significant when P < 0.05.
RESULTS AND DISCUSSION
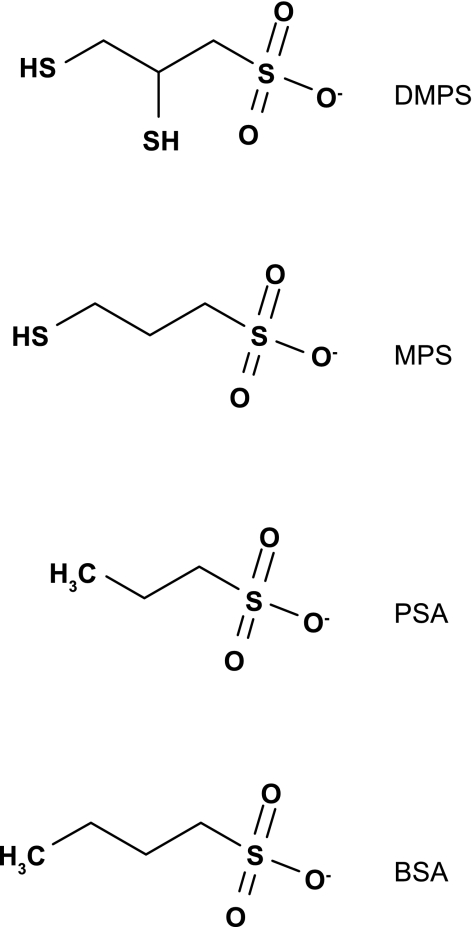
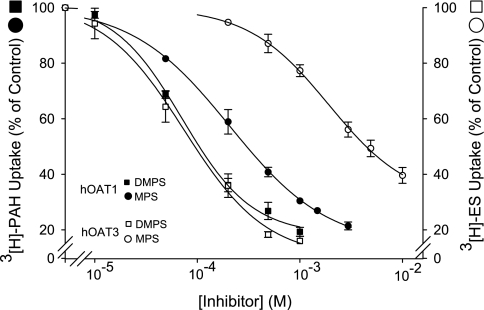
Initial experiments probing the substrate binding surface of OAT1 and OAT3 took advantage of the fact that DMPS inhibits both transport proteins with similar IC50 values (6, 16). The inhibitory effect of DMPS congeners (structures shown in Fig. 1) was tested against OAT1 and OAT3 to determine whether the transport proteins were differentially sensitive to minor modifications in the molecular structure of DMPS and whether the differential sensitivity, if present, was conserved across species. For simplicity, the initial discussion of the effect of DMPS and congeners is restricted to the human orthologs of the transport proteins. As expected, DMPS was near equipotent in its ability to inhibit hOAT1 and hOAT3, with IC50 values of 83 and 40 μM, respectively (Table 1 and Fig. 2). However, loss of a single sulfhydryl group from DMPS (DMPS→MPS) resulted in a 2.5-fold increase in IC50 toward hOAT1 (83–204 μM), vs. a ∼55-fold increase in IC50 toward hOAT3 (40–2,139 μM). Elimination of both thiol groups (DMPS→PSA) effectively eliminated the inhibitory interaction toward both transporters, and a small increase in hydrophobic bulk of PSA (through the addition of a single methyl group; PSA→BSA) improved the inhibitory interaction toward hOAT1 (IC50 value of 514 μM), but had no apparent change in the effect against hOAT3. Table 2 highlights the structural similarities among DMPS, MPS, PSA, and BSA; all have the same number of hydrogen bond acceptors and donors, are hydrophilic as indicated by their CLogP values, are anions at physiological pH (pKa on the sulfonate group of 0.5), and have a predicted polar surface area of 54 Å2. The obvious difference among the compounds tested was their volume, and a reduction in volume correlated with an increase in IC50 value. For hOAT1 the trend was, DMPS 154 Å3 (83 μM) > MPS 132 Å3 (204 μM) > BSA 128 Å3 (514 μM) > PSA 109 Å3 (2,036 μM) (Table 1 and Table 2). Compounds with a volume less than DMPS did not interact appreciably with hOAT3 (Tables 1 and 2). These data suggest that, for the compounds tested, volume/size is an important determinant for binding to OAT1/OAT3. Interestingly, it was an increase in the nonpolar surface area that was associated with increased inhibitory interactions toward OAT3, which suggests that stabilization of ligand interaction with the OAT3 binding surface(s) is facilitated by van der Waals interactions to a greater degree than OAT1. These data also suggest that structural differences in the substrate binding regions of hOAT1 and hOAT3 permit fine discrimination between structurally similar compounds.
Fig. 1.
Structures of 2,3-dimercapto-1-propane sulfonic acid (DMPS) and several structurally related compounds, including 3-mercapto-1-propanesulfonic acid (MPS), 1-propanesulfonic acid (PSA), and 1-butanesulfonic acid (BSA).
Table 1.
IC50 values for inhibition of human, mouse, and rabbit orthologs of OAT1 (PAH uptake) and OAT3 (ES uptake) by DMPS and structurally related compounds
| hOAT1 | mOAT1 | rbOAT1 | hOAT3 | mOAT3 | rbOAT3 | |
|---|---|---|---|---|---|---|
| DMPS | 83 ± 3.0 (3) | 55 ± 4.9 (4) | 72 ± 9.9 (6) | 40 ± 7.4 (3) | 85 ± 16.9 (4) | 18 ± 2.5 (5) |
| MPS | 204 ± 54.2 (3) | 151 ± 19.8 (4) | 204 ± 34.9 (4) | 2,139 ± 288.8 (4) | 2,325 ± 268.4 (4) | 2,320 ± 785 (4) |
| PSA | 2036 ± 28.3 (3) | 4156 ± 1078.8 (3) | ND | No Inhibition (1) | No Inhibition (1) | ND |
| BSA | 514 ± 72.1 (6) | 313 ± 26.9 (4) | 421 ± 89.4 (3) | 5,098 ± 184.3 (3) | 1,0975 ± 2,647 (4) | 5,640 ± 715.9 (3) |
Values are means ± SE expressed in μM. The number of separate experiments is indicated in parentheses. ES, estrone-3-sulfate; ND, not determined; DMPS, 2,3-dimercapto-1-propanesulfonic acid; MPS, 3-mercapto-1-propanesulfonic acid; PSA, 1-propanesulfonic acid; BSA, 1-butanesulfonic acid.
Fig. 2.
Effect of DMPS and MPS on PAH transport by human organic anion transporter 1 (hOAT1) and estrone-3-sulfate (ES) transport by hOAT3. The data are expressed as a percentage of [3H]PAH or [3H]ES uptake in the absence of inhibitor and are means ± SE of 3–4 separate experiments. The IC50 values are reported in Table 1.
Table 2.
Predicted physicochemical properties of DMPS and congeners
| Compound | H+ Bond Acceptors | H+ Bond Donors | MW, g/mol | CLogP | pKa | Total Surface Area, Å2 | Nonpolar Surface Area, Å2 | Polar Surface Area, Å2 | Volume, Å3 |
|---|---|---|---|---|---|---|---|---|---|
| DMPS | 3 | 1 | 188 | −1.4 | 0.5 | 184 | 130 | 54 | 154 |
| MPS | 3 | 1 | 156 | −1.2 | 0.5 | 170 | 116 | 54 | 132 |
| PSA | 3 | 1 | 124 | −1.4 | 0.5 | 145 | 91 | 54 | 109 |
| BSA | 3 | 1 | 138 | −0.84 | 0.5 | 167 | 113 | 54 | 128 |
Physicochemical properties were predicted using InSilico Profile version 4.1 (Novartis Institutes for Biomedical Research, Cambridge, MA).
The effect of DMPS and congeners against OAT1 and OAT3 were well conserved across the species tested (Table 1). For example, the IC50 value for MPS as an inhibitor of the different orthologs varied <25% for OAT1 (151–204 μM) and 10% for OAT3 (2.1–2.3 mM). The substrate interaction of PAH with OAT1 and ES with OAT3 was also relatively conserved across species, with Kt values ranging from 5.8 to 29.7 μM for OAT1 and 3.1 to 9.9 μM for OAT3 (Table 3). These data suggest that the substrate/inhibitor binding regions of OAT1 and OAT3 are generally conserved across human, mouse, and rabbit orthologs, which is important information for drug development programs using mouse and rabbits as preclinical species to predict the influence of OAT1 and OAT3 to renal drug clearance in humans.
Table 3.
Maximum transport rate (Jmax) and Michaelis constant (Kt) of the human, mouse and rabbit orthologs of OAT1 and OAT3 for PAH and ES, respectively
| PAH |
ES |
||||
|---|---|---|---|---|---|
| Jmax, pmol × cm−2 × min−1 | Kt, μM | Jmax, pmol × cm−2 × min−1 | Kt, μM | ||
| hOAT1 | 19.7 ± 4.08 | 11.1 ± 1.65 | hOAT3 | 5.1 ± 12.72 | 4.2 ± 0.73 |
| mOAT1 | 8.1 ± 0.72 | 5.8 ± 0.81 | mOAT3 | 55.0 ± 9.19 | 9.9 ± 1.52 |
| rbOAT1 | 10.0 ± 2.97 | 29.7 ± 5.23 | rbOAT3 | 76.1 ± 34.0 | 3.1 ± 1.65 |
Values are means ± SE of 3–4 separate experiments.
The profound differences in apparent binding interactions resulting from modest changes in chemical structure (e.g., DMPS→MPS) prompted an interest in determining the molecular basis of substrate/inhibitor interaction with the putative binding regions of hOAT1 and hOAT3. As noted earlier, OAT1 and OAT3 are members of the SLC22A family of solute carriers, which also contains the organic cation transporters OCT1 and OCT2. Structural features shared by SLC22A family members, including conservation of a 13-residue sequence found between transmembrane domains 2 and 3, place them into the major facilitator superfamily (MFS). The solution of crystal structures for two MFS transporters, the Escherichia coli lactose permease (LacY) (1) and glycerol-3-phosphate transporter (GlpT) (4), and growing evidence that MFS transporters have a common structural fold (19), supported the use of homology modeling to develop hypothetical three-dimensional (3D) structures of several MFS transport proteins, including rat OCT1 (2), rbOCT2 (24), and hOAT1 (11). Centrally located within these structures is a large hydrophilic cleft that has been suggested to contain the site(s) of substrate-protein interaction (2, 11, 24). The models have proven useful in identifying amino acid residues that contribute to the “homolog-specific selectivity” that distinguishes transport activity of OCT1 and OCT2 (20), but, importantly, those studies were grounded on independent tests of the validity of these models (7, 9, 18). Thus, while it is attractive to consider assessing the structural basis of the selectivity differences that distinguish OAT1 and OAT3 (e.g., Table 1), we considered it important to begin with an effort to test structural predictions based on the current hOAT1 homology model.
Here, we tested predictions regarding the accessibility of native cysteine residues in hOAT1 relative to their location in the hydrophilic cleft evident in the hOAT1 model, the same approach used to test the model of OCT2 (7, 9). Of the 13 cysteine residues present in the hOCT2 sequence, only C451 and C474 are readily accessible from the extracellular media, in agreement with the placement of these two residues in the current model of hOCT2 structure (7, 9). The present study used several different membrane-impermeant thiol-reactive reagents and site-directed mutagenesis to test similar predictions based on the current hOAT1 model.
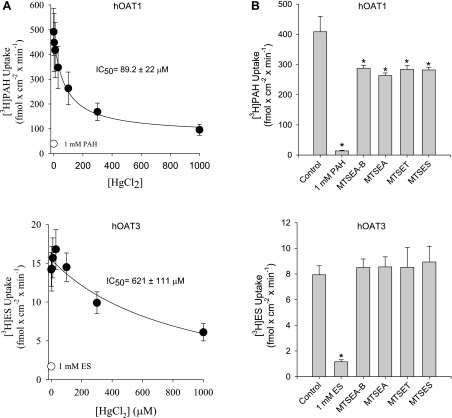
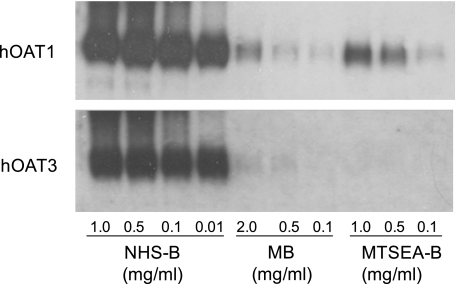
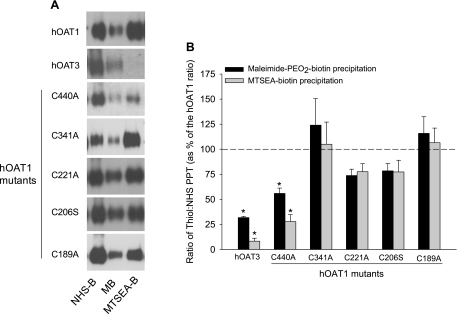
First determined was the effect on hOAT1- and hOAT3-mediated transport of thiol-reactive reagents that covalently modify accessible cysteine residues (Fig. 3). In all cases, transport by hOAT1 was more sensitive to the thiol-reactive reagents than hOAT3. The IC50 value for HgCl2 inhibition of hOAT1 was ∼7-fold (P < 0.05, Student's t-test) lower than that for hOAT3 (89.2 ± 22 vs. 621 ± 111 μM; Fig. 3A), and whereas each of the MTS reagents inhibited hOAT1 transport activity (∼30%), they had no effect on hOAT3 (Fig. 3B). Consistent with the suggestion that native cysteine residues in hOAT1 are more accessible from the extracellular medium than those in hOAT3, MB and MTSEA-B reacted preferentially with hOAT1 in cell surface biotinylation studies (Fig. 4). Work by You et al. (5, 23) showed that NHS-B, which covalently modifies lysine residues, can be used to approximate total hOAT1 and hOAT3 protein expressed at the plasma membrane. Indeed, lysine residues in hOAT1 and hOAT3 were substantially more accessible to NHS-B than cysteine residues were to the thiol-reactive reagents (Fig. 4). Thus NHS-B was used to approximate total hOAT1 and hOAT3 protein expressed at the plasma membrane (see Fig. 7B).
Fig. 3.
Effect of HgCl2 (A) or MTS reagents (B) on transport activity of hOAT1 and hOAT3. Whereas a range of HgCl2 concentrations were tested (0–1,000 μM), the MTS reagents {N-biotinylaminoethyl methanethiosulfonate-biotin (MTSEA-B), MTSEA, [2-(trimethylammonium)ethyl] methanethiosulfonate bromide (MTSET), and sodium (2-sulfonatoethyl)methanethiosulfonate (MTSES)} were used at a final concentration of 1 mM. Uptake experiments were also conducted in the presence or absence of a saturating concentration (1 mM) of either unlabeled PAH or ES (no HgCl2 or MTS reagents present). Values are means ± SE of 3–6 separate experiments. *Significantly different from control (no inhibitor present), P < 0.05, Student's t-test.
Fig. 4.
Western blot showing the effect of increasing concentrations of NHS-SS-biotin (NHS-B), maleimide-PEO2-biotin (MB), and MTSEA-B on precipitation of hOAT1 and hOAT3. The concentrations of NHS-B (0.01–1.0 mg/ml), MB (0.1–2.0 mg/ml), and MTSEA-B (0.1–1.0 mg/ml) used in the surface biotinylation reactions are shown.
Fig. 7.
A: representative Western blots showing the interaction of NHS-B, MB, and MTSEA-B with wild-type hOAT1 and the various mutant constructs. The precipitation of hOAT3 by these reagents is shown for comparison. B: densitometry analysis from several different Western blots (n = 2–4) examining relative cysteine accessibility in wild-type hOAT1, the mutant constructs of hOAT1, and hOAT3. Immunoreactivity corresponding to precipitation of the respective transport protein (PPT) with NHS-B was considered an appropriate measure of total hOAT1 (wild-type and mutant constructs) or hOAT3 expressed at the plasma membrane (5, 23) and thus was used to control for differences in surface expression. Immunoreactivity corresponding to precipitation with either MB or MTSEA-B was divided by immunoreactivity corresponding to precipitation with NHS-B to estimate relative cysteine accessibility (ratio of thiol:NHS PPT). The data are presented as a percentage of control (wild-type hOAT1) ratios (MB:NHS-B PPT and MTSEA-B:NHS-B PPT). *Significantly different from wild-type hOAT1, P < 0.05, Student's t-test.
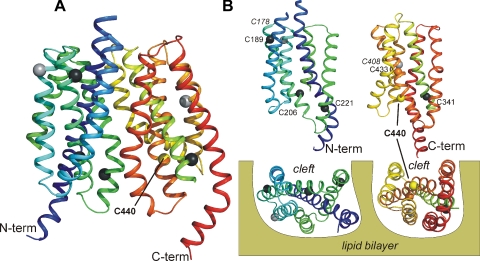
There are 13 and 10 native cysteine residues in hOAT1 and hOAT3, respectively. Figure 5 shows the location of selected cysteine residues in hOAT1, mapped on the current 3D homology model of hOAT1 structure. The present study focused on identifying the cysteine residue(s) in hOAT1 that influence the sensitivity to, or interaction with, thiol-reactive reagents evident in Figs. 3 and 4. For this initial screening, we focused on 6 of the 13 cysteine residues found in hOAT1, because the other 7 were considered unlikely to be accessible to impermeant thiol-reactive reagents. Four of these seven (C49, C78, C105, C128) are found in the long extracellular loop between transmembrane helices (TMHs) 1 and 2 and are conserved in all known orthologs of OAT1 and OAT3, as well as in OCT1 and OCT2. The homologous residues in the long extracellular loop of OCTs are refractory to interaction with thiol-reactive reagents and have been suggested to form disulfide linkages that play a critical structural role (9, 18). C332 is another residue unlikely to be exposed to the external medium because it is located in the long cytoplasmic loop between TMHs 6 and 7 that links the N- and C-terminal halves of the protein. The last two of the seven postulated inaccessible cysteines (C178, C408) are within TMHs 3 and 9, helices that do not comprise the hydrophilic cleft, but instead, are suspected of playing a role in anchoring/stabilizing the protein in the lipid bilayer (2, 11, 24). The six remaining cysteine residues (C189, C206, C221, C341, C433, C440) are found within helices that comprise the hydrophilic cleft and therefore were considered to have the greatest likelihood of being accessible to water-soluble, impermeant thiol-reactive reagents. The comparatively weak interaction of both OATs with thiol-reactive reagents evident in Figs. 3 and 4 suggested that none of the native cysteine residues in either protein is “freely accessible” to the aqueous external medium, which is consistent with visual inspection of the hOAT1 model (compared with the placement of cysteine residues in the cleft of OCT2) (7, 9).
Fig. 5.
A: side view of a ribbon depiction of the hOAT1 homology model. Transmembrane helices (TMHs) are sequentially colored from blue (N terminus) to red (C terminus). For clarity, the long extracellular and intracellular loops are not shown. The location of the native cysteine residues along the α-carbon backbones of the 12 TMHs is indicated by filled spheres. Light grey spheres indicate residues C178 and C408, which are located in supportive TMHs 3 and 6, respectively (labeled in italics in B). The remaining colored residues are in TMHs that comprise the hydrophilic cleft of OAT1. C440 is colored yellow, indicative of its relative reactivity with thiol-reactive reagents; the black residues (C189, C206, C221, C341) were not reactive (the orange residue, C433, proved refractory to substitution). B: N- and C-terminal halves of hOAT1 are depicted from the vantage point of the hydrophilic cleft, the 2 bottom images showing views of the cleft surfaces from the cytoplasmic aspect of the protein.
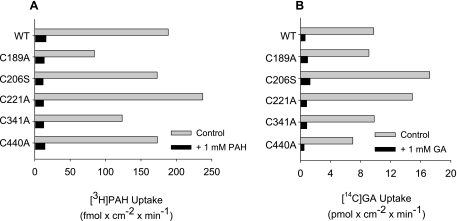
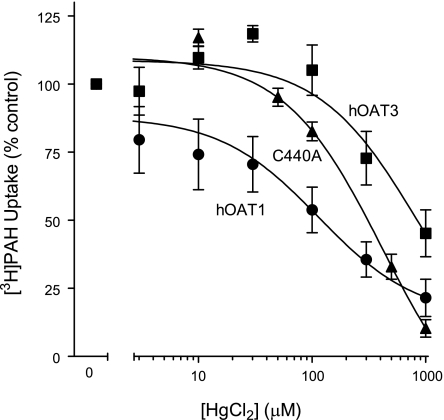
To determine whether OAT1's (modest) thiol reactivity was dominated by one of the native cysteine residues within the aqueous cleft, we made mutant hOAT1 constructs in each of which one of the cleft cysteine residues was replaced with an alanine or serine residue. Although efforts to replace C433 consistently failed, the other five cleft cysteines were successfully replaced. When stably expressed in CHO cells, each of the mutants supported blockable PAH and glutarate transport (Fig. 6), and in support of the conclusion that each variant had trafficked to the plasma membrane and retained a normal structural fold, the Kt of GA were similar to the wild-type transport protein (Kt values of 1 μM for wild-type hOAT1 vs. 1–3 μM for the mutant constructs; data not shown). Figure 7A compares the biotinylation profiles (NHS-B, MB, and MTSEA-B) of hOAT1, hOAT3, and each of the single-cysteine hOAT1 mutants. Whereas elimination of a cysteine at positions 189, 206, 221, or 341 had no effect on the reactivity of hOAT1 protein with either MB or MTSEA-B, replacing C440 with an alanine profoundly reduced the interaction of both thiol-reactive reagents with the protein, down to a level similar to that of hOAT3 (Fig. 7B). Elimination of what appeared to be the principal source of thiol reactivity in hOAT1 prompted us to reexamine the influence of HgCl2 on transport activity of the C440A mutant. As shown in Fig. 8, elimination of C440 from hOAT1 decreased (P < 0.05, Student's t-test) the HgCl2 sensitivity of the mutant protein (increase of IC50 from 106 ± 15.1 to 529 ± 127 μM) to a level similar to that of hOAT3. It is interesting to note that the extremely low reactivity of hOAT3 to thiol-reactive reagents occurred despite the presence in hOAT3 of a homolog to hOAT1's C440, i.e., C428. The failure of hOAT3 to interact appreciably with thiol-reactive reagents suggests that the immediate environment around C428 places steric limitations on its accessibility from the aqueous medium, which were not present in hOAT1.
Fig. 6.
Uptake of [3H]PAH (A) or [14C]-labeled glutarate (GA; B) by wild-type hOAT1 and mutant constructs of hOAT1. Uptakes were done in either the absence or presence of 1 mM unlabeled PAH or GA. The data are means of 2 separate experiments.
Fig. 8.
Effect of increasing concentrations of HgCl2 (0–1,000 μM) on [3H]PAH uptake by cells expressing wild-type hOAT1 or the C440A mutant construct of hOAT1. The effect of HgCl2 on [3H]ES uptake by cells expressing hOAT3 are shown for comparison. Data are presented as a percentage of the control uptake, i.e., uptake in the absence of HgCl2. Values are means ± SE of 4 separate experiments.
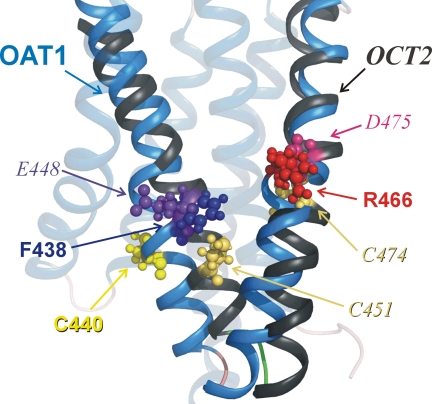
It is instructive to compare the profile of biochemical reactivity of C440 in hOAT1, and C451 and C474 in hOCT2, with their postulated locations in the current working homology models (Fig. 9). In agreement with the relatively free accessibility of C451 and C474 of hOCT2 to impermeant thiol-reactive reagents (7, 9), and the involvement of E448 and D475 (adjacent residues) in substrate binding (3, 24), these residues protrude into the cleft (7, 9). However, none of the native cysteine residues in hOAT1 project into the cleft (Figs. 5 and Fig. 9), and this observation is consistent with the relatively weak interaction of thiol-reactive reagents with this transport protein. In contrast, F438 and R466, residues known to be important for substrate binding in OAT1 (11, 15), are both freely exposed. The finding that C440 appears to be only partially or transiently exposed to the aqueous milieu is consistent with a more effective exposure of F438, a half-helical turn away from C440, within the aqueous cleft surface.
Fig. 9.
Comparison of key residues in TMHs 10 and 11 of hOAT1 (blue) and hOCT2 (grey). The homology models of hOAT1 (11) and hOCT2 (24) as revised (9) were aligned in Pymol (v0.99, DeLano Scientific). Key residues are displayed as ball-and-stick (OAT1 in nonitalic type; OCT2 in italic); see text for discussion.
In summary, the present study showed that 1) hOAT1 and hOAT3, while displaying very similar selectivity for DMPS, discriminated markedly between structurally similar compounds; 2) compound volume/size appeared to be an important determinant for binding to OAT1 and OAT3; 3) the selectivity of the substrate/inhibitor binding regions of OAT1 and OAT3 was fairly conserved across human, mouse, and rabbit orthologs; 4) subtle differences in the placement of conserved amino acid residues in hOAT1 and hOAT3 influenced their distinct sensitivities to Hg2+; and 5) the relatively limited accessibility to the aqueous medium of C440A in hOAT1, and free accessibility of C451 and C474 in hOCT2, was consistent with the current homology models of their 3D structures.
GRANTS
This work was supported by National Institutes of Health (NIH) NRSA award DK752422 and NIH Grants 1R01DK074022, 5P30E006694, and 5T32HL07249.
DISCLOSURES
No conflicts of interest, financial or otherwise, are declared by the authors.
REFERENCES
- 1. Abramson J, Smirnova I, Kasho V, Verner G, Kaback HR, Iwata S. Structure and mechanism of the lactose permease of Escherichia coli. Science 301: 610–615, 2003 [DOI] [PubMed] [Google Scholar]
- 2. Gorboulev V, Shatskaya N, Volk C, Koepsell H. Subtype-specific affinity for corticosterone of rat organic cation transporters rOCT1 and rOCT2 depends on three amino acids within the substrate binding region. Mol Pharmacol 67: 1612–1619, 2005 [DOI] [PubMed] [Google Scholar]
- 3. Gorboulev V, Volk C, Arndt P, Akhoundova A, Koepsell H. Selectivity of the polyspecific cation transporter rOCT1 is changed by mutation of aspartate 475 to glutamate. Mol Pharmacol 56: 1254–1261, 1999 [DOI] [PubMed] [Google Scholar]
- 4. Huang Y, Lemieux MJ, Song J, Auer M, Wang DN. Structure and mechanism of the glycerol-3-phosphate transporter from Escherichia coli. Science 301: 616–620, 2003 [DOI] [PubMed] [Google Scholar]
- 5. Li S, Duan P, You G. Regulation of human organic anion transporter 3 by peptide hormone bradykinin. J Pharmacol Exp Ther 333: 970–975, 2010 [DOI] [PMC free article] [PubMed] [Google Scholar]
- 6. Lungkaphin A, Chatsudthipong V, Evans KK, Groves CE, Wright SH, Dantzler WH. Interaction of the metal chelator, DMPS, with OAT1 and OAT3 in intact isolated rabbit renal proximal tubules. Am J Physiol Renal Physiol 286: F68–F76, 2004 [DOI] [PubMed] [Google Scholar]
- 7. Pelis RM, Dangprapai Y, Wunz TM, Wright SH. Inorganic mercury interacts with cysteine residues (C451 and C474) of hOCT2 to reduce its transport activity. Am J Physiol Renal Physiol 292: F1583–F1591, 2007 [DOI] [PubMed] [Google Scholar]
- 8. Pelis RM, Suhre WM, Wright SH. Functional influence of N-glycosylation in OCT2-mediated tetraethylammonium transport. Am J Physiol Renal Physiol 290: F1118–F1126, 2006 [DOI] [PubMed] [Google Scholar]
- 9. Pelis RM, Zhang X, Dangprapai Y, Wright SH. Cysteine accessibility in the hydrophilic cleft of human organic cation transporter 2. J Biol Chem 281: 35272–35280, 2006 [DOI] [PubMed] [Google Scholar]
- 10. Pelis RM, Zydlewski J, McCormick SD. Gill Na+-K+-2Cl− cotransporter abundance and location in Atlantic salmon: effects of seawater and smolting. Am J Physiol Regul Integr Comp Physiol 280: R1844–R1852, 2001 [DOI] [PubMed] [Google Scholar]
- 11. Perry JL, Dembla-Rajpal N, Hall LA, Pritchard JB. A three-dimensional model of human organic anion transporter 1: aromatic amino acids required for substrate transport. J Biol Chem 281: 38071–38079, 2006 [DOI] [PMC free article] [PubMed] [Google Scholar]
- 12. Popp C, Gorboulev V, Muller T, Gorbunov D, Shatskaya N, Koepsell H. Amino acids critical for substrate affinity of rat organic cation transporter 1 line the substrate binding region in a model derived from the tertiary structure of lactose permease. Mol Pharmacol 67: 1600–1611, 2005 [DOI] [PubMed] [Google Scholar]
- 13. Pritchard JB, Miller DS. Renal secretion of organic anions and cations. Kidney Int 49: 1649–1654, 1996 [DOI] [PubMed] [Google Scholar]
- 14. Rizwan AN, Burckhardt G. Organic anion transporters of the SLC22 family: biopharmaceutical, physiological, and pathological roles. Pharm Res 24: 450–470, 2007 [DOI] [PubMed] [Google Scholar]
- 15. Rizwan AN, Krick W, Burckhardt G. The chloride dependence of the human organic anion transporter 1 (hOAT1) is blunted by mutation of a single amino acid. J Biol Chem 282: 13402–13409, 2007 [DOI] [PubMed] [Google Scholar]
- 16. Rodiger M, Zhang X, Ugele B, Gersdorff N, Wright SH, Burckhardt G, Bahn A. Organic anion transporter 3 (OAT3) and renal transport of the metal chelator 2,3-dimercapto-1-propanesulfonic acid (DMPS). Can J Physiol Pharmacol 88: 141–146, 2010 [DOI] [PMC free article] [PubMed] [Google Scholar]
- 17. Shu Y, Brown C, Castro R, Shi R, Lin E, Owen R, Sheardown S, Yue L, Burchard E, Brett C, Giacomini K. Effect of genetic variation in the organic cation transporter 1, OCT1, on metformin pharmacokinetics. Mol Ther 83: 273–280, 2008 [DOI] [PMC free article] [PubMed] [Google Scholar]
- 18. Sturm A, Gorboulev V, Gorbunov D, Keller T, Volk C, Schmitt BM, Schlachtbauer P, Ciarimboli G, Koepsell H. Identification of cysteines in rat organic cation transporters rOCT1 (C322, C451) and rOCT2 (C451) critical for transport activity and substrate affinity. Am J Physiol Renal Physiol 293: F767–F779, 2007 [DOI] [PubMed] [Google Scholar]
- 19. Vardy E, Arkin IT, Gottschalk KE, Kaback HR, Schuldiner S. Structural conservation in the major facilitator superfamily as revealed by comparative modeling. Protein Sci 13: 1832–1840, 2004 [DOI] [PMC free article] [PubMed] [Google Scholar]
- 20. Wright SH. Role of organic cation transporters in the renal handling of therapeutic agents and xenobiotics. Toxicol Appl Pharmacol 204: 309–319, 2005 [DOI] [PubMed] [Google Scholar]
- 21. Wright SH, Dantzler WH. Molecular and cellular physiology of renal organic cation and anion transport. Physiol Rev 84: 987–1049, 2004 [DOI] [PubMed] [Google Scholar]
- 22. Zach O, Krieger O, Foedermayr M, Zellhofer B, Lutz D. OCT1 (SLC22A1) R61C polymorphism and response to imatinib treatment in chronic myeloid leukemia patients. Leuk Lymphoma 49: 2222–2223, 2008 [DOI] [PubMed] [Google Scholar]
- 23. Zhang Q, Hong M, Duan P, Pan Z, Ma J, You G. Organic anion transporter OAT1 undergoes constitutive and protein kinase C-regulated trafficking through a dynamin- and clathrin-dependent pathway. J Biol Chem 283: 32570–32579, 2008 [DOI] [PMC free article] [PubMed] [Google Scholar]
- 24. Zhang X, Shirahatti NV, Mahadevan D, Wright SH. A conserved glutamate residue in transmembrane helix 10 influences substrate specificity of rabbit OCT2 (SLC22A2). J Biol Chem 280: 34813–34822, 2005 [DOI] [PubMed] [Google Scholar]


