

Abstract
A spin echo-based MRSI sequence was developed to acquire edited spectra of γ-aminobutyric acid in an entire slice. Water and lipid signals were suppressed by a dual-band presaturation sequence, which included integrated outer volume suppression pulses for additional lipid suppression. Experiments in three normal volunteers were performed at 3 T using a 32-channel head coil. High signal-to-noise ratio spectra and metabolic images of γ-aminobutyric acid were acquired from nominal 4.5 cm3 voxels (estimated actual voxel size 7.0 cm3) in a scan time of 17 min. The sequence is also expected to co-edit homocarnosine and macromolecules, giving a composite γ-aminobutyric acid+ resonance. The γ-aminobutyric acid+ to water ratio was measured using a companion water MRSI scan and was found to correlate linearly with the % gray matter (GM) of each voxel (γ-aminobutyric acid+/water = (1.5 × GM + 3.2) × 10−5, R = 0.27), with higher γ-aminobutyric acid+ levels in gray matter compared with white. In conclusion, high signal-to-noise ratio γ-aminobutyric acid-MRSI is possible at 3 T within clinically feasible scan times.
Keywords: GABA, magnetic resonance spectroscopic imaging, 3 Tesla
INTRODUCTION
Gamma-aminobutyric acid (GABA) is the most abundant inhibitory neurotransmitter in the human brain and is of major interest to the clinical neuroscience community (1). Abnormal GABA levels are postulated to play an important role in various neurological disorders, in particular epilepsy (2) and in several psychiatric disorders (3– 5). Brain GABA levels have been demonstrated to increase in response to various anti-epileptic medications (1) and correlate with seizure control (6). Recent studies have also found inverse relationships between brain function (for instance, as measured by magnetoencephalography (MEG) or fMRI) and localized GABA levels, suggesting a prominent role of GABA in the regulation of brain activity (7–9).
Currently, the only noninvasive method to measure brain GABA concentrations is magnetic resonance spectroscopy (MRS). In a conventional proton brain spectrum, the GABA signal is approximately one order of magnitude smaller than the commonly observed signals (e.g., choline, creatine (Cr), or N-acetylaspartate (NAA)) and is strongly overlapped by these and other resonances. Therefore, it is common practice to use spectral editing techniques to reliably observe and quantify GABA free from spectral overlap with larger signals. Commonly used approaches include “J-difference” spectroscopy (10,11), multiple-quantum filtering (MQF) (12,13), or other (14–16) techniques.
Over the last few years, the “MEscher-GArwood Point RESolved Spectroscopy” (MEGA-PRESS) J-difference technique (10,17,18) has become widely used for measuring GABA from well defined, single voxels. However, MEGA-PRESS GABA measurements are usually from large tissue volumes and quite time-consuming (e.g., on the order of 10 min, 30 cm3), and it is difficult to measure more than a handful of brain regions in a single clinical study. Attempts have been made to map the distribution of GABA in the human brain using spectroscopic imaging (MRSI) sequences with MQF or two-dimensional J-spectroscopy (13,19–22). However signal-to- noise ratios (SNR) using MQF techniques may be adversely effected by inefficiencies in creating and detecting multiple quantum coherences, as well as radio-frequency (RF) pulse imperfections. MRSI measurements of GABA using a 2D J-resolved sequence (21,22) suffer from substantial overlap with the nonsuppressed Cr signal. In this article, an alternative method of mapping brain GABA levels over a whole brain slice using MRSI based on a J-difference approach is described. The sequence uses a relatively simple design, with few RF pulses, that is expected to be less sensitive to RF pulse imperfections and signal losses than MQF techniques. It is demonstrated that this sequence, performed at 3 T using a 32-channel head coil, can give excellent SNR from relatively small voxels (nominal 4.5 cm3; estimated actual voxel size 7.0 cm3) in clinically feasible scan times. Similar to the MEGA-PRESS and other editing techniques, the sequence is expected to co-edit resonances from homocarnosine and macromolecules (MM) (11,23,24), and the abbreviation GABA+ is used throughout this article to acknowledge contributions from these compounds. As with all J-difference methods, the method is potentially susceptible to head motion or other instabilities.
MATERIALS AND METHODS
The basic building block of the pulse sequence is a slice-selective spin echo MRSI scan with two dimensional phase-encoding, and water and lipid suppression (25,26) (Fig. 1). For “pseudo-triplets” such as the C2 or C4 methylene protons of GABA, if the TE of the sequence is chosen to be 1/2J (68 ms; J2-3 ≈ 5 to 10 Hz) then the outer lines of the multiplets are inverted due to modulation by the homonuclear scalar coupling to the C3 protons at 1.9 ppm. If a second experiment is performed with frequency-selective 180° editing pulses applied to the C3 protons at 1.9 ppm, the modulation due to the scalar coupling is removed, and the outer lines of the C2 multiplet will have positive signal intensity. By subtracting these two scans, all signals unaffected by the editing pulse are removed. Signals predominantly affected are the desired GABA C2 and C4 resonances at 3.01 and 2.29 ppm, respectively, as well as contributions from homocarnosine and macromolecules. Particular care has to be taken to suppress unwanted lipid signals. As the editing pulse also affects the very strong scalp lipid signals (see below), good lipid suppression is required to avoid residual lipid artifacts in the edited spectra. In this implementation, therefore, lipid suppression was achieved using a dual-band water and lipid suppression scheme with additional lipid suppression provided by integrated outer-volume suppression (OVS) (27).
FIG. 1.
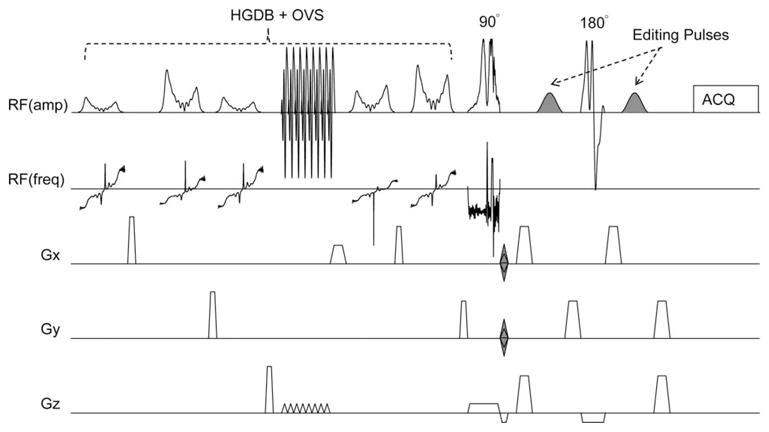
Schematic illustration of the pulse sequence for GABA-edited MRSI of the human brain. The sequence consists of a slice-selective spin-echo sequence with TE 68 ms, with phase-encoding in 2 directions (x and y). A high bandwidth frequency modulated slice selective excitation pulse is used. Frequency selective editing pulses (shaded) are applied at 1.9 ppm and 0.7 ppm on alternating scans. The spin-echo sequence is preceded by a hyper geometric dual-band (HGDB) sequence with integrated outer-volume suppression (OVS) for water and lipid suppression (27).
Experiments were performed on three normal volunteers (three female, ages 36 ± 10 years) on a 3T Achieva system (Philips Healthcare, Best, Netherlands) with a 32-channel phased array coil (Invivo Inc., Orlando, FL). After collection of localizer images and receiver coil sensitivity maps, a single axial slice at the level of the centrum semiovale was acquired (Fig. 2) just above the roof of the lateral ventricles.
FIG. 2.

GABA-MRSI data from one subject; (a) reconstructed GABA+/water image from the whole slice, (b) water MRSI image from the same slice, (c) coronal localizer image showing slice location of GABA-MRSI and OVS pulses, (d) MP-RAGE MRI shows voxel locations of two selected voxels from mesial gray matter and left frontoparietal white matter, (e) average gray matter composition map from the imaging slices co-registered with the MRSI slice (dotted white line indicates 5 × 5 voxel locations in Fig. 3), and edited spectra from (f) mesial gray matter and (g) left frontoparietal white matter (voxel locations indicated in 2d) showing signals from GABA+ at 3.0 ppm, glutamate and glutamine (Glx) at 3.6 ppm, and GABA plus Glx at 2.2 ppm.
Sinc-gaussian editing pulses (20 ms, 107 Hz bandwidth) were added to a spin-echo 2D-MRSI sequence with dual-band water and lipid suppression and OVS (23) (Fig. 1). The dual-band pulses gave a pass band from 4.1 ppm to 1.8 ppm; full details of this sequence are given in reference (27). The editing pulses were placed on the H3 protons at 1.9 ppm in the “ON” acquisition, and at 0.7 ppm in the “OFF” acquisition. The 0.7 ppm “OFF” frequency was chosen to be symmetric about the 1.3 ppm lipid signal, to help reduce the lipid resonance in the difference spectrum. TE/TR was 68 ms/2s, and the bandwidths of the slice selective excitation and refocusing pulses were 4.26 kHz and 1.26 kHz (pulse waveforms are shown in Fig. 1, and are available upon request), respectively. For 2D-MRSI, the FOV was 21 × 18 cm2, 14 × 12 acquisition matrix (interpolated to 32 × 27), 20 mm slice thickness, giving a nominal acquired voxel size of 1.5 × 1.5 × 2.0 = 4.5 cm3 (estimated actual voxel size 7.0 cm3). Four averages were performed ([ON+OFF]×2-step phase cycle, 0° and 180° alternation of the excitation pulse and receiver phase) resulting in a total scan time with circular phase-encoding of 17 min 38 sec. Multichannel MRSI data were optimally combined based on receive coil sensitivity profiles determined from MRI. Before MRSI data acquisition, a rapid field mapping technique was used to optimize B0 homogeneity and to determine the optimal transmit B1 level (i.e., best flip angle calibration over the slice used for MRSI) (28).
To compensate for magnetic field drift over the 17 min duration of the MRSI acquisition, a small flip-angle pulse was used to measure the resonance frequency of brain water at the beginning of each TR time period, and correct the transmit (slice selection, editing and water/lipid suppression) and receive RF frequencies accordingly. This function was not applied between consecutive ON and OFF scans with the same phase encoding and phase cycling parameters, so that pairs of ON and OFF scans were always executed with the same center frequency to minimize subtraction error, but field drift over a longer time scale was compensated.
Two additional co-registered scans were included with the GABA-MRSI scan for the purpose of postprocessing and spectral quantification. First, an unedited MRSI without water suppression was recorded with one average, identical FOV and resolution to the GABA-MRSI scan. The slice selective pulse center frequency set to the water resonance at 4.7 ppm, while for the GABA-MRSI it was set for GABA at 3 ppm. The scan time was 4 min 26 sec. Second, a 3D T1-weighted “MP-RAGE” scan (75-slices) was prescribed with the same in-plane FOV, and imaging resolution of 2.2 × 2.2 × 1.1 mm3. The scan time for this sequence was 2 min 4 sec.
Voxel-by-voxel phase and susceptibility correction for the GABA-MRSI spectra was performed using the corresponding phase and frequency values determined from the unsuppressed water MRSI. Four Hertz exponential line broadening was applied before Fourier transformation with respect to time. A linear baseline correction was applied based on data points at 2.7 and 3.3 ppm, and the area of the C2 GABA+ peak at 3.01 ppm determined by integration after subtraction of the linear baseline. The baseline correction was performed to remove any residual DC offset in the spectrum, and the integration range (3.2 to 2.8 ppm) was wide enough to account for the voxel to voxel linewidth variations. This procedure was automated using Matlab (Mathworks, Natick, MA) for all the voxels, resulting in an image of the GABA+ signal for the slice. Water spectra were processed similarly to generate an image of water signal for the slice, and the ratio GABA+-to-water in each voxel was also calculated.
MP-RAGE images were segmented in FSL (FMRIB, Oxford, UK) to produce maps of gray matter composition (29). Eighteen (=20 mm/1.1 mm) segmented slices corresponding to the same location as the MRSI slice were averaged to produce a co-registered gray matter map. The map was then down-sampled to the resolution of the MRSI images for statistical analysis. For the correlation of GABA+-to-water with tissue composition (% gray matter (GM)), the anterior part (~40%) of each slice was discarded because of lesser spectral quality above the sinus region. Linear regression was then performed to the pixel values of the GABA-to-water maps and %GM maps.
RESULTS
Figure 2 shows the reconstructed image of GABA+-to-water and corresponding water image from one subject, as well as localized MP-RAGE image and GM composition map. Two selected spectra are shown from gray and white matter voxels. In these voxels, doublets are seen for both the C2 and C4 resonances of GABA, as well as the co-edited Glx signal at 3.6 ppm. The chemical shift of the edited C2 resonance was measured to be 3.01 ppm, consistent with literature and phantom (see below) GABA values. Figure 3 shows a 5 × 5 MRSI grid from two subjects at the level of the centrum semiovale (grid location shown in Fig. 2e). Average GABA+ SNR measured in central voxel locations over the three subjects was 12.0 ± 4.6. Figure 4 shows the result of linear regression of GABA+-to-water ratio versus tissue gray matter fraction for all three subjects. With data acquired from all three subjects, the regression equation was determined to be
FIG. 3.

5 × 5 spectra from the interpolated MRSI grid from two subjects; the location of the 5 × 5 grid is illustrated in one subject in Fig. 2e; signals can be seen from the GABA+ at 3.0 ppm (gray overlay) as well as co-edited signals from Glx at 3.6 ppm in all spectra plotted.
FIG. 4.
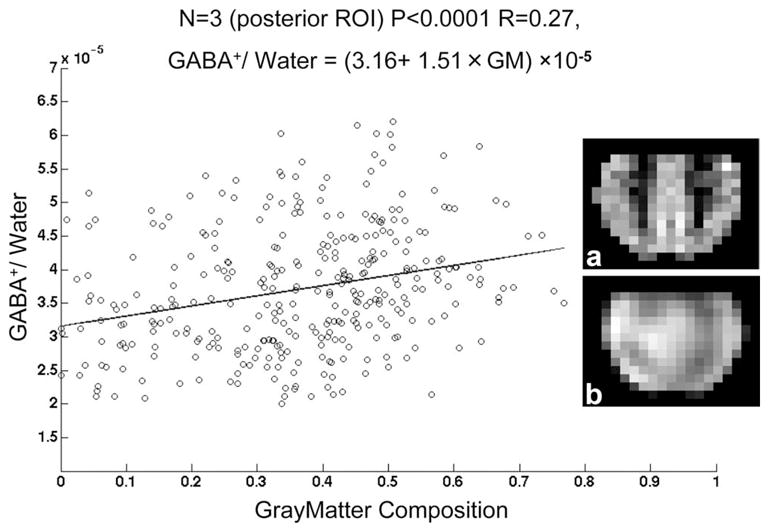
Linear regression of GABA+/water ratio versus % gray matter for all three subjects. Insert images show (a) % gray matter composition and (b) and GABA+/water ratio in the posterior region of interest used for analysis from one subject.
where GM is the gray matter fraction, with R = 0.27 and P < 0.0001. The standard deviations for the slope and intercept were ±0.1 × 10⁻⁵ and ±0.2 × 10⁻⁵, respectively. GABA+-to-water ratios for gray and white matter regions calculated from regression equations are given in Table 1.
Table 1.
Average GABA+/Water Ratios for Gray and White Matter
| Subject | White matter | Gray matter |
|---|---|---|
| 1 | 3.31 | 4.76 |
| 2 | 3.01 | 4.60 |
| 3 | 2.99 | 4.69 |
| All | 3.16 | 4.67 |
Figure 5 shows selected GABA-MRSI data in a phantom containing GABA, glutamate, and other neurochemicals (including Cr and NAA) at near physiological concentrations, confirming the ability of the sequence to edit GABA. Note that the multiplet structure of the GABA 3.01 peak is only discernible in central voxels where field homogeneity is high. More peripheral voxels show an unresolved multiplet for 3.01 ppm. The range of field homogeneity in the slice used for MRSI was in the range ±10 Hz. Figure 5 also shows inversion profile of the editing pulses (with a MEGA-PRESS-typical pulse for comparison) combined with a histogram of the frequency distribution of the creatine resonance in vivo to demonstrate that regional variation of B0 field (relative to the editing pulse frequency) will not result in creatine subtraction artifacts due to direct saturation. However, it should be kept in mind that subtraction artifacts might occur for other reasons (e.g., motion) in J-difference experiments of this type; in vivo, the unedited Cr signal is an order of magnitude larger than the GABA resonance due to concentration differences. In the phantom of Fig. 5, the Cr concentration is a factor of 3.3 times higher than GABA (Cr 10 mM, GABA 3 mM).
FIG. 5.

a: GABA-MRSI in a phantom containing metabolites (but no macromolecules) at similar concentrations to those found in the human brain (NAA 12.5 mM, Cr 10.0 mM, Cho 3.0 mM, myo-inositol 7.5 mM, glutamate 12.5 mM, lactate 5.0 mM, GABA 3.0 mM) (b) corresponding MR image showing voxels locations for (a). The multiplet structure of the edited 3.0 GABA peak is only clearly visible in spectrum 1 from the center of the sample; field homogeneity degrades off-center so that (e.g., spectra 3 and 4) the splittings are no longer resolved. c: Histogram of field inhomogeneity (off-resonance frequency) over the GABA-MRSI slice, showing that the peak-to-peak field inhomogeneity is ~±10 Hz. d: Histogram of Cr peak frequency from one in vivo dataset, showing a peak-to-peak range of ~0.1 ppm. Also indicated are the inversion profile for the 20 msec editing pulse used in all experiments in this article and, for comparison, that of a 14 msec editing pulse as commonly used in MEGA-PRESS. It can be seen that with either editing pulse, no direct saturation of Cr should occur, but that the 20 msec is pulse is significantly more selective.
DISCUSSION
The GABA-MRSI sequence with dual-band suppression can acquire edited GABA+ spectra with excellent SNR and resolution within a reasonable scan time. The spatial resolution (nominal 4.5 cm3, estimated actual resolution 7.0 cm3 based on the use of circular k-space sampling) and coverage of the current scans exceeds by nearly an order of magnitude that of prior single-voxel (MEGA-PRESS) and relatively motion insensitive MQ-filtered CSI experiments (10,12,13). Although J-difference edited MRSI has been applied for the detection of lactate (30), as far as we are aware this approach has not previously been used for GABA+.
The excellent SNR of this study can be attributed to several factors, including the relative simplicity (few RF pulses) of the pulse sequence, the use of high (3 T) field strength, and the high sensitivity of the 32-channel head coil. The slice-selective spin-echo localization sequence allows signals to be detected all the way to the edge of the cortex to form a complete metabolic image of GABA+, unlike PRESS-based approaches to MRSI (31). In addition, because only a single 180° slice selective refocusing pulse is applied (instead of two in PRESS), the loss of signal due to unwanted modulation patterns caused by chemical shift displacement effects is also smaller (17). In this implementation, the use of a high bandwidth refocusing pulse (1.26 kHz) resulted in a displacement of 11% (or 2.2 mm) of the GABA C3 slice relative to the C2 slice (17). A single 180° refocusing pulse also allows longer, more selective editing pulses to be used than in a PRESS sequence, potentially giving greater editing selectivity and less unwanted co-editing of other compounds, however macromolecules and homocarnosine still co-edit in the current implementation (32). Three Tesla human brain MRS has also been shown to have higher SNR than 1.5 T MRS provided that appropriate care is taken in protocol design (33), and 32-channel head coils have been shown to exhibit more than 2-fold increase in SNR compared to eight-channel coils, depending on voxel location (34). Maximum sensitivity of multichannel experiments depends on optimum combination of coil channels (35). All of these factors in this experiments resulted in GABA-MRSI data with excellent SNR.
Various other experimental factors are important for the successful implementation of GABA-edited MRSI. Since accurate subtraction of “on” and “off” scans is of key importance, it is important to interleave these acquisitions to minimize the effects of any scanner drift, or drift due to subject motion. Over the acquisition time of 17 min, significant drift of the magnetic field strength can occur. To compensate for this, a frequency drift correction (based on a small flip angle pulse on the water resonance for every TR) was used to correct the center frequency throughout the acquisition. However, paired “on” and “off” acquisitions were recorded with the same center frequency to prevent subtraction errors. Similarly, successful edited MRSI depends on the main magnetic field homogeneity being sufficient across the volume of the MRSI slice; inadequate field homogeneity results in loss of signal both due to broader lines and loss of editing efficiency as the editing pulse becomes off resonance. In this study, high order shimming using a field-map based optimization was used to maximize field homogeneity over the whole slice. Obtaining sufficient field homogeneity (±0.1 ppm) over large volumes remains one of the challenges in extending this methodology to multislice, or even whole brain, coverage.
Lipid suppression is particularly important as the editing pulse causes the presence of lipids in the difference spectra, and unsuppressed lipid signals may be massive compared to the small GABA+ resonance. Therefore, the use of the combined dual-band-OVS sequence, which was particularly optimized for lipid suppression (27), was essential for successful implementation of these experiments. Residual lipid signal was also minimized by setting the “off” editing pulse at 0.7 ppm, so that the “on” (at 1.9 ppm) and “off” pulses were placed symmetrically around the 1.3 ppm lipid resonance. If lipid presaturation is sufficiently good, an alternative possibility with the spin-echo approach would be to set the “off” pulse to 1.5 ppm to minimize co-editing of the 1.7 ppm macromolecule signal (36). This is usually not possible with MEGA-PRESS because the editing pulses are shorter and not sufficiently frequency selective. Similar to MEGA-PRESS, however, the spin-echo GABA-MRSI sequence can also be used to observe (and map the distribution of) the combined glutamate and glutamine (Glx) alpha protons which co-edit at 3.8 ppm (Figs. 2 and 3).
In this study, GABA+ was quantified relative to the unsuppressed water signal. This approach is commonly used in conventional, unedited MRSI and has also been used for GABA+ quantification with MEGA-PRESS (7,8,18), although both the creatine and NAA signals have also previously been used for normalization (37). Regression analysis suggests an ~48% higher GABA+/water ratio in grey matter than white matter. Higher GABA+ in gray matter has also been reported previously (20,21), with a somewhat larger difference between gray and white matter. The lower difference between gray and white matter GABA+ found in this study may reflect technical differences, including differences in spatial resolution. It is also possible that unknown GABA+ T1 differences between gray and white matter may affect this ratio, as relatively short TR of 2 sec was used in this experiments. Although not attempted here, if relaxation times, water content and editing efficiency are known, it is possible to estimate GABA+ concentrations from the GABA+/water ratio. Concentration estimates might also be improved by more advanced curve-fitting techniques, such as the LCModel with appropriate basis sets and control parameters (38), which can make use of both the C2 and C4 GABA+ resonances in the edited spectrum. Although prior MEGA-PRESS studies have reported ratios of GABA+/water (7,8,18), they have done so in “institutional units” which make comparison to this study difficult.
In conclusion, using a spin-echo based J-difference method, high spatial resolution MRSI of GABA+ in the human brain is possible with good SNR. It should be remembered, as in MEGA-PRESS, that homocarnosine and MM co-edit with GABA, and that there is potential for residual Cr (due to subtraction artifact) also to contribute to the GABA+ signal. This methodology enables the study of regional variation of GABA+ signals (and of particular interest, regional variation of individual differences in GABA+ among healthy controls) which has not been widely studied previously. It is anticipated that GABA-MRSI will have application in both clinical and basic neuroscience, where knowledge of the spatial distribution of GABA+ is important.
Acknowledgments
Grant sponsor:NIH; Grant numbers: P41RR15241, R21MH082322.
The authors thank Dr. Michael Schär, Philips Healthcare, for excellent technical support.
References
- 1.Petroff OA. GABA and glutamate in the human brain. Neuroscientist. 2002;8:562–573. doi: 10.1177/1073858402238515. [DOI] [PubMed] [Google Scholar]
- 2.Petroff OA, Rothman DL, Behar KL, Mattson RH. Low brain GABA level is associated with poor seizure control. Ann Neurol. 1996;40:908–911. doi: 10.1002/ana.410400613. [DOI] [PubMed] [Google Scholar]
- 3.Behar KL, Rothman DL, Petersen KF, Hooten M, Delaney R, Petroff OA, Shulman GI, Navarro V, Petrakis IL, Charney DS, Krystal JH. Preliminary evidence of low cortical GABA levels in localized 1H-MR spectra of alcohol-dependent and hepatic encephalopathy patients. Am J Psychiatry. 1999;156:952–954. doi: 10.1176/ajp.156.6.952. [DOI] [PubMed] [Google Scholar]
- 4.Goddard AW, Mason GF, Rothman DL, Behar KL, Petroff OA, Krystal JH. Family psychopathology and magnitude of reductions in occipital cortex GABA levels in panic disorder. Neuropsychopharmacology. 2004;29:639–640. doi: 10.1038/sj.npp.1300374. [DOI] [PubMed] [Google Scholar]
- 5.Sanacora G, Mason GF, Rothman DL, Hyder F, Ciarcia JJ, Ostroff RB, Berman RM, Krystal JH. Increased cortical GABA concentrations in depressed patients receiving ECT. Am J Psychiatry. 2003;160:577–579. doi: 10.1176/appi.ajp.160.3.577. [DOI] [PubMed] [Google Scholar]
- 6.Petroff OA, Mattson RH, Behar KL, Hyder F, Rothman DL. Vigabatrin increases human brain homocarnosine and improves seizure control. Ann Neurol. 1998;44:948–952. doi: 10.1002/ana.410440614. [DOI] [PubMed] [Google Scholar]
- 7.Edden RA, Muthukumaraswamy SD, Freeman TC, Singh KD. Orientation discrimination performance is predicted by GABA concentration and gamma oscillation frequency in human primary visual cortex. J Neurosci. 2009;29:15721–15726. doi: 10.1523/JNEUROSCI.4426-09.2009. [DOI] [PMC free article] [PubMed] [Google Scholar]
- 8.Muthukumaraswamy SD, Edden RA, Jones DK, Swettenham JB, Singh KD. Resting GABA concentration predicts peak gamma frequency and fMRI amplitude in response to visual stimulation in humans. Proc Natl Acad Sci USA. 2009;106:8356–8361. doi: 10.1073/pnas.0900728106. [DOI] [PMC free article] [PubMed] [Google Scholar]
- 9.Northoff G, Walter M, Schulte RF, Beck J, Dydak U, Henning A, Boeker H, Grimm S, Boesiger P. GABA concentrations in the human anterior cingulate cortex predict negative BOLD responses in fMRI. Nat Neurosci. 2007;10:1515–1517. doi: 10.1038/nn2001. [DOI] [PubMed] [Google Scholar]
- 10.Mescher M, Merkle H, Kirsch J, Garwood M, Gruetter R. Simultaneous in vivo spectral editing and water suppression. NMR Biomed. 1998;11:266–272. doi: 10.1002/(sici)1099-1492(199810)11:6<266::aid-nbm530>3.0.co;2-j. [DOI] [PubMed] [Google Scholar]
- 11.Rothman DL, Petroff OA, Behar KL, Mattson RH. Localized 1H NMR measurements of gamma-aminobutyric acid in human brain in vivo. Proc Natl Acad Sci USA. 1993;90:5662–5666. doi: 10.1073/pnas.90.12.5662. [DOI] [PMC free article] [PubMed] [Google Scholar]
- 12.Shen J, Rothman DL, Brown P. In vivo GABA editing using a novel doubly selective multiple quantum filter. Magn Reson Med. 2002;47:447–454. doi: 10.1002/mrm.10104. [DOI] [PubMed] [Google Scholar]
- 13.Shen J, Shungu DC, Rothman DL. In vivo chemical shift imaging of gamma-aminobutyric acid in the human brain. Magn Reson Med. 1999;41:35–42. doi: 10.1002/(sici)1522-2594(199901)41:1<35::aid-mrm7>3.0.co;2-c. [DOI] [PubMed] [Google Scholar]
- 14.de Graaf RA, Rothman DL. Detection of gamma-aminobutyric acid (GABA) by longitudinal scalar order difference editing. J Magn Reson. 2001;152:124–131. doi: 10.1006/jmre.2001.2371. [DOI] [PubMed] [Google Scholar]
- 15.Schulte RF, Boesiger P. ProFit: two-dimensional prior-knowledge fitting of J-resolved spectra. NMR Biomed. 2006;19:255–263. doi: 10.1002/nbm.1026. [DOI] [PubMed] [Google Scholar]
- 16.Thomas MA, Yue K, Binesh N, Davanzo P, Kumar A, Siegel B, Frye M, Curran J, Lufkin R, Martin P, Guze B. Localized two-dimensional shift correlated MR spectroscopy of human brain. Magn Reson Med. 2001;46:58–67. doi: 10.1002/mrm.1160. [DOI] [PubMed] [Google Scholar]
- 17.Edden RA, Barker PB. Spatial effects in the detection of gamma-aminobutyric acid: improved sensitivity at high fields using inner volume saturation. Magn Reson Med. 2007;58:1276–1282. doi: 10.1002/mrm.21383. [DOI] [PubMed] [Google Scholar]
- 18.Evans CJ, McGonigle DJ, Edden RA. Diurnal stability of gamma-aminobutyric acid concentration in visual and sensorimotor cortex. J Magn Reson Imaging. 2010;31:204–209. doi: 10.1002/jmri.21996. [DOI] [PubMed] [Google Scholar]
- 19.Choi IY, Lee SP, Merkle H, Shen J. Single-shot two-echo technique for simultaneous measurement of GABA and creatine in the human brain in vivo. Magn Reson Med. 2004;51:1115–1121. doi: 10.1002/mrm.20082. [DOI] [PubMed] [Google Scholar]
- 20.Choi IY, Lee SP, Merkle H, Shen J. In vivo detection of gray and white matter differences in GABA concentration in the human brain. Neuroimage. 2006;33:85–93. doi: 10.1016/j.neuroimage.2006.06.016. [DOI] [PubMed] [Google Scholar]
- 21.Jensen JE, Frederick Bde B, Renshaw PF. Grey and white matter GABA level differences in the human brain using two-dimensional, J-resolved spectroscopic imaging. NMR Biomed. 2005;18:570–576. doi: 10.1002/nbm.994. [DOI] [PubMed] [Google Scholar]
- 22.Jensen JE, Frederick BD, Wang L, Brown J, Renshaw PF. Two-dimensional, J-resolved spectroscopic imaging of GABA at 4 Tesla in the human brain. Magn Reson Med. 2005;54:783–788. doi: 10.1002/mrm.20644. [DOI] [PubMed] [Google Scholar]
- 23.Choi C, Bhardwaj PP, Kalra S, Casault CA, Yasmin US, Allen PS, Coupland NJ. Measurement of GABA and contaminants in gray and white matter in human brain in vivo. Magn Reson Med. 2007;58:27–33. doi: 10.1002/mrm.21275. [DOI] [PubMed] [Google Scholar]
- 24.Terpstra M, Ugurbil K, Gruetter R. Direct in vivo measurement of human cerebral GABA concentration using MEGA-editing at 7 Tesla. Magn Reson Med. 2002;47:1009–1012. doi: 10.1002/mrm.10146. [DOI] [PubMed] [Google Scholar]
- 25.Duyn JH, Gillen J, Sobering G, van Zijl PC, Moonen CT. Multisection proton MR spectroscopic imaging of the brain. Radiology. 1993;188:277–282. doi: 10.1148/radiology.188.1.8511313. [DOI] [PubMed] [Google Scholar]
- 26.Golay X, Gillen J, van Zijl PC, Barker PB. Scan time reduction in proton magnetic resonance spectroscopic imaging of the human brain. Magn Reson Med. 2002;47:384–387. doi: 10.1002/mrm.10038. [DOI] [PubMed] [Google Scholar]
- 27.Zhu H, Ouwerkerk R, Barker PB. Dual-band water and lipid suppression for MR spectroscopic imaging at 3 Tesla. Magn Reson Med. 2010;63:1486–1492. doi: 10.1002/mrm.22324. [DOI] [PMC free article] [PubMed] [Google Scholar]
- 28.Schar M, Vonken EJ, Stuber M. Simultaneous B(0)- and B(1)+-map acquisition for fast localized shim, frequency, and RF power determination in the heart at 3 T. Magn Reson Med. 2010;63:419–426. doi: 10.1002/mrm.22234. [DOI] [PMC free article] [PubMed] [Google Scholar]
- 29.Zhang Y, Brady M, Smith S. Segmentation of brain MR images through a hidden Markov random field model and the expectation-maximization algorithm. IEEE Trans Med Imaging. 2001;20:45–57. doi: 10.1109/42.906424. [DOI] [PubMed] [Google Scholar]
- 30.Star-Lack J, Spielman D, Adalsteinsson E, Kurhanewicz J, Terris DJ, Vigneron DB. In vivo lactate editing with simultaneous detection of choline, creatine, NAA, and lipid singlets at 1. 5 T using PRESS excitation with applications to the study of brain and head and neck tumors. J Magn Reson. 1998;133:243–254. doi: 10.1006/jmre.1998.1458. [DOI] [PubMed] [Google Scholar]
- 31.Star-Lack J, Nelson SJ, Kurhanewicz J, Huang LR, Vigneron DB. Improved water and lipid suppression for 3D PRESS CSI using RF band selective inversion with gradient dephasing (BASING) Magn Reson Med. 1997;38:311–321. doi: 10.1002/mrm.1910380222. [DOI] [PubMed] [Google Scholar]
- 32.Waddell KW, Avison MJ, Joers JM, Gore JC. A practical guide to robust detection of GABA in human brain by J-difference spectroscopy at 3 T using a standard volume coil. Magn Reson Imaging. 2007;25:1032–1038. doi: 10.1016/j.mri.2006.11.026. [DOI] [PMC free article] [PubMed] [Google Scholar]
- 33.Barker PB, Hearshen DO, Boska MD. Single-voxel proton MRS of the human brain at 1.5T and 3. 0T. Magn Reson Med. 2001;45:765–769. doi: 10.1002/mrm.1104. [DOI] [PubMed] [Google Scholar]
- 34.Wiggins GC, Triantafyllou C, Potthast A, Reykowski A, Nittka M, Wald LL. 32-channel 3 Tesla receive-only phased-array head coil with soccer- ball element geometry. Magn Reson Med. 2006;56:216–223. doi: 10.1002/mrm.20925. [DOI] [PubMed] [Google Scholar]
- 35.Roemer PB, Edelstein WA, Hayes CE, Souza SP, Mueller OM. The NMR phased array. Magn Reson Med. 1990;16:192–225. doi: 10.1002/mrm.1910160203. [DOI] [PubMed] [Google Scholar]
- 36.Henry PG, Dautry C, Hantraye P, Bloch G. Brain GABA editing without macromolecule contamination. Magn Reson Med. 2001;45:517–520. doi: 10.1002/1522-2594(200103)45:3<517::aid-mrm1068>3.0.co;2-6. [DOI] [PubMed] [Google Scholar]
- 37.Stagg CJ, Wylezinska M, Matthews PM, Johansen-Berg H, Jezzard P, Rothwell JC, Bestmann S. Neurochemical effects of theta burst stimulation as assessed by magnetic resonance spectroscopy. J Neurophysiol. 2009;101:2872–2877. doi: 10.1152/jn.91060.2008. [DOI] [PMC free article] [PubMed] [Google Scholar]
- 38.Provencher SW. Estimation of metabolite concentrations from localized in vivo proton MR spectra. Magn Reson Med. 1993;30:672–679. doi: 10.1002/mrm.1910300604. [DOI] [PubMed] [Google Scholar]