

Abstract
Background
Mammographic density (MD) is a strong marker of breast cancer risk, but it is unclear whether tumours arise specifically within dense tissue.
Methods
In 231 British women diagnosed with breast cancer after at least one negative screen during a mammographic screening trial, we assessed whether tumour location was related to localised MD 5 years prior to diagnosis. Radiologists identified tumour locations on digitized diagnostic films and used a validated algorithm to align serial images from the same woman to locate the corresponding point on the pre-diagnostic film. A virtual 1cm-square grid was overlaid on pre-diagnostic films and MD calculated for each square within a woman’s breast (mean=271 squares/film). Conditional logistic regression, matching on a woman’s breast, was used to estimate the odds of a tumour arising in a square in relation to its pre-diagnostic square-specific MD.
Results
Median (inter-quartile range) pre-diagnostic MD was 98.2% (46.8%-100%) in 1cm-squares that subsequently contained the tumour and 41.0% (31.5%-53.9%) for the whole-breast. The odds of a tumour arising in a 1cm-square were, respectively, 6.1 (95%CI: 1.9, 20.1), 16.6 (5.2, 53.2) and 25.5-fold (8.1, 80.3) higher for squares in the 2nd, 3rd and 4th quartiles of pre-diagnostic MD relative to those in the lowest quartile within that breast (Ptrend<0.001). The corresponding odds were 2.3 (1.3, 4.0), 3.9 (2.3, 6.4) and 4.6 (2.8, 7.6) if a 3cm-square grid was used.
Conclusion
Tumours arise predominantly within the radiodense breast tissue.
Impact
Localised MD may be used as a predictor of subsequent tumour location within the breast.
Keywords: breast density, mammography, breast cancer, early detection, screening
Introduction
Mammographic density (MD), which reflects the amount of radiodense fibroglandular tissue in the breast, is one of the strongest known markers of susceptibility to breast cancer. High MD (i.e dense tissue occupying >75% of the breast) is associated with a 4-6 fold increased breast cancer risk relative to women with little density (<5%) (1-2), with a third of breast cancers in high-risk populations being attributable to MDs over 50% (2-3). Although high MD is associated with a greater subsequent breast cancer risk, it is not known whether MD is directly related to risk, with tumours arising within the radiodense tissue itself, or simply a marker of susceptibility, that is both MD and breast cancer risk have common determinants (e.g. parity) but MD is not an intermediate factor between such determinants and cancer. Reductions in MD have been shown to be associated with reduced breast cancer risk, although not consistently (4-6). Clarification of whether MD is directly related to risk, or simply a correlate of its determinants, will enhance our understanding of the pathogenesis of breast cancer and will provide information on the value of using localized MD as a predictor of subsequent tumour location, possibly opening up new avenues for the clinical management of high-risk women.
Two previous studies have assessed whether tumours develop within radiodense areas of the breast, but produced conflicting findings (7-8). Using diagnostic films of 22 patients with a solitary ductal carcinoma in situ (DCIS), Ursin et al. concluded that 21 of 22 tumours were located within dense tissue (7). However, temporality could not be established and thus the results might have arisen from dense tissue being more likely to undergo carcinogenic transformation or from proliferation of the dense stromal tissue as a consequence of developing tumour. Vachon et al. examined pre-diagnostic mammograms of 350 breast cancer cases (invasive and DCIS) and, in contrast, found no association between the breast quadrant with highest density either 3 or 7 years prior to diagnosis and the quadrant location of the subsequent tumour (8). Both studies relied on a quadrant approach to examining localized breast density. Densities can be either diffuse or focal in nature (9), thus, using too large a region, such as a quadrant, might not yield an accurate measure of density in the specific area where the tumour arises.
The present study aims to determine whether, in women who subsequently develop breast cancer, localised dense areas of the breast several years prior to diagnosis were at a greater risk of being the location of the subsequent tumour than less dense areas within that same breast. To achieve this we used a novel approach (10) to align a woman’s pre-diagnostic and diagnostic mammograms and measure localized MD for much smaller areas than previously (e.g. 1cm2 squares) in mammograms taken several years prior to cancer diagnosis.
Material and Methods
Study population
The study was conducted within the Age Trial, a British trial of annual mammographic screening (11). Women randomized to the intervention arm (~54,000) between 1991 and 1997 were offered annual breast screening from age 39-41 to age 48 years. From age 50 onwards, they were invited for screening every 3-years as part of the UK National Health Service (NHS) Breast Screening Programme (BSP). Screening in the trial was by two-view x-ray mammography, cranio-caudal (CC) and medio-lateral oblique (MLO) views, at the first screen and by MLO view thereafter. Women were followed up through the BSP and the NHS Central Register to ascertain cancer incidence. Participants in the present study were women in the intervention arm of the trial who were diagnosed with breast cancer before 31st December 2007 after having undergone at least one negative screening round. The study was approved by the UK South East Research Ethics Committee. Participants provided written informed consent.
Tumour location on diagnostic films
Diagnostic and pre-diagnostic mammograms were retrieved from screening centres and hospitals and digitized on an Array 2905 laser digitizer (optical density 0-4.0, 12-bit resolution, pixel length 50 μm) (Array Corporation Europe, Roden, The Netherlands). On the digitized diagnostic MLO image displayed on a normal computer screen in a darkened room, the tumour location was marked by one of two radiologists (CR, LW) (Figure 1A), with a randomly selected 6% independently marked by both radiologists twice. Histology, pathology and radiology reports, available for all but two cases, were provided. Within-radiologist mean distance (95% confidence interval (CI)) between tumour points independently marked were 1·04 (0·52-2·08) mm and 1·71 (1·44-2·03) mm for the two radiologists. The median (inter-quartile range, IQR) between-radiologist difference between tumour points was 1.73 (1·52-7·70) mm.
Figure 1.
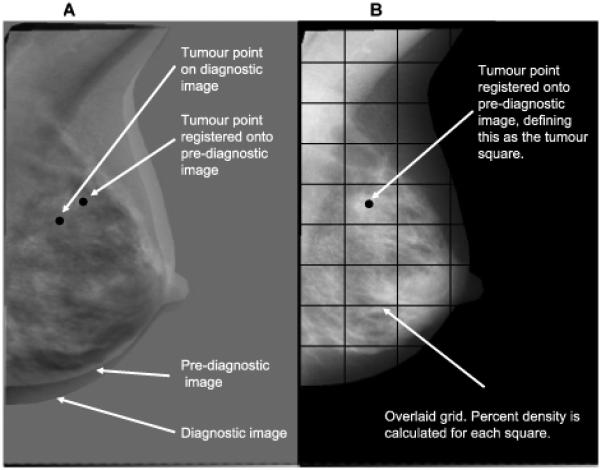
Image registration and tumour location: (A) Diagnostic and pre-diagnostic images overlaid on each other, with tumour point identified on diagnostic image; (B) Pre-diagnostic image with registered tumour point located on it and overlaid square grid.
Identification of the point on pre-diagnostic films where the tumour originated
The MLO film five years prior to diagnosis, or nearest to this date, was selected throughout. The point on the pre-diagnostic film (of the same breast) that corresponded to the identified tumour location point was found using an automated affine registration method to align serial (time-separated) mammograms from the same woman. This point on the pre-diagnostic image was treated as the point at which the subsequent lesion develops (Figure 1B). Variations in the imaging process (e.g. positioning, degree of breast compression) cause the breast to appear at different positions in serial mammograms (Figure 1A). We had previously optimised three intensity-based automated registration methods - affine, fluid and free-form deformation - specifically to provide accurate alignment of serial x-ray mammograms. We evaluated the accuracy of these optimised registration algorithms against five film-readers who independently identified landmarks (i.e. tumour and normal features such as nipples and ligaments) on 52 pairs of diagnostic and corresponding pre-diagnostic digitized images. Registration errors for each one of the three algorithms were calculated as the distance between the registered point (i.e. the film-reader’s feature location on the diagnostic image transformed onto the pre-diagnostic image) and the corresponding feature location on the pre-diagnostic image identified by the film-readers, the latter taken as the “gold standard” (10). The affine method had the highest accuracy, similar to that between independent film-readers, with 80% of affine registration errors being <1cm and 100% being <2cm (10).
As the affine registration is an intensity-based method (i.e. an intensity defined similarity measure of corresponding pixels is maximised) we excluded a circle around the tumour centre on the diagnostic image to avoid the tumour being aligned to pre-diagnostic density tissue thus creating a biased positive association. The circle’s diameter was the tumour size from the pathological report, if available (n=129, 56%), or diameters of 18mm (if only an invasive component was present) or 20mm (otherwise) (Table 1).
Table 1.
Pre-diagnostic mammographic measures and tumour characteristics among women with breast cancer (n=231)
| Pre-diagnostic mammographic measures | Mean (SD) | |
|---|---|---|
| Age at screen (years) | 42.5 (2.3) | |
| Whole breast | Breast Area (cm2) | 140.4 (51.7) |
| Dense Area (cm2) | 56.4 (25.1) | |
| Percent MD (%) | 42.4 (16.3) | |
| Square-specific (1 cm) |
No. of squares per film | 271 (81) |
| Tumour Characteristics | N (%) | |
|---|---|---|
| Age at diagnosis (years, mean (SD)) | 46.8 (3.1) | |
| Laterality | Left | 116 (50.2) |
| Grade a | 1 | 39 (22.0) |
| 2 | 80 (45.2) | |
| 3 | 58 (32.8) | |
| Whole Tumour diameter (mm, n=129) | 18 (13, 27) b | |
| Non-invasive component present c | 172 (76.2) | |
| of which: | Ductal carcinoma in-situ | 159 (92.4) |
| Lobular carcinoma in-situ | 18 (10.5) | |
| Other in-situ | 1 (0.6) | |
| Maximum diameter (mm, n=42) | 19 (12, 25) b | |
| Invasive component present | 182 (78.8) | |
| of which: | Ductal | 149 (81.9) |
| Lobular | 28 (15.4) | |
| Tubular/cribiform | 14 (7.7) | |
| Medullary, mucoid, other | 7 (3.8) | |
| Maximum diameter (mm, n=164) | 18 (13, 27) b | |
MD = mammographic density
54 missing, percentage out of non-missing
Median (inter-quartile range)
No. of exclusively non-invasive lesions=43; no. of cancers with both invasive and non-invasive components=182; no. with missing information=6. Percentage out of non-missing
Whole-breast and square-specific density readings
MD readings were performed on the pre-diagnostic MLO films by a single reader (VM), blinded to subsequent tumour location, using the interactive threshold Cumulus method (12). This method dichotomizes pixels on a digitized mammogram according to their intensities into dense and non-dense using the threshold defined by the user, automatically estimating dense and total breast areas (in cm2) and their ratio (as percent MD). Thirty-five (9%) films were read twice, giving a high repeatability (intra-class correlation coefficient for percent MD 0·97; 95% CI 0·95-0·98). An investigation of these breast cancer cases and of controls randomly selected among breast cancer-free Age Trial participants - closely matched to each case on screening centre, date of birth (±1 year) and date of mammogram (±1 year) - showed a strong association between pre-diagnostic whole-breast percent MD and subsequent breast cancer risk (MD>75% was associated with a 6.6-fold (95% CI 2.1, 20.5) increase in risk relative to MD<25%).
A semi-automated method was specifically developed to overlay a square grid on the pre-diagnostic image such that the square containing the tumour location was centered on that point (Figure 1B). The co-ordinate points of the grid squares were then fed into the “mask” Access database sheet of Cumulus to generate a series of images from the same breast that sequentially showed each square of the breast, one at a time.Thereafter, using the same intensity threshold selected to determine whole-breast percent MD, we calculated the percent MD in each grid square, i.e. square-specific MD, using the Cumulus software. For the same grid size, percent MD in a given square is directly proportional to absolute dense area. A grid size with squares of 4cm length was initially used as affine registration errors are less than 2cm either side of the location identified by the film-readers (“gold standard”) (10). As this grid size minimised misclassification in identifying the tumour-square but reduced the accuracy of the localised MD measurements, we also estimated square-specific MD for grid sizes of 3, 2 and 1cm. Finally, we repeated MD measurements (whole-breast and square-specific) using a higher intensity threshold to capture a more-specific small area of extremely dense tissue. This was done to capture the highest concentration of dense tissue, mimicking what would be the largest thicknesses of dense tissue in a volumetric method. Whole-breast mean percent density (standard deviation, SD) 5-years prior to cancer diagnosis was 42.4% (16.3%) with the usual intensity threshold, but only 7.7% (4.6%) with the ‘extremely high dense’ one.
Statistical Methods
The study design lends itself to a matched case-control analysis, in which the matching set is a woman’s breast, the square in which the tumour is subsequently located is the “tumour-square”, and all other squares are “tumour-free squares”. Along the edge of the breast some squares were smaller than the defined grid size because any non-breast features located within them (e.g. pectoral muscle) were masked and excluded. Thus, only tumour-free squares whose areas were within 10% of the tumour-square area were included. If no tumour-free squares were within this size range, the case-control set was excluded (n=3 and n=8 for the 1 and 3 cm grids, respectively).
Conditional logistic regression was used to estimate the odds of a square later becoming the tumour-square versus remaining tumour-free in relation to the square-specific MD and within-breast quartiles of square-specific MD. The analysis was repeated using pre-defined categories of square-specific MD (i.e. <10%, 10-29%, 30-79% and ≥80%). As analyses were matched on the woman’s breast, woman-level variables (e.g. age) did not vary within a set/breast so could not, as a main effect, influence the outcome within a woman. Effect modification by these variables was, however, examined.
Results
Radiologists viewed diagnostic films for 284 breast cancer cases and were able to identify a tumour on 236 (83%). This analysis comprised 231 cases (five were excluded because of different sized pre-diagnostic/diagnostic films) diagnosed during 1994-2007. Characteristics of the participants’ pre-diagnostic films, and of their tumours, are shown in Table 1. By design the pre-diagnostic images were taken, on average, five years (median=4·9, IQR=3·4-5·1) prior to diagnosis. A similar number of tumours occurred in the left and right breasts (Table 1), most located in the upper region.
Pre-diagnostic mean percent MD was 42·4% (SD=16·3%) for the whole-breast. In contrast, pre-diagnostic mean percent MD for the tumour-square was 73·8% (SD=36·2%, highly skewed (median=98·2%, IQR=46·8%-100%)) using a 1cm grid and 68.5% (SD=31.4, (median=78.1%, IQR=47.3%-96.8%)) for a 3cm grid. The higher average percent MD in tumour-squares compared to the whole-breast is illustrated in Figure 2A for a 1cm grid, where most points lie above the equality line; many tumour-squares were entirely dense, with 64% having MD>80%, such that the distribution of MD in tumour-squares was entirely shifted upwards with little overlap with the distribution of whole-breast MD (Figure 2B). The distribution of percentiles of within-woman square-specific MD for tumour-squares was right skewed. In 25% of women, density of the tumour-square for the smallest grid size (1cm) was, pre-diagnostically, within the top 10% of most dense squares, while in 75% of women, the tumour-square was within the top 35% of most dense squares. The corresponding figures for the other grid sizes were of a similar magnitude (e.g. respectively, within the top 9% and top 32% for a 3cm grid).
Figure 2.


Whole-breast versus tumour square-specific mammographic density (MD) in pre-diagnostic images: (A) Tumour square-specific percent density plotted against the corresponding whole-breast density for the same breast (the straight line represents the line of equality); (B) Relative distribution of whole-breast and tumour-square density values among all study participants.
There was a dose-response relationship between the within-woman square-specific MD quartile and the odds of that square being the location of the subsequent tumour (Figure 3, Table 2). For the smallest grid size (1 cm), 57% of squares that were to become tumour-squares had MD in the top quartile of the within-breast MD distribution; only 15% had MD in the bottom half (Table 2). Correspondingly, the odds (95% CI) of a tumour being located within a given square were, respectively, 6·1 (1·9-20·1), 16·6 (5·2-53·2) and 25·5 (8·1-80·3) times higher in squares in the 2nd, 3rd and 4th quartiles of within-breast MD distributions relative to those in the lowest quartile (Table 2). The magnitude of the association was strongest for the 1cm grid, albeit with wider CIs due to very few tumours arising in the reference (lowest density) category, and was attenuated for larger grid sizes (Figure 3, Table 2). Taking the more stable highest quartile as the reference category yielded ORs of breast cancer in the 3rd, 2nd and 1st quartiles of 0·65 (0·47-0·90), 0·24 (0·16-0·36) and 0·04 (0·01-0·12), respectively, for a 1cm grid. Alternatively, for the pre-defined categories of square-specific MD, ORs were 2·35 (1·18-4·65), 5·00 (3·01-8·31) and 9·28 (5·88-14·65) for percent MD of 10-29%, 30-79% and ≥80% relative to <10%.
Figure 3.
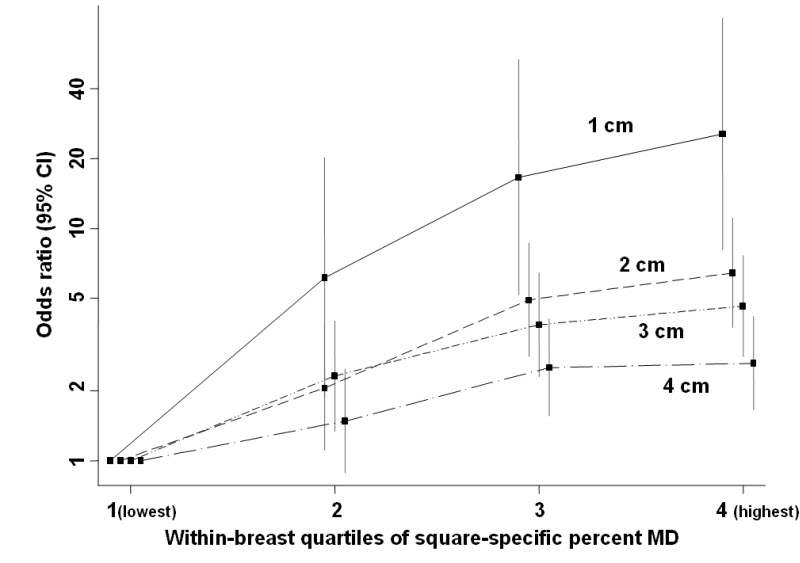
Odds of a tumour developing in a given square in relation to its pre-diagnostic square-specific mammographic density (MD), by grid length.
Table 2.
Odds of a square becoming the location of a subsequent breast tumour in relation to its percent mammographic density 5 years prior to diagnosis
| Grid length (cm) |
Within-breast quartiles of square-specific percent MD |
No. of squares in which tumour arises a |
OR (95% CI) b |
|---|---|---|---|
| 4 | 1 (lowest) | 26 | 1 |
| 2 | 48 | 1.5 (0.9, 2.5) | |
| 3 | 66 | 2.5 (1.6, 4.1) | |
| 4 (highest) | 74 | 2.6 (1.6, 4.2) | |
| P for linear trend < 0.001 | |||
| 3 | 1 (lowest) | 19 | 1 |
| 2 | 44 | 2.3 (1.3, 4.0) | |
| 3 | 69 | 3.9 (2.3, 6.4) | |
| 4 (highest) | 91 | 4.6 (2.8, 7.6) | |
| P for linear trend < 0.001 | |||
| 2 | 1 (lowest) | 15 | 1 |
| 2 | 32 | 2.1 (1.1, 3.8) | |
| 3 | 71 | 4.9 (2.8, 8.6) | |
| 4 (highest) | 111 | 6.4 (3.7, 11.1) | |
| P for linear trend < 0.001 | |||
| 1 | 1 (lowest) | 3 | 1 |
| 2 | 32 | 6.1 (1.9, 20.1) | |
| 3 | 63 | 16.6 (5.2, 53.2) | |
| 4 (highest) | 130 | 25.5 (8.1, 80.3) | |
| P for linear trend < 0.001 |
MD=mammographic density
The total number is less than 231 because tumour-squares for which no control squares of similar size (i.e. within 10%) could be identified were excluded (see Methods section).
Odds ratio (OR) and 95% confidence interval (CI) estimated using a conditional logistic regression model where the matching set is a woman’s pre-diagnostic breast consisting of a square where the tumour will subsequently originate (tumour-square) and several tumour-free squares (control-squares) (see Methods section).
The association between within-woman square-specific MD quartiles and subsequent tumour location was not modified by pre-diagnostic whole-breast MD (0%−, 20%−, 40%− and 60%+), time between pre-diagnostic film and cancer diagnosis (<5 and ≥5 years), or the nature (exclusively non-invasive vs. invasive/non-invasive), grade (1/2 vs. 3) and size (<20mm vs. ≥20mm) of the tumour (P for interaction: ≥0·12 in all for a 3cm grid; P≥0·28 in all for a 1cm grid).
Using the “extremely high dense” threshold, ORs (95% CI) were 1, 1·2 (0·5-3·0), 1·7 (1·0-2·8) and 4·7 (3·5-6·3) for percent of extremely high density in the square being <2·5% (reference category), 2·5-4·9%, 5·0-19·9% and ≥20·0%, respectively. 36% of tumour-squares, but only 1·7% whole-breasts, had squares with ≥20% extremely high density.
Discussion
This study demonstrates that breast tumours arise predominantly within pre-diagnostic radiodense tissue. The probability of an area subsequently developing into a tumour increased as the amount of radiodense tissue in that area increased, strongly suggesting that it is specifically concentrations of radiodense fibroglandular tissue that are at risk of undergoing malignant transformation.
Strengths and limitations
Previous studies (7-8) assessed whether tumours originated within the quadrant with the highest pre-diagnostic MD. Applying this approach to our data yielded a rather weak association (P=0·07) because 75% of our tumour-squares (regardless of grid length) had a higher density than the highest density quadrant. The use of a validated registration technique (10) to accurately align serial digitised mammograms is a major strength of our study because it allowed the measurement of localised MD at a much smaller level. The accuracy of the affine registration is somewhat lower for images with little density (10), but it is unlikely that this affected substantially our findings because practically all pre-diagnostic images had some density (5th percentile of pre-diagnostic whole-breast MD: 16·8%) and the magnitude of the association between square-specific MD and tumour location did not vary according to pre-diagnostic whole-breast MD level.
Radiologists were unable to identify the tumour on the diagnostic films for 17% of cases, mainly because their breasts were dense. This, coupled with the fact that these cases had higher pre-diagnostic whole-breast MD than those included in the study (mean difference 7·8%, 95% CI 2·6%-13·0%), provides further indirect support to the hypothesis that tumours arise predominantly within pre-diagnostic dense tissue. As density, and its spatial distribution within the breast, change with age, it would be informative to assess images taken further back in time. The participants were mainly pre-menopausal at diagnosis. Replication of the findings in post-menopausal women of screening ages is particularly relevant as overall MD is lower, hence, small amounts of radiodense tissue would be identified as at-risk.
The density measurements had a high reliability, and were performed blindly to subsequent tumour location, but the interpretation of the findings is constrained by the two-dimensional nature of the interactive threshold method. Three-dimensional imaging methods (e.g. magnetic resonance imaging (MRI), breast tomosynthesis) (13-14) will provide a better assessment of the value of localised density as a predictor of subsequent tumour location, but they will need to be modified to incorporate quantification of whole-breast and localised amounts of fibroglandular tissue.
Relevance of the findings
The significance of the findings is twofold. First, they suggest that MD is directly involved in the pathogenesis of breast cancer. Second, the findings provide new avenues for the clinical management of women with high MD.
The biological basis for the MD-breast cancer association is not well characterised. Our findings suggest that high MD is likely to be causally related to breast cancer rather than a simple correlate of its determinants. Breast cancer arises from epithelial cells lining the ducts or lobules of the breast. The higher the number of these cells the higher the amount of radiodense tissue and the likelihood that they may undergo a malignant transformation, consistent with the observation that high MD is associated with increased risk of both invasive cancer and proliferative lesions thought to be precursors of breast cancer (e.g. ductal carcinoma in situ, hyperplasia with or without atypia, and columnar cell lesions) (15-16). Thus, MD may reflect higher rates of epithelial proliferation, which are likely to increase the risk of somatic mutations, epigenetic alterations and carcinogenesis, and/or slower rates of involution (17-19). 15% of tumours arose within areas of the breast that were in the lower half of that breast’s square-density distribution. This is consistent with the observation that breast cancer risk is lower, but not non-existent, in women with entirely fatty breast (1). These tumours may have arisen within the dense tissue of tumour-squares that were not entirely fatty or through MD-unrelated pathways.
Current breast cancer risk assessment models do not incorporate MD (20), although the addition of this variable may increase slightly their discriminatory power (21-22), MD is more strongly associated with breast cancer risk than any of the variables included in the Gail’s model (23), the most widely used risk-prediction model, and unlike most of these variables MD may be modified by hormone interventions (e.g. tamoxifen (24)). If MD is causally related to breast cancer, as strongly implied by our findings, factors that reduce within-woman MD are likely to lower risk and improve detection of early lesions by increasing the sensitivity of mammography.
Whole-breast MD, along with other independent risk factors, allows identification of women at high breast cancer risk. Once a woman is considered as high-risk, our findings imply that examination of localised MD may provide information on the likely location of a subsequent tumour within a breast. The ability to identify, within a specific breast, the tissue that is at increased risk may open up the possibility of more localized approaches for the management of high-risk women - e.g. localized dense tissue excision, localized preventive chemotherapy, targeted radiotherapy could be explored in future studies, as in the present case-only study specificity could not be assessed. Cancer detection (including computer-assisted systems) could focus more on localised patterns of density and their between-screen changes. Under current UK guidelines (25), a woman with a predicted risk >8% from age 40 to 49 years or a lifetime risk >30% should be offered tertiary care, including additional MRI screening and consideration of risk-reduction surgery (i.e. prophylactic mastectomy and/or oophorectomy). Prophylactic mastectomy reduces breast cancer risk by 90-100% (26-27), but is the least acceptable option (27). Intensive screening yields frequent false positives, overdiagnosis and overtreatment (28). No randomised trials have compared the benefits from these various strategies, and it is unlikely that such trials will ever be possible as patients, and their clinicians, are unlikely to accept random assignment between prophylactic surgery and intensive screening. Our findings among breast cancer cases need to be replicated in follow-up studies of high-risk women undergoing repeat-screen mammography, but if confirmed, they could lead to the development and evaluation of new localized approaches as alternatives to prophylactic mastectomy or intensive screening.
Conclusions
Whole-breast density is a well established risk factor for breast cancer. This study goes a step further by clearly demonstrating that tumours arise predominantly within localised (1cm2 squares) areas that were radiodense several years prior to diagnosis.
Acknowledgments
Grant support
This work was supported by Cancer Research UK (grant numbers SP2315/0201, C150/A5660); and Breast Cancer Campaign (grant number 2007MayPR23). S. M. Pinto Pereira was funded by a GraduateTeaching Assistant scholarship from the London School of Hygiene and Tropical Medicine.
References
- 1.McCormack VA, dos Santos Silva I. Breast density and parenchymal patterns as markers of breast cancer risk: a meta-analysis. Cancer Epidemiol Biomarkers Prev. 2006;15:1159–69. doi: 10.1158/1055-9965.EPI-06-0034. [DOI] [PubMed] [Google Scholar]
- 2.Boyd NF, Guo H, Martin LJ, Sun L, Stone J, Fishell E, et al. Mammographic density and the risk and detection of breast cancer. N Engl J Med. 2007;356:227–36. doi: 10.1056/NEJMoa062790. [DOI] [PubMed] [Google Scholar]
- 3.Byrne C, Schairer C, Wolfe J, Parekh N, Salane M, Brinton LA, et al. Mammographic features and breast cancer risk: effects with time, age, and menopause status. J Natl Cancer Inst. 1995;87:1622–9. doi: 10.1093/jnci/87.21.1622. [DOI] [PubMed] [Google Scholar]
- 4.Vachon CM, Pankratz VS, Scott CG, Maloney SD, Ghosh K, Brandt KR, et al. Longitudinal trends in mammographic percent density and breast cancer risk. Cancer Epidemiol Biomarkers Prev. 2007;16:921–8. doi: 10.1158/1055-9965.EPI-06-1047. [DOI] [PubMed] [Google Scholar]
- 5.Kerlikowske K, Ichikawa L, Miglioretti DL, Buist DS, Vacek PM, Smith-Bindman R, et al. Longitudinal measurement of clinical mammographic breast density to improve estimation of breast cancer risk. J Natl Cancer Inst. 2007;99:386–95. doi: 10.1093/jnci/djk066. [DOI] [PubMed] [Google Scholar]
- 6.van Gils CH, Hendriks JH, Holland R, Karssemeijer N, Otten JD, Straatman H, et al. Changes in mammographic breast density and concomitant changes in breast cancer risk. Eur J Cancer Prev. 1999;8:509–15. doi: 10.1097/00008469-199912000-00006. [DOI] [PubMed] [Google Scholar]
- 7.Ursin G, Hovanessian-Larsen L, Parisky YR, Pike MC, Wu AH. Greatly increased occurrence of breast cancers in areas of mammographically dense tissue. Breast Cancer Res. 2005;7:R605–8. doi: 10.1186/bcr1260. [DOI] [PMC free article] [PubMed] [Google Scholar]
- 8.Vachon CM, Brandt KR, Ghosh K, Scott CG, Maloney SD, Carston MJ, et al. Mammographic breast density as a general marker of breast cancer risk. Cancer Epidemiol Biomarkers Prev. 2007;16:43–9. doi: 10.1158/1055-9965.EPI-06-0738. [DOI] [PubMed] [Google Scholar]
- 9.Pinto Pereira SM, McCormack VA, Moss SM, dos Santos Silva I. The spatial distribution of radiodense breast tissue: a longitudinal study. Breast Cancer Res. 2009;11:R33. doi: 10.1186/bcr2318. [DOI] [PMC free article] [PubMed] [Google Scholar]
- 10.Pinto Pereira SM, Hipwell JH, McCormack VA, Tanner C, Moss SM, Wilkinson LS, et al. Automated registration of diagnostic to prediagnostic x-ray mammograms: evaluation and comparison to radiologists’ accuracy. Med Phys. 2010;37:4530–9. doi: 10.1118/1.3457470. [DOI] [PubMed] [Google Scholar]
- 11.Moss SM, Cuckle H, Evans A, Johns L, Waller M, Bobrow L. Effect of mammographic screening from age 40 years on breast cancer mortality at 10 years’ follow-up: a randomised controlled trial. Lancet. 2006;368:2053–60. doi: 10.1016/S0140-6736(06)69834-6. [DOI] [PubMed] [Google Scholar]
- 12.Byng JW, Boyd NF, Fishell E, Jong RA, Yaffe MJ. The quantitative analysis of mammographic densities. Phys Med Biol. 1994;39:1629–38. doi: 10.1088/0031-9155/39/10/008. [DOI] [PubMed] [Google Scholar]
- 13.Boyd NF, Martin LJ, Bronskill M, Yaffe MJ, Duric N, Minkin S. Breast tissue composition and susceptibility to breast cancer. J Natl Cancer Inst. 2010;102:1224–37. doi: 10.1093/jnci/djq239. [DOI] [PMC free article] [PubMed] [Google Scholar]
- 14.Digital Breast Tomosynthesis Working Party Digital Breast Tomosynthesis. UK National Health Service Breast Screening Programme. NHS Cancer Screening Programmes. 2010 Publication No 69. ISBN 978-1-84463-071-4. ( http://www.cancerscreening.nhs.uk/breastscreen/publications/nhsbsp69.html)
- 15.Gill JK, Maskarinec G, Pagano I, Kolonel LN. The association of mammographic density with ductal carcinoma in situ of the breast: the Multiethnic Cohort. Breast Cancer Res. 2006;8:R30. doi: 10.1186/bcr1507. [DOI] [PMC free article] [PubMed] [Google Scholar]
- 16.Turashvili G, McKinney S, Martin L, Gelmon KA, Watson P, Boyd N, et al. Columnar cell lesions, mammographic density and breast cancer risk. Breast Cancer Res Treat. 2009;115:561–71. doi: 10.1007/s10549-008-0099-x. [DOI] [PubMed] [Google Scholar]
- 17.Ghosh K, Vachon CM, Pankratz VS, Vierkant RA, Anderson SS, Brandt KR, et al. Independent association of lobular involution and mammographic breast density with breast cancer risk. J Natl Cancer Inst. 2010;102:1716–23. doi: 10.1093/jnci/djq414. [DOI] [PMC free article] [PubMed] [Google Scholar]
- 18.Ginsburg OM, Martin LJ, Boyd NF. Mammographic density, lobular involution, and risk of breast cancer. Br J Cancer. 2008;99:1369–74. doi: 10.1038/sj.bjc.6604635. [DOI] [PMC free article] [PubMed] [Google Scholar]
- 19.Milanese TR, Hartmann LC, Sellers TA, Frost MH, Vierkant RA, Maloney SD, et al. Age-related lobular involution and risk of breast cancer. J Natl Cancer Inst. 2006;98:1600–7. doi: 10.1093/jnci/djj439. [DOI] [PubMed] [Google Scholar]
- 20.Amir E, Freedman OC, Seruga B, Evans DG. Assessing women at high risk of breast cancer: a review of risk assessment models. J Natl Cancer Inst. 2010;102:680–91. doi: 10.1093/jnci/djq088. [DOI] [PubMed] [Google Scholar]
- 21.Chen J, Pee D, Ayyagari R, Graubard B, Schairer C, Byrne C, et al. Projecting absolute invasive breast cancer risk in white women with a model that includes mammographic density. J Natl Cancer Inst. 2006;98:1215–26. doi: 10.1093/jnci/djj332. [DOI] [PubMed] [Google Scholar]
- 22.Santen RJ, Boyd NF, Chlebowski RT, Cummings S, Cuzick J, Dowsett M, et al. Critical assessment of new risk factors for breast cancer: considerations for development of an improved risk prediction model. Endocr Relat Cancer. 2007;14:169–87. doi: 10.1677/ERC-06-0045. [DOI] [PubMed] [Google Scholar]
- 23.Gail MH, Brinton LA, Byar DP, Corle DK, Green SB, Schairer C, et al. Projecting individualized probabilities of developing breast cancer for white females who are being examined annually. J Natl Cancer Inst. 1989;81:1879–86. doi: 10.1093/jnci/81.24.1879. [DOI] [PubMed] [Google Scholar]
- 24.Cuzick J, Warwick J, Pinney E, Warren RM, Duffy SW. Tamoxifen and breast density in women at increased risk of breast cancer. J Natl Cancer Inst. 2004;96:621–8. doi: 10.1093/jnci/djh106. [DOI] [PubMed] [Google Scholar]
- 25.National Collaborating Centre for Primary Care. NHS National Institute for Health and Clinical Excellence (NICE) Familial Breast Cancer. The Classification and Care of Women at Risk of Familial Breast Cancer in Primary, Secondary and Tertiary Care. NICE: 2006. (Nice Clinical Guideline 41). ( http://www.cancerscreening.nhs.uk/breastscreen/publications/nhsbsp69.html) [Google Scholar]
- 26.Hartmann LC, Sellers TA, Schaid DJ, Frank TS, Soderberg CL, Sitta DL, et al. Efficacy of bilateral prophylactic mastectomy in BRCA1 and BRCA2 gene mutation carriers. J Natl Cancer Inst. 2001;93:1633–7. doi: 10.1093/jnci/93.21.1633. [DOI] [PubMed] [Google Scholar]
- 27.Lostumbo L, Carbine NE, Wallace J. Prophylactic mastectomy for the prevention of breast cancer. Cochrane Database Syst Rev. 2010;11:CD002748. doi: 10.1002/14651858.CD002748.pub3. [DOI] [PubMed] [Google Scholar]
- 28.Leach MO, Boggis CR, Dixon AK, Easton DF, Eeles RA, Evans DG, et al. Screening with magnetic resonance imaging and mammography of a UK population at high familial risk of breast cancer: a prospective multicentre cohort study (MARIBS) Lancet. 2005;365:1769–78. doi: 10.1016/S0140-6736(05)66481-1. [DOI] [PubMed] [Google Scholar]