Abstract
Dietary K+ intake may increase renal K+ excretion via increasing plasma [K+] and/or activating a mechanism independent of plasma [K+]. We evaluated these mechanisms during normal dietary K+ intake. After an overnight fast, [K+] and renal K+ excretion were measured in rats fed either 0% K+ or the normal 1% K+ diet. In a third group, rats were fed with the 0% K+ diet, and KCl was infused to match plasma [K+] profile to that of the 1% K+ diet group. The 1% K+ feeding significantly increased renal K+ excretion, associated with slight increases in plasma [K+], whereas the 0% K+ diet decreased K+ excretion, associated with decreases in plasma [K+]. In the KCl-infused 0% K+ diet group, renal K+ excretion was significantly less than that of the 1% K+ group, despite matched plasma [K+] profiles. We also examined whether dietary K+ alters plasma profiles of gut peptides, such as guanylin, uroguanylin, glucagon-like peptide 1, and glucose-dependent insulinotropic polypeptide, pituitary peptides, such as AVP, α-MSH, and γ-MSH, or aldosterone. Our data do not support a role for these hormones in the stimulation of renal K+ excretion during normal K+ intake. In conclusion, postprandial increases in renal K+ excretion cannot be fully accounted for by changes in plasma [K+] and that gut sensing of dietary K+ is an important component of the regulation of renal K+ excretion. Our studies on gut and pituitary peptide hormones suggest that there may be previously unknown humoral factors that stimulate renal K+ excretion during dietary K+ intake.
Keywords: feedback control, feedforward control, potassium sensing, potassium excretion, incretin, brain
extracellular k+ concentration ([K+]) is tightly regulated in mammals, as this is critical for normal membrane potentials and cell function (2, 14). Extracellular K+ homeostasis depends on the maintenance of total body K+ content and distribution of K+ between intracellular and extracellular spaces. Total body K+ content is maintained by a continuous balance between dietary intake and excretion of K+. The kidneys are responsible for ∼90% of K+ excretion and have a remarkable capacity to regulate K+ excretion to match K+ intake (2, 29). Thus, the kidneys play a predominant role in the maintenance of chronic K+ balance. In addition, extrarenal tissues, mainly skeletal muscle and liver, provide K+ buffering capacity by shifting K+ between intracellular and extracellular spaces, which is critically important in the acute regulation of extracellular K+ after a meal (2, 14, 18).
According to the traditional view, extracellular [K+] is the major stimulus driving renal K+ excretion (10, 11). Extracellular [K+] increases during dietary K+ intake, and this increase then stimulates renal K+ excretion by increasing K+ secretion in the collecting duct directly (11, 30) and indirectly by stimulating aldosterone secretion (21, 22). Increased renal K+ excretion then normalizes extracellular [K+]. Thus, the maintenance of K+ homeostasis has been traditionally understood on the basis of the concept of negative feedback control. However, Rabinowitz (21, 22) challenged this traditional view when he pointed out that plasma K+ and aldosterone can stimulate renal K+ excretion only at levels above their normal ranges (3, 25, 31, 32). In his studies in the sheep (24), meal intake over 1 h produced a pronounced kaliuresis, which occurred in the absence of a change in plasma aldosterone concentration and with only a very small (0.5 meq/l) increase in plasma [K+]. The 0.5 meq/l rise in plasma K+, when reproduced by intravenous K+ infusion, was too small to account for the meal-induced kaliuresis (25), leading Rabinowitz to conclude that a kaliuretic reflex arising from sensors in the splanchnic bed (i.e., gut, portal circulation, and/or liver) induced the postprandial increases in renal K+ excretion rather than a rise in plasma aldosterone or plasma K+. According to the Rabinowitz proposal, renal K+ excretion is increased, without (or before) increases in extracellular [K+], by a mechanism controlled by sensing of K+ intake (i.e., sensing of local increase in [K+] in splanchnic areas during K+ intake). Thus, the concept of feedforward control of K+ homeostasis was proposed.
Feedforward control of K+ homeostasis was supported by our recent study (15) that examine the effects of K+ infusion into stomach vs. hepatic portal vein or a systemic vein on plasma [K+] and renal K+ excretion in rats. Our results indicated that the K+ infusions via these different routes resulted in similar profiles of plasma [K+] and renal K+ excretion in fasting states. However, during a simultaneous feeding with a K+-deficient diet, the route of K+ infusion had a dramatic effect on plasma [K+]: intraportal infusion resulted in increases in plasma [K+] similar to those with systemic K+ infusion, but intragastric K+ infusion did not significantly increase plasma [K+]. Thus, when the intragastric K+ infusion was combined with a meal, which is the normal situation of dietary K+ intake, there was marked enhancement of clearance of the K+ infused. These data suggest that there may be a gut, but not a hepatoportal, factor that enhances clearance of dietary K+ absorbed from the gut into the plasma during a meal.
After a meal, renal K+ excretion may be increased due to increasing plasma [K+] (classical view) and/or by activating a mechanism triggered by gut sensing of K+ intake (a “gut factor”). In the present study, we aimed to discriminate between these two potential mechanisms to stimulate renal K+ excretion after normal dietary K+ intake. In addition, we tested for the role of putative humoral factors that could mediate the gut factor effects, including gut peptides, such as glucagon-like peptide 1 (GLP-1), glucose-dependent insulinotropic polypeptide (GIP), guanylin, and uroguanylin, and pituitary peptides, such as AVP, α-MSH, γ-MSH, all of which have been implicated in the regulation of Na+ or K+ excretion or other kidney function (1, 8, 20, 23, 28).
METHODS
Animals.
All procedures involving animals were approved by the Institutional Animal Care and Use Committee at the University of Southern California. Male Wistar rats weighing 280–300 g were obtained from Simonsen (Gilroy, CA) and housed under controlled temperature (22 ± 2°C) and lighting (12-h light, 0600–1800; 12-h dark, 1800–0600) with free access to water and standard rat chow. At least 4 days before the experiment, the animals were placed in individual cages with tail restraints, as previously described (4, 5), which was required to protect tail blood-vessel catheters during the experiments. The animals were free to move about and were allowed unrestricted access to food and water. One tail-vein infusion catheter was placed the day before the experiment, and one tail-artery blood-sampling catheter was placed the morning of the experiment (∼0700).
Experimental protocols.
Study 1 examined the effects of dietary K+ on plasma [K+] and renal K+ excretion in conscious overnight-fasted rats. Food was removed at 1700 on the day before the experiment, and the experiments were started at 1000. Each experiment consisted of two periods: 2-h basal and 5-h postprandial periods. After the 2-h basal period, the animals were given either a K+-deficient (0% K+ diet; TD 88239; Harlan Teklad, Madison, WI) or normal 1% K+ (TD08267; Harlan Teklad) diet for 30 min. Three grams of food was provided in feeding cups, and all of the food was consumed during the 30-min feeding period, as 3 g is less than the ad libitum consumption after overnight fasting. A third group of animals were given 3 g 0% K+ diet, and 300 mM KCl solution was infused to match plasma [K+] to that of the 1% K+ diet group. K+ infusion profile was determined in pilot experiments. The rationale of this design was that, if dietary K+ increases renal K+ excretion exclusively by increasing plasma [K+], then increasing plasma [K+] in a profile matched to that with the 1% K+ diet by KCl infusion should increase renal K+ excretion to an extent similar to that of the 1% K+ diet group. Alternatively, if renal K+ excretion is significantly less than that of 1% K+ group, in spite of matched plasma [K+], then the results suggest an additional gut factor effect.
Blood samples were collected for determination of plasma [K+] at variable intervals during the 2-h basal and 5-h postprandial periods. Urinary K+ excretion was determined by collecting urine every hour throughout the experiment in cages with an aluminum tray below a wire floor. A mesh screen was placed below the wire floor above the aluminum tray to separate feces from urine passed. The tray was replaced every hour to collect urine passed. To obtain a constant flow of urine, animals were infused with a constant volume (4.1 ml/h) of fluid (saline or saline + KCl during K+ infusion) throughout the experiment (15). This infusion volume did not appear to affect K+ excretion, as the baseline K+ excretion rate was indistinguishable from the basal rate of K+ excretion measured in fasting rats without fluid infusion between 7 AM and 7 PM (data not shown). Each animal was used for only one experiment and killed by an overdose of pentobarbital sodium at the end of experiment.
Study 2 examined the effects of dietary K+ intake on plasma levels of gut peptides known to regulate renal function, including GLP-1, GIP, guanylin, and uroguanylin (1, 8, 20, 23, 28). We tested whether the plasma concentrations of any of these gut peptides changed in response to dietary K+ intake, a necessary condition for a role in the gut factor effects. We also examined the effects of dietary K+ intake on plasma levels of pituitary peptides, such as AVP, α-MSH, and γ-MSH, and aldosterone, which have been implicated in K+ homeostasis (23). Food was removed at 1700 on the day before the experiment. The following morning, the 0% and 1% K+ diets were given as in study 1, and blood samples were collected before (basal period) and after the feeding (5-h postprandial period). Blood samples were processed for the determination of plasma glucose, GLP-1, GIP, guanylin, uroguanylin, AVP, α-MSH, γ-MSH, aldosterone, [K+], and/or [Na+] as described under Assays below.
Study 3 examined whether kaliuretic humoral substances are present in the pituitary and whether their amounts are altered by dietary K+ intake. Pituitary extracts were prepared as described below from overnight fasted rats with or without feeding for 2 h with normal rat chow (1% K+ content). The pituitary extracts were infused for 1 min into overnight-fasted rats, and blood and urine samples were obtained before and after the infusion for the determination of [K+] and renal K+ excretion as in study 1.
Preparation of pituitary extracts.
Animals were killed by decapitation under anesthesia, and pituitaries were surgically dissected out. The pituitaries were homogenized in ice-cold saline (600 μl) using a Tekmar homogenizer (Cincinnati, OH) at 70% maximum speed (30 s, on ice), and the homogenates were centrifuged at 14,000 g for 30 min at 4°C. The supernatants (300 μl) were used as pituitary extracts in study 3.
Assays.
Plasma and urine K+ and Na+ levels were determined by flame photometry using a Radiometer FLM 3 flame photometer, as previously reported (4, 5). Plasma glucose was analyzed using a glucose oxidase method on a Beckman Glucose Analyzer II (Beckman, Fullerton, CA). Plasma levels of GIP (total) and GLP-1 (active) were determined using EIA kits from Linco Research (St. Charles, MO), according to the manufacturer's instructions. Plasma guanylin and uroguanylin levels were measured using a radioimmunoassay, as previously described (13). Plasma levels of AVP, α-MSH, and γ2-MSH were determined using EIA (γ2-MSH) or fluorescent EIA (AVP and α-MSH) kits from Phoenix Pharmaceuticals (Burlingame, CA), according to the manufacturer's instructions. Plasma aldosterone levels were measured using a EIA kit from ALPCO Diagnostics (Salem, NH).
Calculations.
Basal rate of urinary K+ excretion (UKV) was calculated by averaging the values determined hourly during the basal period. Increases in urinary K+ excretion (ΔUKV) after meals (or treatments) were calculated as the sum of urinary K+ excretions during postprandial (or posttreatment) periods minus (basal K+ excretion × postprandial or posttreatment period). Meal-induced increases in urinary Na+ excretion (ΔUNaV) or urine flow (ΔV) were similarly calculated.
Statistical analysis.
Data are expressed as means ± SE. The significance of differences between groups was assessed by Student's t-test or ANOVA (for multiple comparisons), followed by post hoc analysis using the Bonferroni's method. Differences were considered significant at P < 0.05.
RESULTS
Effects of dietary K+ intake on plasma [K+] and renal K+ excretion.
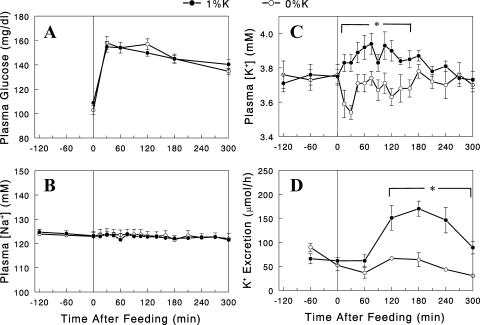
Male Wistar rats were fasted overnight and given either 3 g normal 1% K+ or K+-deficient diet, which was consumed over 30 min. Plasma glucose levels rose after the feeding similarly in the two diet groups (Fig. 1A), indicating similar postprandial conditions, as expected from the consumption of the same amount of diets with identical compositions (except for K+). Plasma [Na+] was changed neither by a meal nor by dietary K+ (Fig. 1B). In contrast, plasma [K+] was altered either by a meal or by dietary K+ content. Plasma [K+] fell ∼0.2 mM at 30 min in the group given K+-deficient (i.e., 0% K+) diet, presumably due to insulin's action to shift K+ from extracellular to intracellular space (6, 18), but eventually rebounded to the basal levels (Fig. 1C). In the group given the 1% K+ diet, plasma [K+] increased slightly during the initial 2 h. Overall, the difference between the two groups in postprandial plasma [K+] was small, less than 0.3 mM throughout the time course. Despite this small difference in plasma [K+], renal K+ excretion was substantially greater in the 1% K+ than the 0% K+ diet group (Fig. 1D; P < 0.05).
Fig. 1.
Plasma glucose (A), Na+ (B), and K+ (C) concentrations and renal K+ excretion (D) profiles during the 2-h basal (−120 to 0 min) and 5-h postprandial (0 to 300 min) periods in overnight-fasted rats given the 0% (○) or 1% (●) K+ diet. Data are expressed as means ± SE for 7 or 8 experiments. *P < 0.05 vs. 0% K+ diet.
Direct evidence for plasma [K+]-independent mechanism for stimulation of renal K+ excretion.
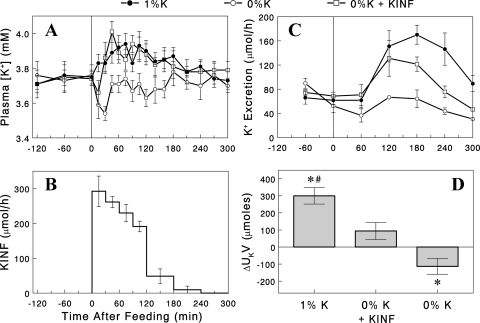
To determine whether the increase in plasma [K+] was entirely responsible for the difference in renal K+ excretion, a third group of rats received the 0% K+ diet, and the plasma [K+] profile was altered to match that of the 1% K+ group by variable K+ infusion via a tail vein cannula in conscious rats (Fig. 2, A and B). Despite well-matched plasma [K+], renal K+ excretion was significantly less during the final 3 h of the experiments in the 0% K+ + K+ infusion group, compared with the 1% K+ diet group (Fig. 2C). The net increase in K+ excretion above basal (ΔUkV) after the meal was significantly less in the 0% K+ + K+ infusion group compared with the 1% K+ group (P < 0.05; Fig. 2D). In fact, the ΔUkV in the 0% K+ + K+ infusion group was not significantly different from zero (i.e., no increase after the meal) (P > 0.05). The total amount of K+ infused was significantly less (i.e., 73 ± 5%; P < 0.05) than the amount of K+ ingested in the 1% K+ group, indicating less efficient clearance of plasma K+ in the 0% K+ group, consistent with lower renal K+ excretion rates. We conclude that a significant portion of the increase in renal K+ excretion after the 1% K+ diet was not driven by the accompanying rise in plasma [K+]. These data provide compelling evidence for the existence of a mechanism for stimulation of renal K+ excretion, independent of plasma [K+], activated by a K+-containing diet.
Fig. 2.
A: plasma [K+] profiles with the 1% (●) or 0% K+ diet with (□), or without (○) K+ infusion (KINF) to match plasma [K+] profile to that of the 1% K+ group. B: K+ infusion profile used. C: renal K+ excretion profiles in the three groups. D: increases in renal K+ excretion above basal rates. Data are expressed as means ± SE for 7 or 8 experiments. *P < 0.05 vs. zero (i.e., no increase); #P < 0.05 vs. the other groups.
Effects of dietary K+ intake on renal Na+ excretion and urine flow.
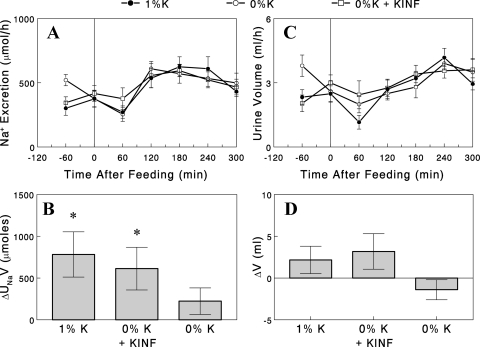
Renal Na+ excretion increased after the meal in all of the three groups, i.e., the 1% K+ diet, 0% K+ diet, and 0% K+ diet + K+ infusion groups (Fig. 3A). However, the net increase in Na+ excretion above basal (ΔUnaV) after the meal was statistically significant in the 1% K+ diet and the 0% K+ diet + K+ infusion groups, in which plasma [K+] increased after the meal, but not in the 0% K+ diet group, in which plasma [K+] fell (Fig. 3B). While these data may suggest a role of plasma [K+] in the regulation of renal Na+ excretion, the lack of increase in Na+ excretion in the 0% K+ diet group may be due to an overestimation of basal Na+ excretion, which was 20–30% greater than the other groups, as the postprandial profiles were very similar to those in the other groups. Urine flow was altered neither by the meal nor by dietary K+ (Fig. 3C); the net increase in urine flow above basal (ΔV) after the meal was not significantly different from zero (i.e., no increase) in all groups (Fig. 3D). It should be noted that in these experiments, saline was infused at a constant rate (4.1 ml/h) throughout the experiment, resulting in higher basal rates of Na+ excretion and urine flow than “true” basal rates, i.e., those without the saline infusion.
Fig. 3.
A: renal Na+ excretion profiles with the 1% (●) or 0% K+ diet with (□) or without (○) K+ infusion (KINF). B: increases in renal Na+ excretion above basal rates. C: urine flow in the three groups. D: increases in urine flow above basal rates. Data are expressed as means ± SE for 7 or 8 experiments. *P < 0.05 vs. zero (i.e., no increase).
Higher plasma [K+] is required to match renal K+ excretion with K+ infusion vs. dietary K+ intake.
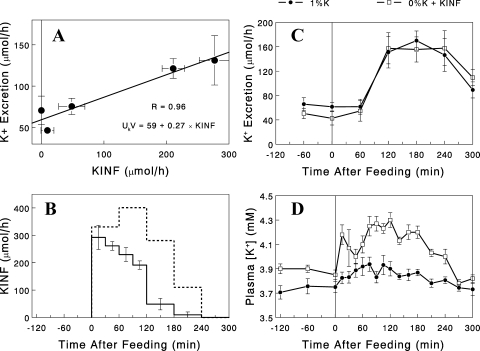
We next examined whether increasing K+ infusion rates after the 0% diet would increase renal K+ excretion rates to match those after the 1% diet. We found a linear relationship between K+ infusion rates and K+ excretion rates, measured 1 h later, in the 0% K+ + K+ infusion group (Fig. 4A). On the basis of this relationship, we built a K+ infusion profile, which was predicted to produce, after the 0% K+ diet, renal K+ excretion rates matching those with the 1% K+ diet (Fig. 4B). K+ infusion using this profile after the 0% K+ diet, indeed, produced K+ excretion rates similar to those seen after the 1% K+ diet (Fig. 4C). This occurred at the expense of 2–3 times greater increases in plasma [K+] (during 2nd and 3rd h; P < 0.05), compared with the 1% K+ group (Fig. 4D), consistent with less efficient clearance of plasma K+ by the kidneys with the 0% K+ diet.
Fig. 4.
A: linear relationship between KINF and renal K+ excretion (measured after 1 h) rates in rats fed the 0% K+ diet (data from Fig. 2, B and C). B: KINF profile (dashed line) predicted to produce renal K+ excretion rates matching those with the 1% K+ diet (Fig. 2C), compared with the profile used in the earlier experiment. C and D: renal K+ excretion and plasma [K+] profiles, respectively, in rats fed the 0% K+ diet and infused with K+, according to the new KINF profile (□), compared with the data with the 1% K+ diet (●; from Fig. 2, A and C). Data are expressed as means ± SE for 6–8 experiments.
Effect of amiloride infusion on kaliuretic response to dietary K+ intake.
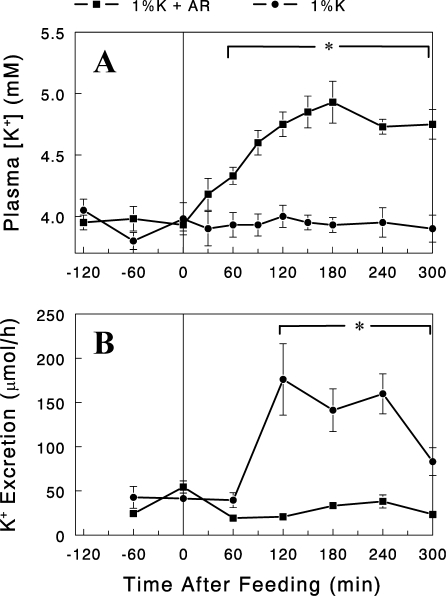
In the kidney K+ is filtered at the glomerulus, and the filtered K+ load is almost completely reabsorbed in the proximal nephron. Under normal or high K+ intake, K+ is secreted in the cortical collecting duct (CCD), accounting for the majority of excreted K+ (7). Epithelial sodium channel (ENaC) plays a major role in K+ excretion by producing a driving force for K+ secretion in the CCD. To gain insight into the intrarenal mechanism for the dietary K+-induced kaliuretic response, we examined the effect of the ENaC blocker amiloride on renal K+ excretion rates after the 1% K+ diet. An intravenous infusion of amiloride [2 nmol/min; (7)] completely abolished the kaliuretic response associated with the feeding of 1% K+ diet, resulting in significant increases in plasma [K+] (Fig. 5). These data indicate that dietary K+ increases renal K+ excretion by increasing K+ secretion in the distal nephron rather than inhibiting K+ reabsorption in the proximal nephron.
Fig. 5.
Plasma K+ concentrations (A) and renal K+ excretion rates (B) after the 1% K+ diet with (■) or without (●) amiloride (AR) infusion (2 nmol/min, intravenous) started at the beginning of the feeding (t=0). Data are expressed as means ± SE for 4 experiments. *P < 0.05 between the groups.
Dietary K+ and gut peptide hormones.
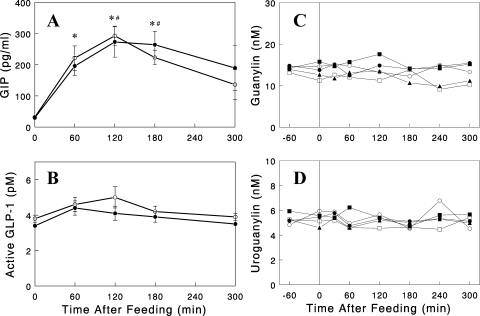
We next tested whether consuming a K+-containing diet was associated with changes in circulating hormones secreted by the gut, such as GLP-1, GIP, guanylin, and uroguanylin, as these peptide hormones have been implicated in K+ and/or Na+ homeostasis (1, 8, 20, 23, 28). We were particularly interested in testing the incretin hormones (i.e., GLP-1 and GIP) as a gut factor, based on the concept that K+ sensing may occur during meal ingestion, but not in the fasting state (see discussion). Rats were fasted overnight and given either the 1% K+ or 0% K+ diet, and plasma samples were taken at various times before and after the meal and analyzed for these gut peptides. As expected, plasma GIP and GLP-1 levels increased after a meal, but dietary K+ content did not alter their profiles (Fig. 6, A and B). Plasma levels of guanylin and uroguanylin were not changed by meal feeding in either 0% or 1% K+ groups (Fig. 6, C and D). These data suggest that these gut peptides are not likely candidates for the gut factor that senses dietary K+ and stimulates renal K+ excretion.
Fig. 6.
Plasma glucose-dependent insulinotropic polypeptide (GIP; A), glucagon-like peptide 1 (GLP-1; B), guanylin (C), and uroguanylin (D) profiles in overnight-fasted rats after the 0% (○) or 1% (●) K+ diet. A and B: data are expressed as means ± SE for 5 experiments for each group. *#Significant changes (P < 0.05) from basal (i.e., t=0) in the 0% and the 1% K+ diet group, respectively. C and D: data from individual rats are shown with open symbols representing the 0% K+ diet group, and solid symbols the 1% K+ diet group (n=2 and 3, respectively).
Dietary K+ and pituitary peptide hormones.
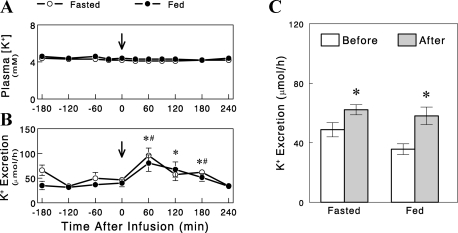
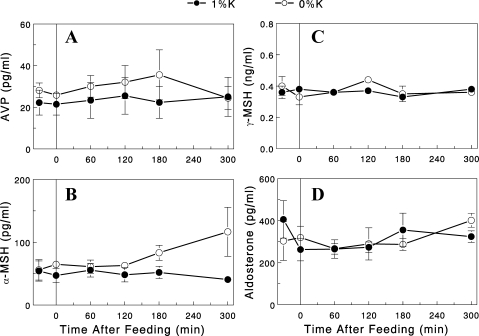
We next tested the possibility that gut sensing of K+ intake and subsequent regulation of renal K+ excretion involve the brain, especially the pituitary that secretes several peptide hormones that alter K+ excretion. We first tested whether the pituitary contains kaliuretic substances and whether their amounts are altered (to indicate changes in secretion) by dietary K+ intake. For this, we prepared saline extracts of pituitary from overnight-fasted rats refed for 2 h with regular rat chow (1% K+ diet) and tested their effects on renal K+ excretion in overnight-fasted rats. We found that an infusion of the extracts significantly increased renal K+ excretion for 2–3 h after the infusion (Fig. 7). However, similar effects were also seen with the extracts of pituitary from overnight-fasted rats (i.e., without feeding or K+ intake), indicating that the kaliuretic substances were present in the pituitary independent of dietary K+ intake. We also examined whether consuming a K+-containing diet was associated with changes in circulating pituitary hormones, such as AVP, α-MSH, and γ-MSH, which have been implicated in K+ and/or Na+ homeostasis (23). Plasma levels of AVP, α-MSH, and γ-MSH were not changed either by meal feeding or dietary K+ content (Fig. 8, A–C). These data suggest that these peptides are not likely involved in the stimulation of renal K+ excretion during dietary K+ intake (see discussion).
Fig. 7.
Plasma [K+] (A) and renal K+ excretion (B) profiles in overnight-fasted rats before and after an 1-min infusion of pituitary extracts from overnight-fasted rats (○) or overnight-fasted rats refed for 2 h with normal 1% K+ diet (●). C: average K+ excretion rates before and after the infusion of pituitary extracts. Data are expressed as means ± SE for 5 experiments. B: *#Significant changes (P < 0.05, one-tail t-test) from average K+ excretion before the infusion in the fed and the fasted group, respectively. C: *P < 0.05 vs. before.
Fig. 8.
Plasma AVP (A), α-MSH (B), γ-MSH (C), and aldosterone (D) profiles in overnight-fasted rats after the 0% (○) or 1% (●) K+ diet. Data are expressed as means ± SE for 4 or 5 experiments for each group.
Dietary K+ and aldosterone.
Finally, we examined whether dietary K+ intake was associated with increases in plasma aldosterone level, the classic regulator of K+ excretion. We found that plasma aldosterone levels were not altered either by meal feeding or dietary K+ content (Fig. 8D).
DISCUSSION
We previously demonstrated that an intragastric infusion of K+ combined with a meal enhanced renal efficiency of K+ excretion, compared with K+ infusion without the meal, providing evidence for a gut factor that increases renal K+ excretion during dietary K+ intake (15). The present study strengthens the evidence for such a factor by demonstrating that increases in plasma [K+] alone cannot account for the increases in renal [K+] excretion observed during normal dietary K+ intake, and that gut sensing of dietary K+ is an important component of the regulation of postprandial K+ excretion. Our analysis of potential humoral factors that could mediate such a response, including the gut peptides GLP-1, GIP, guanylin, and uroguanylin, and the pituitary peptides AVP, α-MSH, and γ-MSH, failed to identify a gut factor candidate. Thus, although the present study establishes the presence of a gut factor that increases renal K+ excretion during dietary K+ intake and provides evidence that ENaC in the distal nephron is involved, the mechanism by which the signal from the gut is delivered to the kidneys remains to be elucidated.
As discussed in the introduction, dietary K+ may increase renal K+ excretion via increasing plasma [K+] (traditional feedback regulation) and/or activating a mechanism involving gut sensing of K+ intake (feedforward control). The present study was designed to evaluate which of these potential mechanisms stimulate renal K+ excretion during normal dietary K+ intake. We first demonstrated that the 1% K+ diet significantly increased renal K+ excretion above basal rates, which was associated with slight increases in plasma [K+], whereas the 0% K+ diet decreased K+ excretion, which was associated with slight decreases in plasma [K+]. To test whether the difference in renal K+ excretion can be accounted for by the difference in plasma [K+] (<0.3 mM), we replicated the plasma [K+] profile observed in the 1% K+-fed rats in rats fed 0% K+ diet by systemic intravenous KCl infusion. The K+ infusion prevented the decrease in plasma K+ observed in the 0% diet-fed rats but did not significantly increase renal K+ excretion over basal rates. In fact, K+ excretion remained significantly less than that of the 1% K+-fed group despite the matched plasma [K+] profile during the meal. Thus, the increases in renal K+ excretion after the 1% K+ diet cannot be explained by changes in plasma [K+] alone, leading to the conclusion that the difference in K+ excretion is a consequence of the route of K+ entry (intragastric vs. systemic intravenous). These data convincingly demonstrate the operation of a mechanism for stimulation of renal K+ excretion, independent of plasma [K+], involving gut sensing of dietary K+.
Rabinowitz (24, 25) previously compared renal K+ excretion in sheep following a typical meal vs. K+ excretion during intravenous K+ infusion in the fasting state that reproduced meal-induced rises in plasma [K+]. He found that K+ excretion with intravenous infusion was only ¼ the amount observed with meal intake, concluding that meal-induced increases in renal K+ excretion cannot be explained by changes in plasma [K+]. While his approach was similar to ours, we incorporated a 0% K+ feeding during the K+ infusion. We believe it may be critically important to make the comparison of K+ excretion in response to dietary vs. intravenous K+ administration under identical feeding conditions because a meal provokes significant changes in hormones (e.g., insulin, glucagon, etc.), hemodynamics (i.e., blood flow), and causes gut distention, all of which have the potential to affect renal K+ excretion. In the present study, the 0% and the 1% diets had exactly the same nutrient compositions except for K+, and food intake was matched between the experimental groups to ensure that the effects of K+ entry into the gut vs. systemic circulation on K+ excretion are tested under identical postprandial conditions. This goal appeared to be achieved as indicated by similar plasma levels of glucose, GIP, and GLP-1 in the 0% K+ and the 1% K+ diet groups. Although insulin was not measured in the present study, we have data showing that postprandial plasma insulin profile is not altered by dietary K+ content (unpublished data) and that insulin does not affect renal K+ excretion (5). Thus, the present study demonstrates that dietary K+ exerted a greater kaliuretic effect than systemic K+ infusion did under identical postprandial conditions (and matched plasma [K+] profile).
There is ample evidence for interactions between the gastrointestinal tract and the kidney (19). There are many gut peptides and hormones released in response to intake of dietary nutrients and ions that affect renal functions (19). In the present study, we examined whether there are hormones or kaliuretic substances released from the gut in response to dietary K+. Our previous study (15) demonstrated that an intragastric K+ infusion caused a marked increase in plasma K+ clearance when combined with a meal, but not when studied in the fasting state (i.e., without a meal). Thus, there may be a mechanism in the gut for sensing of normal dietary K+ intake (i.e., the presence of both a meal and K+), which stimulates renal K+ excretion. Such a mechanism may be important for ensuring that renal K+ excretion is increased only when a meal includes K+ (which increases total body K+ content), but not when a meal lacks K+, and not when plasma [K+] transiently increases as a result of a K+ shift between intracellular and extracellular spaces (without increases in total body K+ content), such as in exercise. There are cells in the body that can sense both K+ and meal nutrients (e.g., pancreatic β-cell). Therefore, it is conceivable that there are cells in the gut that sense both K+ and meal nutrients. In this context, we tested the incretin hormones, GIP and GLP-1, gut hormones known to be secreted in response to meal nutrients. In addition, GLP-1 has been shown to have effects on renal sodium excretion and urinary flow (1), and GLP-1 receptor is expressed in a renal proximal tubule cell line (28). In our test of whether dietary K+ influences the secretion of these incretin hormones, we saw no evidence for an impact of dietary K+ on plasma GIP or GLP-1 profiles, disqualifying these incretin hormones as a gut factor candidate.
We were also interested in testing the guanylin peptides uroguanylin and guanylin as a gut factor candidate because these peptide hormones are secreted by the intestine and have natriuretic and kaliuretic effects (8, 9, 20). One of us previously used perfused rat small intestine to show that a salt loading significantly increased guanylin and uroguanylin secretion into the perfusates (13). This effect developed very fast with significant increases detected within 10 min of the salt loading and lasted for 60 min. Whether the secretion of these peptides is also stimulated by K+ was not previously investigated. One necessary condition for a gut factor is that its plasma level must be altered in response to dietary K+. Our results indicate that plasma levels of uroguanylin and guanylin were unaltered by either a meal or by dietary K+ content, indicating that these peptide hormones may not be involved in provoking the postprandial kaliuresis.
In the absence of evidence for humoral factors released from the gut during dietary K+ intake, we next considered that gut sensing of K+ intake may be transmitted to the brain via a neural pathway to stimulate renal K+ excretion. There is significant evidence that the brain is involved in K+ homeostasis (23). Removal of one kidney (i.e., uninephrectomy) in anesthetized rats causes approximately twofold increases in Na+ and K+ excretion in the remaining kidney. A series of elegant studies by Humphreys and colleagues (12, 16, 17, 26, 27) established that these effects are mediated by γ-MSH, whose secretion from the pituitary is stimulated after uninephrectomy. Removal of renal afferent nerve input prevented the increases in γ-MSH after uninephrectomy (12), indicating an important role of an afferent neural pathway from the kidney. It is conceivable that the brain may monitor dietary K+ intake (input) and makes adjustments in renal K+ excretion (output) to maintain K+ balance. The sensing of K+ intake in the gut may be transmitted to the hypothalamus via an afferent neural pathway as is the signal from the kidney, and the hypothalamus may regulate renal (and/or extrarenal) K+ handling via pituitary hormones (23). This idea is supported by the present finding that the pituitary contains significant amounts of kaliuretic substances. In this context, we measured plasma profiles of the pituitary hormones AVP, α-MSH, and γ-MSH, which have been implicated in K+ homeostasis. We found that they were not affected by a meal or dietary K+ content, disqualifying them as a potential humoral factor involved in the stimulation of renal K+ excretion during dietary K+ intake. However, these data should not be taken as evidence against a role of the brain or the pituitary, as there are many other pituitary peptides with unknown functions. A systematic analysis of all pituitary peptides for their responses to dietary K+ intake may potentially identify a gut factor candidate.
Perspectives and Significance
The present study demonstrates that increases in renal K+ excretion after a normal diet cannot be accounted for by changes in plasma [K+] alone, and gut sensing of dietary K+ is an important component of the postprandial regulation of renal K+ excretion. Our studies on gut and pituitary peptide hormones suggest that there may be previously unknown humoral factors that stimulate renal K+ excretion in response to dietary K+ intake. Further studies are warranted to identify such a factor and/or elucidate the mechanisms by which gut sensing of dietary K+ leads to the stimulation of renal K+ excretion during dietary K+ intake.
GRANTS
This study was supported by National Institutes of Health DK 080233 (to J. H. Youn), the Basic Science Research Program through the NRF of Korea (MEST; No. 2010-0016115; to I. Kang), and the Korea Research Foundation Grant funded by the Korean Government (MOEHRD; KRF-2006-352-G00008; to K. S. Oh).
DISCLOSURES
No conflicts of interest, financial or otherwise, are declared by the author(s).
REFERENCES
- 1. Ahren B. GLP-1 and extra-islet effects. Horm Metab Res 36: 842–845, 2004 [DOI] [PubMed] [Google Scholar]
- 2. Bia MJ, DeFronzo RA. Extrarenal potassium homeostasis. Am J Physiol Renal Fluid Electrolyte Physiol 240: F257–F268, 1981 [DOI] [PubMed] [Google Scholar]
- 3. Calo L, Borsatti A, Favaro S, Rabinowitz L. Kaliuresis in normal subjects following oral potassium citrate intake without increased plasma potassium concentration. Nephron 69: 253–258, 1995 [DOI] [PubMed] [Google Scholar]
- 4. Choi CS, Lee FN, McDonough AA, Youn JH. Independent regulation of in vivo insulin action on glucose versus K+ uptake by dietary fat and K+ content. Diabetes 51: 915–920, 2002 [DOI] [PubMed] [Google Scholar]
- 5. Choi CS, Thompson CB, Leong PK, McDonough AA, Youn JH. Short-term K+ deprivation provokes insulin resistance of cellular K+ uptake revealed with the K+ clamp. Am J Physiol Renal Physiol 280: F95–F102, 2001 [DOI] [PubMed] [Google Scholar]
- 6. DeFronzo RA, Sherwin RS, Dillingham M, Hendler R, Tamborlane WV, Felig P. Influence of basal insulin and glucagon secretion on potassium and sodium metabolism. Studies with somatostatin in normal dogs and in normal and diabetic human beings. J Clin Invest 61: 472–479, 1978 [DOI] [PMC free article] [PubMed] [Google Scholar]
- 7. Frindt G, Palmer LG. K+ secretion in the rat kidney: Na+ channel-dependent and -independent mechanisms. Am J Physiol Renal Physiol 297: F389–F396, 2009 [DOI] [PMC free article] [PubMed] [Google Scholar]
- 8. Forte LR, Fan X, Hamra FK. Salt and water homeostasis: uroguanylin is a circulating peptide hormone with natriuretic activity. Am J Kidney Dis 28: 296–304, 1996 [DOI] [PubMed] [Google Scholar]
- 9. Fukae H, Kinoshita H, Fujimoto S, Kita T, Nakazato M, Eto T. Changes in urinary levels and renal expression of uroguanylin on low or high salt diets in rats. Nephron 92: 373–8, 2002 [DOI] [PubMed] [Google Scholar]
- 10. Gennari FJ. Hypokalemia. N Engl J Med 339: 451–458, 1998 [DOI] [PubMed] [Google Scholar]
- 11. Gennari FJ, Segal AS. Hyperkalemia: An adaptive response in chronic renal insufficiency. Kidney Int 62: 1–9, 2002 [DOI] [PubMed] [Google Scholar]
- 12. Humphreys MH, Lin SY, Wiedemann E. Renal nerves and the natriuresis following unilateral renal exclusion in the rat. Kidney Int 39: 63–70, 1991 [DOI] [PubMed] [Google Scholar]
- 13. Kita T, Kitamura K, Sakata J, Eto T. Marked increase of guanylin secretion in response to salt loading in the rat small intestine. Am J Physiol Gastrointest Liver Physiol 277: G960–G966, 1999 [DOI] [PubMed] [Google Scholar]
- 14. Kurtzman NA, Gonzalez J, DeFronzo R, Giebisch G. A patient with hyperkalemia and metabolic acidosis. Am J Kidney Dis 15: 333–356, 1990 [DOI] [PubMed] [Google Scholar]
- 15. Lee FN, Oh G, McDonough AA, Youn JH. Evidence for gut factor in K+ homeostasis. Am J Physiol Renal Physiol 293: F541–F547, 2007 [DOI] [PubMed] [Google Scholar]
- 16. Lin SY, Chaves C, Wiedemann E, Humphreys MH. A gamma-melanocyte stimulating hormone-like peptide causes reflex natriuresis after acute unilateral nephrectomy. Hypertension 10: 619–627, 1987 [DOI] [PubMed] [Google Scholar]
- 17. Lin SY, Wiedemann E, Humphreys MH. Role of the pituitary in reflex natriuresis following acute unilateral nephrectomy. Am J Physiol Renal Fluid Electrolyte Physiol 249: F282–F290, 1985 [DOI] [PubMed] [Google Scholar]
- 18. McDonough AA, Thompson CB, Youn JH. Skeletal muscle regulates extracellular potassium. Am J Physiol Renal Physiol 282: F967–F974, 2002 [DOI] [PubMed] [Google Scholar]
- 19. Michell AR, Debnam ES, Unwin RJ. Regulation of renal function by the gastrointestinal tract: potential role of gut-derived peptides and hormones. Annu Rev Physiol 70: 379–403, 2008 [DOI] [PubMed] [Google Scholar]
- 20. Nakazato M. Guanylin family: new intestinal peptides regulating electrolyte and water homeostasis. J Gastroenterol 36: 219–225, 2001 [DOI] [PubMed] [Google Scholar]
- 21. Rabinowitz L. Homeostatic regulation of potassium excretion. J Hypertens 7: 433–442, 1989 [DOI] [PubMed] [Google Scholar]
- 22. Rabinowitz L. Aldosterone and potassium homeostasis. Kidney Int 49: 1738–1742, 1996 [DOI] [PubMed] [Google Scholar]
- 23. Rabinowitz L, Aizman RI. The central nervous system in potassium homeostasis. Front Neuroendocrinol 14: 1–26, 1993 [DOI] [PubMed] [Google Scholar]
- 24. Rabinowitz L, Green DM, Sarason RL, Yamauchi H. Homeostatic potassium excretion in fed and fasted sheep. Am J Physiol Regul Integr Comp Physiol 254: R357–R380, 1988 [DOI] [PubMed] [Google Scholar]
- 25. Rabinowitz L, Sarason RL, Yamauchi H. Effects of KCl infusion on potassium excretion in sheep. Am J Physiol Renal Fluid Electrolyte Physiol 249: F263–F271, 1985 [DOI] [PubMed] [Google Scholar]
- 26. Ribstein J, Humphreys MH. Endogenous opioids and electrolyte excretion after contralateral renal exclusion. Am J Physiol Renal Fluid Electrolyte Physiol 244: F392–F398, 1983 [DOI] [PubMed] [Google Scholar]
- 27. Ribstein J, Humphreys MH. Renal nerves and cation excretion after acute reduction in functioning renal mass in the rat. Am J Physiol Renal Fluid Electrolyte Physiol 246: F260–F265, 1984 [DOI] [PubMed] [Google Scholar]
- 28. Schlatter P, Beglinger C, Drewe J, Gutmann H. Glucagon-like peptide 1 receptor expression in primary porcine proximal tubular cells. Regul Pept 141: 120–128, 2007 [DOI] [PubMed] [Google Scholar]
- 29. Stokes JB. Potassium intoxication: pathogenesis and treatment. In: The Regulation of Potassium Balance, edited by Seldin DW, Giebisch G. New York, NY: Raven, p. 157–174, 1989 [Google Scholar]
- 30. Wang WH, Giebisch G. Regulation of potassium (K) handling in the renal collecting duct. Pflügers Arch 458: 157–168, 2009 [DOI] [PMC free article] [PubMed] [Google Scholar]
- 31. Young DB. Quantitative analysis of aldosterone's role in potassium regulation. Am J Physiol Renal Fluid Electrolyte Physiol 255: F811–F822, 1988 [DOI] [PubMed] [Google Scholar]
- 32. Young DB, Paulsen AW. Interrelated effects of aldosterone and plasma potassium on potassium excretion. Am J Physiol Renal Fluid Electrolyte Physiol 244: F28–F34, 1983 [DOI] [PubMed] [Google Scholar]


