

Abstract
Background
Despite surging interest in taxation as a policy to address poor food choice, US research directly examining the association of food prices with individual intake is scarce.
Methods
This 20-year longitudinal study included 12,123 respondent days from 5,115 participants in the Coronary Artery Risk Development in Young Adults (CARDIA) Study. Associations between food price, dietary intake, overall energy intake, weight, and HOMA insulin resistance (HOMA-IR) scores were assessed using conditional log-log and linear regression models.
Results
The real price (inflated to 2006 dollars) of soda and pizza decreased over time; the price of whole milk increased. A 10% increase in the price of soda or pizza was associated with a -7.12% (95% confidence interval [CI]: -63.5, -10.71) or -11.5% (95%CI: -17.50, -5.50) change in energy from these foods respectively. A $1.00 increase in soda price was also associated with lower daily energy intake (-124 [95%CI: -198, -50] kcal), lower weight (-2.34 [95%CI: -4.00, -0.68] lbs), and lower HOMA-IR score (0.42 [95%CI: -0.60, -0.23]); similar trends were observed for pizza. A $1.00 increase in the price of both soda and pizza was associated with greater changes in total energy intake (-181.49 [95%CI: -247.79, -115.18] kcal), body weight (-3.66 [95%CI: -5.19, -2.14] lbs), and HOMA-IR (-0.45 [95%CI: -0.59, -0.31]).
Conclusions
Policies aimed at altering the price of soda or away-from-home pizza may be effective mechanisms to steer US adults toward a more healthful diet and help reduce long-term weight gain or insulin levels over time.
Introduction
Although price policies, such as taxation, are beginning to be employed as a means of addressing obesity, diabetes, and other nutrition-related health concerns, minimal research has been done to study how these price changes would impact health. To date, this research has focused on broad ecological relationships 1-5, small-scale experiments 6-9, or used cross-sectional data10, 11, rather than examining the direct effects of price on food and beverage intake over a long period of time.
To compensate for food environments where healthy foods (i.e. fresh fruits and vegetables) tend to cost more 12, 13, public health professionals and politicians have suggested that foods high in calories, saturated fat, or added sugar be subject to added taxes and/or that healthier foods be subsidized 1, 14-17. Such manipulation of food prices has been a mainstay of global agricultural and food policy16, 18, employed as a means to increase availability of animal foods and basic commodities, but it has not been readily employed as a mechanism to promote public health and chronic disease prevention efforts 16, 19, 20.
To properly examine the total health effect of price changes, it is necessary to examine direct and indirect effects of price changes on dietary intake. This includes (1) the direct price elasticity of demand, defined as the measure of responsiveness in the quantity demanded for a commodity as a result of change in price of that same commodity, and (2) indirect effects on complements and substitutes, namely other foods whose consumption might be affected by price changes of a given food. For example, one could examine changes in consumption of fruit juice or milk in response to changes in the price of soft drinks.
Using directly measured individual-level consumption and health-outcome data linked with community price data (specific to each individual's time-varying residential location at the time dietary data were collected), we investigated the secular trends in selected food and beverage prices and their association with consumption (price elasticity of demand), total energy intake, weight, and homeostasis model assessment of insulin resistance (HOMA-IR) score over a 20-year period in the Coronary Artery Risk Development in Young Adults (CARDIA) Study.
Methods
Study Population
The CARDIA Study is a multicenter, longitudinal study of the determinants and evolution of cardiovascular disease risk in Black and White young adults. CARDIA participants were drawn from one of four US cities, with recruitment procedures designed to create a balanced representation of age, gender, ethnicity, and education group in each location. The baseline survey was completed by 5,115 young adults, aged 18-30. Follow-up examinations were conducted at 2, 5, 7, 10, 15 and 20 years post baseline with retention rates of 91%, 86%, 81%, 79%, 74%, and 72% respectively. Data from exam years 0 (1985-86), 7 (1992-93), and 20 (2005-06) were used for this study, as these are the years in which dietary data were collected. Detailed descriptions of the sampling plan and cohort characteristics are described elsewhere 21, 22.
Food Prices
Food price data were compiled by the Council for Community and Economic Research (C2ER, formerly the American Chamber of Commerce Research Association)23. From the available price data, we selected the following beverage and food variables based on comparability with individual-level food consumption data in CARDIA: soft drink (2 Liter (L) bottle of Coke), whole milk (one-half gallon), hamburger (1/4 pound (lb) burger, purchased away-from-home), and pizza (12-13 inch cheese, thin crust purchased away-from-home). We also include a selection of prices of hypothesized complementary and replacement foods and beverages: beer (6 pack, 12 oz bottles), wine (1.5 L bottle), coffee (1 lb can of ground coffee), bananas (1 lb), steak (1 lb., USDA choice), parmesan cheese (8 oz, grated), and fried chicken (pieces, thigh and drumstick, purchased away-from-home). To account for inflation, we used the consumer price index (CPI) 24 of Year 2006, 3rd quarter (index=100%) as the baseline to inflate the nominal values for all prices to 2006 dollars. We linked price data to CARDIA respondents temporally (based on the year and quarter of CARDIA exam dates) and spatially (based on the respondent's residential location at each time point. A more detailed description of price data and our imputation strategy is provided in the eAppendix.
Dietary Assessment
Usual dietary intake was assessed using the CARDIA Diet History followed by a comprehensive quantitative food frequency (FFQ) questionnaire. The Diet History is a valid and reliable 25interviewer-administered questionnaire 26. We use two beverage and two away-from-home food categories: whole milk (fluid milk only, not powdered, evaporated or condensed or fluid milk used in recipes), soft drinks (sweetened), hamburgers (sandwich, fast food) and pizza (frozen/restaurant).
Anthropometrics and Insulin Resistance
Measured height (nearest 0.5 cm) and weight (nearest 0.1 kg) were collected by trained technicians. Fasting insulin and glucose were obtained by venous blood draw. Glucose was measured using hexokinase coupled to glucose-6-phosphate dehydrogenase. HOMA-IR score, a measure of insulin resistance, was calculated as [fasting glucose (mmol per liter) × fasting insulin (μU per liter)]/22.5] 27. Higher scores are indicative of increased insulin sensitivity.
Covariates
At each exam period, self-reported information on sociodemographic and selected health behaviors was collected using standardized questionnaires, including age, education (completed elementary school, ≤3 years high school, 4 years of high school, ≤3 years college, or 4 or more years of college), income (low [<$25,000], middle [$25,000- <$50,000]), and high [≥$50,000]), and family structure (married, single, married with children, and single with children). Physical activity (in exercise units [EU] per week) was assessed using the CARDIA physical activity questionnaire 28. All models also adjusted for the Cost of Living (COL). A detailed description of COL data is provided in the eAppendix.
Statistical Analysis
All analyses were completed in Stata 10 (Stata Corp, College Station, TX). Descriptive statistics of beverage prices, energy (kcal) per person and per consumer from each food group, and percent consuming each food group were compared across the three exam periods, with statistical significance set at the p<0.05 level (two-tailed test)
For analysis of price elasticity (the ratio of a percent change in consumption to percent change in price), we used two step marginal effect models where the resulting estimates are weighted means of the association between changes in price with changes in consumption. These models first estimate the association between price change on the probability of consuming a food or beverage (step 1) and then the association between price change and the quantity consumed among consumers (step 2) 29. Models were clustered on the individual (to correct standard errors for multiple observations and possible differences in variance) and estimates and standard errors were generated using 1000 replications 30. We tested and did not find a statistically significant interaction between logged price values with income, or logged price values with time (likelihood ratio test p> 0.10). A more detailed description of the two-step marginal effect method is available in the eAppendix.
We examined own-price and cross-price elasticities. Own-price elasticity is defined as the percentage change in consumption associated with a percentage change in price. Cross-price elasticity is the percentage change in consumption of the first good associated with a percentage change in the price of a second good; their inclusion is necessary for proper evaluation of the total effect of changes in food price on diet and health. For example, to fully understand how change in soda price is associated with change in total energy, we need to also understand how the change in soda price is associated with change in intake of whole milk (a potential substitute) or pizza (a potential compliment).
Finally, we examined the association between daily total energy intake, body weight, and HOMA-IR with price using pooled ordinary least square regression models, clustered on the individual. For each model, the continuous food and beverage prices were regressed on the three outcomes variables, adjusting for sociodemographic (race, gender, age, income, education, and family structure) and lifestyle factors (total physical activity and smoking status) as well as logged values of hypothesized complementary and replacement foods, logged COL, and an indicator variable for time (Year 0, Year 7, Year 20 [referent]), and imputed price data (yes/no). The body weight models also adjusted for subjects' height.
Exclusions
In all models, participants' observations were excluded if price data were incomplete (n=3 observations) or the participant was pregnant (n=69 observations). This resulted in a final sample size for all marginal effect estimates of n=12,123 observations. In the HOMA-IR model, participants were further excluded if they were taking anti-diabetic medication (n=182 observations), resulting in final sample sizes for the longitudinal repeated measures regression models of n=12,007 (kcal), n=11,972 (weight), and n=10,218 (HOMA-IR score) person observations.
Results
The inflation-adjusted real price of soda and pizza steadily declined between Exam Year 0 (1985) and Year 20 (2006), with the largest percent decrease observed for soda, falling from $2.71 to $1.42 (a 48% decrease, Table 1). The price of an away-from-home hamburger and whole milk were relatively stable. It is important to note, however, that these prices ignore the total cost as they do not incorporate the time cost involved in preparing food 31. Despite an average decline in prices, between 10 and 50% of our sample experienced price increases (depending on food group) between exam years 0 and 7 and years 7 and 20 (data not shown).
Table 1.
Descriptive statistics for price and energy consumption from selected food and beverage groups at Examination Years 0, 7 and 20 of the CARDIA Studya
| Year 0 (1985) | Year 7 (1992) | Year 20 (2006) | ||||
|---|---|---|---|---|---|---|
| n | n | n | ||||
| Soda | ||||||
| Price, $(SD) | 5115 | 2.71 (0.31) | 5115 | 1.69 (0.17) | 5115 | 1.42 (0.24) |
| Daily energy per person, kcal(SE)b | 3943 | 100 (2) | 3943 | 97 (22) | 3943 | 64 (20) |
| Percent consuming, %(SE) | 3143 | 76.0 (7.8) | 3143 | 66.7 (7.3) | 3143 | 48.5 (8.4) |
| Daily energy per consumer, kcal(SE)c | 3,880 | 130 (13) | 2591 | 143 (17) | 1521 | 129 (19) |
| Whole Milk | ||||||
| Price, $(SD) | 5115 | 2.00 (0.18) | 5115 | 2.04 (0.12) | 5115 | 2.24 (0.25) |
| Daily energy per person, kcal(SE)b | 3943 | 100 (48) | 3943 | 34 (16) | 3943 | 16 (8) |
| Percent consuming, %(SE) | 3143 | 46.6 (7.8) | 3143 | 25.8 (3.8) | 3143 | 15.3 (2.3) |
| Daily energy per consumer, cal(SE)c | 2376 | 204 (69) | 1002 | 129 (33) | 481 | 101 (39) |
| Burger | ||||||
| Price, $(SD) | 5115 | 2.50 (0.18) | 5115 | 2.65 (0.26) | 5115 | 2.67 (0.22) |
| Daily energy per person, kcal(SE)b | 3943 | 59 (25) | 3943 | 49 (22) | 3943 | 55 (21) |
| Percent consuming, %(SE) | 3143 | 52.1 (7.1) | 3143 | 57.1 (7.7) | 3143 | 57.1 (8.9) |
| Daily energy per consumer, kcal(SE)c | 2660 | 110 (35) | 2218 | 82 (27) | 1792 | 57 (19) |
| Pizza | ||||||
| Price, $(SD) | 5115 | 13.48 (0.79) | 5115 | 12.01 (1.23) | 5115 | 10.80 (0.90) |
| Daily energy per person, kcal(SE)b | 3943 | 95 (35) | 3943 | 90 (32) | 3943 | 48 (14) |
| Percent consuming, %(SE) | 3143 | 84.4 (1.8) | 3143 | 84.6 (2.5) | 3143 | 80.6 (3.0) |
| Daily energy per consumer, kcal(SE)c | 4310 | 112 (39) | 3285 | 105 (36) | 2530 | 60 (16) |
Values are mean dollar value (SD) for price; mean % (SE) for percent consuming, and mean kcal (SE) for per person and per consumer estimates. Percent consuming, per person, and per consumer estimates are age and gender adjusted, and rounded to nearest whole kilocalorie. Price data are real prices, in 2006 dollars, for a 2 liter bottle of soda (Soda), a one-half gallon of whole milk (Whole milk), a ¼ pound hamburger purchased at a fast food restaurant (Burger), and a 13-inch cheese pizza, regular crust, purchased away-from-home (Pizza).
Per person estimates apply to the entire sample and are derived from intake data of both consumers and non-consumers of the specific food or beverage.
Per consumer estimates apply only to those individuals who consumed the food or beverage
Age and gender adjusted estimates suggest, for most foods, an overall decline in intake (Table 1). For example, there was an overall decline in the percent of the sample consuming soda, but among consumers daily energy from soda remained relatively constant, resulting in an overall decline in estimates of daily energy intake per person.
Changes in the price of soda and pizza were associated with changes in the probability of consuming (Model 1 versus Model 2; Table 2), as well as the amount consumed (Model 3 Table 2). A 10% increase in the logged price of soda resulted in a 3% decline in the probability of consuming soda and a decrease in the log amount consumed (among consumers). A 10% increase in the price of soda is roughly equivalent to $0.20 per 1 liter bottle.
Table 2.
Estimated model coefficientsa of the association between price, the probability of consumption, and the amount consumed among consumers.
| Model 1b: | Model 2c: | Model 3d: | ||
|---|---|---|---|---|
| Estimated probability | Probability w/10% increase in price | n | Estimated change in amount among consumers | |
| Soda | 0.66 (0.18) | 0.64 (0.18)e | 7,990 | -0.19 (0.14) |
| Whole Milk | 0.32 (0.22) | 0.32 (0.22) | 3,861 | -0.07 (0.42) |
| Hamburgers | 0.55 (0.55) | 0.55 (0.13)e | 6,669 | 0.07 (0.14) |
| Pizza | 0.84 (0.09) | 0.78 (0.10)e | 10,123 | -0.43 (0.18) |
Values are estimated model coefficients (SE). Models 1 and 2, n=12,123. Model 3 sample sizes vary as listed.
Probit model of probability of consumption on logged price of each food or beverage. All models also adjusted for the following covariates: logged values for the price of soda, whole milk, hamburgers and pizza as well as CARDIA study center, age (continuous), race, gender, education (completed elementary school, ≤ 3 years high school, completed high school, ≤ 3 years college, and completed college [referent]), family structure (single, married [referent], single with children, and married with children), annual household income (low (<$25,000), middle ($25,000- <$50,000), high (>$50,000) [referent]), logged cost of living index, imputed price (indicator, yes/no), and time (year 0, year 7, and year 20 [referent]). Model is clustered on the individual. Individual food models also include: Soda, logged price of wine; Whole milk, logged price of coffee; Burger, logged price of fried chicken, parmesan cheese, and steak; Pizza, logged price of fried chicken.
Same probit models described above, with probabilities predicted for a 10% change in the price of the selected food or beverage using the Stata PREDICT command.
coefficients derived from linear regression model estimated for consumers of the selected food or beverage. All food models include the same covariates listed for Model 1.
Estimates are statistically different from one another using two-tailed chi-square test, p<0.05.
Own price elasticities were in the expected direction for soda and away-from-home pizza (p<0.05, Table 3). Estimates for hamburgers and whole milk were in the opposite direction expected, but were not statistically significant. Our results suggest that a 10% increase in the price of soda is associated with 7.12% (SE: 1.83, p<0.001) decrease in daily energy from soda (accounting for non-consumption).
Table 3.
Price elasticity of percent change in energy from foods associated with a 10 percent change in the pricea
| % change in energy from: | ||||
|---|---|---|---|---|
| Soda | Whole Milk | Burger | Pizza | |
| 10% increase in the price of: | ||||
| Sodac | -7.12 (1.83)b | 4.11 (3.02) | -4.21 (2.61) | 9.95 (3.95)b |
| Whole Milkd | -0.38 (1.85) | 2.38 (3.24) | 2.98 (2.56) | 6.87 (3.72) |
| Burgere | 2.95 (1.74) | -0.39 (2.87) | 2.03 (2.50) | -6.07 (3.72) |
| Pizzaf | 3.11 (1.42)b | -1.71 (2.46) | 1.47 (1.97) | -11.50 (3.06)b |
Values are elasticity (SE) derived from conditional log-log marginal effect models of percent daily energy (kcals) from food or beverage groups on percent change in price of food or beverage. All models adjust for the following covariates: logged values for the price of soda, whole milk, orange juice, hamburgers and pizza as well as CARDIA study center, age (continuous), race, gender, education (completed elementary school, ≤ 3 years high school, completed high school, ≤ 3 years college, and completed college [referent]), family structure (single, married [referent], single with children, and married with children), annual household income (low (<$25,000), middle ($25,000- <$50,000), high (>$50,000) [referent]), logged cost of living index, imputed price (indicator, yes/no), and time (year 0, year 7, and year 20 [referent]). SE estimates calculated using 1000 replications. n= 12,123 observations. Specific food and beverage models also adjust for the following covariates (these estimated coefficients [cross-price elasticities] are not shown): Soda, logged price of wine; Whole Milk, logged price of coffee; Burger, logged price of fried chicken, parmesan cheese and steak; Pizza, logged price of fried chicken.
Estimate is significantly different from zero, p<0.05.
Cross-price elasticities tended to be smaller than own-price elasticities. For example, a 10% increase in the price of pizza was associated with a 3.11% (SE: 1.42, p=0.012) increase in the daily energy from soda (cross price elasticity, Table 3) compared to an 11.5% (SE: 3.06, p<0.001) decrease in daily energy from pizza (own-price elasticity, Table 3).
Price was also associated with total energy intake, body weight, and HOMA-IR scores (Figure 1). A one dollar increase in the price of soda was associated with an average 124 (SE: 38, p= 0.001) fewer total daily kcal, 2.34 (SE: 0.85, p=0.006) pound lower weight, and a 0.42 (SE: 0.10, p<0.001) lower HOMA-IR score (improved insulin resistance. The associations between price and the three outcomes were consistent (i.e. the three dependent variables were in the same direction) for both away-from-home hamburgers and pizza, although the estimates only reached statistical significance for pizza.
Figure 1.
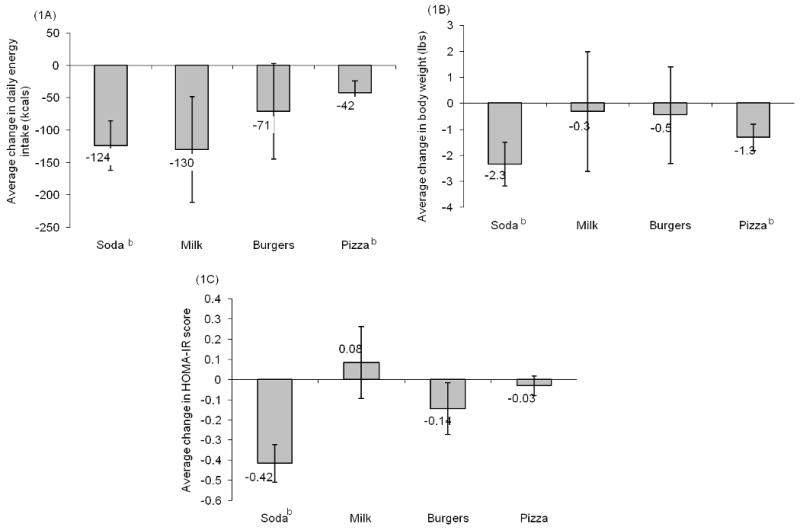
Association between a one dollar increase in the price of selected foods and beverages with change in total energy intake (A), body weight (B), and HOMA-IR (C) a
a Each food/beverage and outcome variable were modeled independently (n=12 models) as linear regression models of outcome (total energy intake (kcal, n observations = 12,007), weight (lbs, n observations = 11,972), and HOMA-IR (n observations = 10,218)) on the price (in dollars) of soda, whole milk, hamburgers, and pizza. All models adjusted for the following covariates: age (continuous), race, gender, income (low (<$25,000), middle ($25,000-<$50,000), high (≥$50,000) [referent], missing income), education (< high school (HS), completed HS [referent], 3 years college, ≥ 4 years college), family structure (single, married [referent], single with children, married with children), logged cost of living, imputed price (indicator variable, yes/no), and CARDIA study center. Models with weight as the dependent variable also adjusted for participants' height. Models adjust for clustering at the individual level.
Specific food and beverage models also adjust for the following covariates: Soda, logged price of wine; Whole milk, logged price of coffee; Burger, logged price of fried chicken, steak, and parmesan cheese; Pizza,logged price of fried chicken.
b Estimate is significantly different from zero, p<0.05.
Due to their strong cross-price elasticities, we also estimated the additive association of changing the price of soda, pizza or soda and pizza on total daily energy intake, body weight and HOMA-IR. A one dollar increase in the price of both soda and pizza was associated with an additively greater change in total energy intake compared to increasing the price of just one of these foods. For example, increasing the price of soda or pizza alone resulted in a 124 (SE: 38, p=0.001) and 58 (SE: 19, p=0.002) fewer total daily kcal while a one dollar increase in the price of both soda and pizza resulted in a 181 (SE: 34, p<0.001) fewer total daily kcal. Similar patterns were observed for body weight and HOMA-IR scores (Figure 2).
Figure 2.
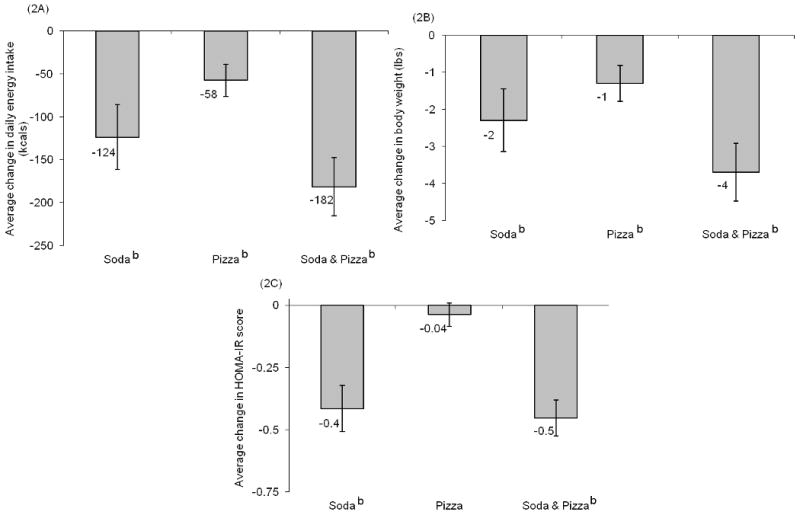
Association between a one dollar increase in the price of soda alone, pizza alone, or both soda and pizza with change in total energy intake (a), body weight (b), and HOMA-IR score (c)a
a Estimates derived from linear regression model of outcome (total energy intake (kcal, n observations = 12,007), body weight (lbs, n observations = 11,972), and HOMA-IR (n observations = 10,218)) on the prices (in dollars) of soda, whole milk, hamburgers, and pizza. All models adjusted for age (continuous), race, gender, income (low (<$25,000), middle ($25,000-<$50,000), high (≥$50,000) [referent], missing income), education (< high school (HS), completed HS [referent], 3 years college, ≥ 4 years college), family structure (single, married [referent], single with children, married with children), logged price of the replacement beverage wine and orange juice, the logged cost of living index, having imputed prices (indicator variable, yes/no), and CARDIA study center. Models adjust for clustering at the individual level. Models with weight as the dependent variable also adjusted for participants' height.
b Estimate is significantly different from zero, p<0.05.
Discussion
Price manipulations on unhealthy foods and beverages have been proposed as a potential mechanism for improving the diet and health outcomes of Americans (see 1, 14, 16). While some argue that there is little evidence such a tax would improve health or positively impact obesity rates 32, no research has examined the direct and indirect total effects of such taxes on energy intake and subsequent changes in weight and other metabolic outcomes. Similar taxation policies have proven a successful means of effectively reducing adult and teenage smoking 33, 34.
Our results provide stronger evidence to support the potential health benefits of taxing selected foods and beverages. We report that an increase in the price of soda and pizza is associated with a significant decrease in daily energy intake from these foods. Price increases in soda and pizza were also associated with significant declines in overall daily energy intake, lower weight, and lower HOMA-IR scores over the 20-year study period. Furthermore, we report declines in the real (inflation-adjusted) prices of soda and away-from-home foods; foods which are commonly associated with increased caloric consumption and adverse health outcomes 35-39.
Using our price elasticities and the sample's mean daily energy, body weight, and HOMA-IR values, we estimate that an 18% tax, which is the level that was unsuccessfully proposed by the state of New York and is considered by others as a minimal tax, would result in a roughly 56 kcal decline in daily total energy intake among young to middle aged adults ((18 [proposed tax]*(-0.1116978 [estimated elasticity])*2811.9 kcal [mean daily kcal in our sample]). At the population level declines of 56 kcal per day would be associated with a reduction of roughly 5 pounds per person per year and significant reductions in the risks of most obesity-related chronic diseases 40-42. With respect to smoking, price elasticities were typically higher for children and teenagers and the elderly33, 34, 43, 44. If this is also true for beverages, the overall impact of this tax on all its citizens might be greater than found here among adults aged 20 to 54.
Our results are in the same direction as those reported elsewhere. In France and Italy demand elasticity was negative and relatively small for fluid milk 45. Similar in direction but of greater magnitude, Barquera et al report that 10% price increases were associated with a decline of roughly 7 and 23 kcals per day from whole milk and soda respectively in a sample of Mexican adolescents and adults 46. The difference in magnitude of effects between the US and Mexican sample may indicate that US adults are less price sensitive, however a direct comparison is not possible due to differences in dietary methodology (direct weighing and recipe collection versus food-frequency questionnaire) and study-design (cross-sectional versus longitudinal).
While there are many strengths as a result of using the CARDIA data, our analysis is limited by its focus on a small number of food and beverage groups. Additional and important substitution and complementary foods and beverages may exist and should be examined in future studies. The relationship between price and consumption of “healthy” food items (i.e. raw fruits and vegetables) should also be examined; our price data did not allow for evaluation of these relationships. Furthermore, we are not able to capture the full range of substitutability for the foods and beverages examined (i.e. using low-fat or skim milk if the price of whole milk increases, or choosing another fast food sandwich if hamburger prices rise), and thus we might have failed to take into account important explanations for our outcomes. Ideally, a full set of prices and food groups would have been utilized, and the association between price and overall health examined using the demand approach frequently employed by economists, the Almost Ideal Demand System 47-49. Finally, it is possible that some of these paired changes, i.e. the price and consumption of soda, are parallel trends over time which are associated with other unobserved factors, and are not necessarily causally related. However given that over a fifth of our sample experienced increased soft drink price, this is unlikely.
In our sample income did not modify the relationship between price and consumption. Deeper exploration of the interactions between food price and income may be crucial in other samples. Finally, this study has limited generalizability to non-US and younger populations. However, adolescents have been observed to be much more responsive to price changes in cigarettes than adults 33, 34, 43. We expect the relationship for price changes in foods and beverages to be similar.
Despite these limitations, ours is the first dietary behavior study in the US to examine both the direct effects of a price change on intake of a particular food (own-price elasticity) and the indirect effects on substitutes and complementary foods (cross-price elasticities). Furthermore by doing this over a longtime period, we adjust for individual heterogeneity and are able to draw conclusions about how an individual's dietary behaviors would respond to changes in food price over a 20-year period. Finally, our findings highlight the substantial disparities between the fields of smoking and dietary behavior research; while there are extensive data sets on tobacco price and smoking behavior, there is a palpable scarcity of comparable data sets related to food price and dietary intake in the United States.
In conclusion, our findings suggest that national, state, or local policies to alter the price of less healthy foods and beverages may be one possible mechanism for steering US adults toward a more healthful diet. While such policies will not solve the obesity epidemic in its entirety, and may face considerable opposition from food manufacturers and sellers, they could prove an important strategy to address overconsumption, help reduce energy intake, and potentially aid in weight loss and reduced rates of diabetes among US adults.
Supplementary Material
Acknowledgments
Funding/Support: Major funding for this study comes from The Centers for Disease Control R136EH000308-01, the National Institutes of Health: (R01-CA109831, R01-CA121152, and K01-HD044263). Additional funding has come from NIH (R01-AA12162 & DK056350), the UNC-CH Center for Environmental Health and Susceptibility (CEHS) (NIH P30-ES10126), the UNC-CH Clinic Nutrition Research Center (NIH DK56350), and the Carolina Population Center; and from contracts with the University of Alabama at Birmingham, Coordinating Center, N01-HC-95095; University of Alabama at Birmingham, Field Center, N01-HC-48047; University of Minnesota, Field Center, N01-HC-48048; Northwestern University, Field Center, N01-HC-48049; Kaiser Foundation Research Institute, N01-HC-48050 from the National Heart, Lung and Blood Institute.
eAppendix
Food Prices and Cost of Living
Conducted quarterly across participating metropolitan and non-metropolitan areas (approximately 300), the survey conducted by C2ER provides price variables for more than 60 consumer goods and services including: grocery & restaurant food items, cost of living and overall price indices, and cigarette prices. Although we would have ideally included the price of alternative types of milk (i.e. low-fat milk) or away-from-home sandwiches (i.e. chicken sandwich) in addition to the price variables used, this information was not collected and thus not available to us.
To account for inflation, we used the CPI, which represents changes in prices of all goods and services purchased for consumption by urban households, including user fees and sales and excise taxes, but excluding income taxes24. The overall CPI is typically used in favor over food specific CPI values as it controls for total cost of living50, 51.
Price data were linked both temporally and spatially to CARDIA respondents, as described in the main text. While respondents lived in just four U.S. metropolitan areas (representing 700 census tracts) at baseline, by year 20 they were located in 48 states, 1 federal district, 1 territory, 529 Counties and 3,805 census tracts. For individuals where there was not a direct match between residential location and city (defined as MSA) or year in which price data were collected prices were imputed. For example, if a respondent's residential location had a single matching MSA code and price data were available for the year and quarter in which the respondent was surveyed, prices from that matching MSA were assigned to the respondent.
Information on cost of living (COL) was obtained from C2ER and spatially and temporally linked to each respondent via their residential location. The COL index is based on six components – housing, utilities, grocery items, transportation, health care and miscellaneous goods and services. Data for the index were collected on more than 50,000 prices covering 60 different items, by chambers of commerce, economic development organizations or university applied economic centers in each participating urban area23.
Statistical Analysis
For analysis of price elasticity (the ratio of a percent change in consumption to percent change in price), we used two step marginal effect models. These models are useful for eliminating bias when examining outcomes where there are large proportions of zero values (i.e. non-consumers) that do not represent missing data, and when the distribution of consumption is skewed29 In the first step, the probability of consuming a particular food or beverage is estimated using a probit model with maximum likelihood estimation. In step two, a log-log ordinary least square regression model is run conditioned on consuming the food/beverage in question (i.e. uses only the subsample of consumers). Both models had the same specifications, adjusting for socioeconomic and demographic factors, logged values of other food/beverage items, logged COL, imputed price, and year. An example of the soda models are as follows:
Pr(AteSODA) = γ0 + γ1Ln(SodaPrice) + γ 2Age + γ 3Female + γ 4Black + γ5LowIncome + γ6MiddleIncome + γ7Education + θ8Single + γ9MarriedWithChildren + γ10SingleWithChildren + γ11Ln(FoodPrices) + γ12Ln(COL) + γ13ImputedPrice + γ14Year0 + γ15Year7 (Step 1)
Ln(SODAamt|AteSODA) = θ0 + θ 1Ln(SodaPrice) + θ 2Age + θ 3Female + θ 4Black + θ 5LowIncome + θ 6MiddleIncome + θ7Education + θ8Single + θ9MarriedWithChildren + θ10SingleWithChildren + θ11Ln(FoodPrices) + θ12Ln(COL) + θ13ImputedPrice + θ14Year0 + θ15Year7 (Step 2)
To derive unconditional predicted logged consumption, the probability of consumption estimated in Step 1 is multiplied by the expected logged energy intake estimated in Step 2 in the following way:
where Φ represents the standard normal cumulative distribution function, X′ represents the vector of explanatory variables, ά represents the vector of marginal effects from the probit estimation (Step 1), and β represents the vector of marginal effects from the OLS estimation (Step 2). The resulting estimates, interpreted as elasticities, are weighted means of the association between changes in price with changes in consumption for the full sample. Marginal estimates and elasticities were all generated using 1000 [bootstrapped] replications.
Footnotes
Author Contributions: Dr. Kiyah J. Duffey and Dr. Barry M. Popkin had full access to all of the data in the study and take full responsibility for the integrity of the data and the accuracy of the analysis.
Study concept and design: Duffey, Gordon-Larsen, Guilkey, and Popkin.
Acquisition of data: Duffey, Jacobs.
Analysis and interpretation of data: Duffey, Guilkey, and Popkin.
Drafting of the manuscript: Duffey.
Critical revision of the manuscript for important intellectual content: Gordon-Larsen, Guilkey, Shikany, Jacobs, Popkin.
Statistical analysis: Duffey.
Obtained funding: Duffey, Gordon-Larsen and Popkin.
Administrative, technical or material support: Duffey
Study Supervision: Popkin, Guilkey, Jacobs.
Additional Contributions: We gratefully acknowledge Anna Maria Siega-Riz, PhD (University of North Carolina- Chapel Hill [UNC-CH], Department of Nutrition and Epidemiology) for helpful reviews of earlier versions of this manuscript, Mr. Tom Swasey for graphical support, and Ms. Frances Dancy (both at The Carolina Population Center, UNC-CH) for administrative assistance. These individuals received no financial compensation.
Contributor Information
Kiyah J. Duffey, Department of Nutrition, Gillings School of Global Public Health, University of North Carolina at Chapel Hill, Chapel Hill, NC; Carolina Population Center, University of North Carolina- Chapel Hill, Chapel Hill, NC.
Penny Gordon-Larsen, Department of Nutrition, Gillings School of Global Public Health, University of North Carolina at Chapel Hill, Chapel Hill, NC; Carolina Population Center, University of North Carolina- Chapel Hill, Chapel Hill, NC.
James M. Shikany, Division of Preventive Medicine, University of Alabama at Birmingham.
David Guilkey, Department of Nutrition, Gillings School of Global Public Health, University of North Carolina at Chapel Hill, Chapel Hill, NC; Carolina Population Center, University of North Carolina- Chapel Hill, Chapel Hill, NC.
David R Jacobs, Jr., Division of Epidemiology and Community Health, School of Public Health, University of Minnesota, Minneapolis MN and Department of Nutrition, University of Oslo, Oslo, Norway.
Barry M. Popkin, Department of Nutrition, Gillings School of Global Public Health, University of North Carolina at Chapel Hill, Chapel Hill, NC; Carolina Population Center, University of North Carolina- Chapel Hill, Chapel Hill, NC.
References
- 1.Cash S, Sunding D, Zilberman D. Fat taxes and thin subsidies: Prices, diet, and health outcomes. Acta Agriculturae Scandinavica, Section C - Economy. 2005;2(3-4):167–174. 168. [Google Scholar]
- 2.Schroeter C, Lusk J, Tyner W. Determining the impact of food price and income changes on body weight. J Health Econ. 2008 January;27(1):45–68. doi: 10.1016/j.jhealeco.2007.04.001. [DOI] [PubMed] [Google Scholar]
- 3.Finkelstein DM, Hill EL, Whitaker RC. School food environments and policies in US public schools. Pediatrics. 2008 Jul;122(1):e251–259. doi: 10.1542/peds.2007-2814. [DOI] [PubMed] [Google Scholar]
- 4.Powell L, Chriqui J, Chaloupka F. Associations between State-level Soda Taxes and Adolescent Body Mass Index. Journal of Adolescent Health. 2009;45:S57–S63. doi: 10.1016/j.jadohealth.2009.03.003. [DOI] [PubMed] [Google Scholar]
- 5.Fletcher JM, Frisvold DE, Tefft N. The Effects of Soft Drink Taxes on Child and Adolescent Consumption and Weight Outcomes. SSRN eLibrary. 2009 [Google Scholar]
- 6.Epstein LH, Dearing KK, Paluch RA, Roemmich JN, Cho D. Price and maternal obesity influence purchasing of low- and high-energy-dense foods. Am J Clin Nutr. 2007 Oct;86(4):914–922. doi: 10.1093/ajcn/86.4.914. [DOI] [PMC free article] [PubMed] [Google Scholar]
- 7.Epstein LH, Handley EA, Dearing KK, et al. Purchases of food in youth. Influence of price and income. Psychol Sci. 2006 Jan;17(1):82–89. doi: 10.1111/j.1467-9280.2005.01668.x. [DOI] [PubMed] [Google Scholar]
- 8.French S. Pricing Effects on Food Choices. J Nutr. 2003;133:841S–843S. doi: 10.1093/jn/133.3.841S. [DOI] [PubMed] [Google Scholar]
- 9.French S, Jeffery R, Story M, et al. Pricing and Promotion Effects on Low-Fat Vending Snack Purchases: The CHIPS Study. Am J Public Health. 2001 Jan;91(1):112–117. doi: 10.2105/ajph.91.1.112. [DOI] [PMC free article] [PubMed] [Google Scholar]
- 10.Mytton O, Gray A, Rayner M, Rutter H. Could targeted food taxes improve health? J Epidemiol Community Health. 2007 Aug;61(8):689–694. doi: 10.1136/jech.2006.047746. [DOI] [PMC free article] [PubMed] [Google Scholar]
- 11.McColl K. “Fat taxes” and the financial crisis. The Lancet. 2009;373(9666):797–798. doi: 10.1016/s0140-6736(09)60463-3. [DOI] [PubMed] [Google Scholar]
- 12.Drewnowski A, Darmon N. The economics of obesity: dietary energy density and energy cost. Am J Clin Nutr. 2005 Jul;82(1 Suppl):265S–273S. doi: 10.1093/ajcn/82.1.265S. [DOI] [PubMed] [Google Scholar]
- 13.Drewnowski A, Darmon N. Food choices and diet costs: an economic analysis. J Nutr. 2005 Apr;135(4):900–904. doi: 10.1093/jn/135.4.900. [DOI] [PubMed] [Google Scholar]
- 14.Chouinard H, Davis D, LaFrance J, Perloff J. Fat Taxes: Big Money for Small Change. Fat Taxes: Big Money for Small Change. 2007;10(2):1–30. article 32. [Google Scholar]
- 15.Jacobson M, Brownell K. Small Taxes on Soft Drinks and Snack Foods to Promote Health. Am J Public Health. 2000 Jun;90(6):854–857. doi: 10.2105/ajph.90.6.854. [DOI] [PMC free article] [PubMed] [Google Scholar]
- 16.Popkin BM. The World Is Fat--The Fads, Trends, Policies, and Products That Are Fattening the Human Race. New York: Avery-Penguin Group; 2008. [Google Scholar]
- 17.Brownell J, Farley T, Willett W, et al. The Public Health and Economic Benefits of Taxing Sugar-Sweetened Beverages. N Engl J Med. 2009:1–7. doi: 10.1056/NEJMhpr0905723. hpr090572(10.1057) [DOI] [PMC free article] [PubMed] [Google Scholar]
- 18.von Braun J, Ahmed Akhter, Asenso-Okyere Kwadwo, Fan Shenggen, Gulati Ashok, Hoddinott John, Pandya-Lorch Rajul, Rosegrant Mark W, Ruel Marie, Torero Maximo, van Rheenen Teunisand, von Grebmer Klaus. High Food Prices:The What, Who, and How of Proposed Policy Actions. Washington DC: IFPRI; 2008. [Google Scholar]
- 19.WHO. Obesity: preventing and managing the global epidemic Report of a WHO consultation. 2000 [PubMed] [Google Scholar]
- 20.WHO/FAO. Expert consultation on diet, nutrition and the prevention of chronic diseases: Report of the joint WHO/FAO expert consultation. Geneva: World Health Organization; 2003. [Google Scholar]
- 21.Friedman G, Cutter G, Donahue R, et al. CARDIA: Study design, recruitment, and some characteristics of the examined subjects. J Clin Epidemiol. 1988;41:1105–1116. doi: 10.1016/0895-4356(88)90080-7. [DOI] [PubMed] [Google Scholar]
- 22.Hughes GH, Cutter G, Donahue R, et al. Recruitment in the Coronary Artery Disease Risk Development in Young Adults (Cardia) Study. Control Clin Trials. 1987 Dec;8(4 Suppl):68S–73S. doi: 10.1016/0197-2456(87)90008-0. [DOI] [PubMed] [Google Scholar]
- 23.C2ER. Council for Community and Economic Research. [September, 24, 2008]; http://www.c2er.org/
- 24.Consumer Price Index. Vol. 16. Bureau of Labor Statistics; Oct, [January 24, 2009]. http://www.bls.gov/cpi/cpiovrvw.htm. [Google Scholar]
- 25.Liu K, Slattery ML, Jacobs DR, Jr, et al. A study of the reliability and comparative validity of the CARDIA dietary history. Ethnicity Dis. 1994;4:15–27. [PubMed] [Google Scholar]
- 26.McDonald A, Van Horn L, Slattery M, et al. The CARDIA dietary history: development, implementation, and evaluation. J Am Diet Assoc. 1991 Sep;91(9):1104–1112. [PubMed] [Google Scholar]
- 27.Matthews D, Hosker J, Rudenski A, Naylor B, Treacher D, Turner T. Homeostasis model assessment: insulin resistance and beta-cell function from fasting plasma glucose and insulin concentrations in man. Diabetologia. 1985;28:412–419. doi: 10.1007/BF00280883. [DOI] [PubMed] [Google Scholar]
- 28.Jacobs D, Hahn L, Haskell W, Pirie P, Sidney S. Validity and reliability of short phsyical activity history: CARDIA and the Minnesota Heart Healthy Program. J Cardiopulmonary Rehab. 1989;9:448–459. doi: 10.1097/00008483-198911000-00003. [DOI] [PMC free article] [PubMed] [Google Scholar]
- 29.Haines P, Guilkey DK, Popkin BM. Modeling Food Consumption Decisions as a Two-Step Process. American Journal of Agricultural Economics. 1988;70(3):543–552. [Google Scholar]
- 30.Davidson A, Hinkley DV. Bootstrap methods and their application. Cambridge: Cambridge University Press; 1997. [Google Scholar]
- 31.Mincer J. Market prices, oppurtunity costs, and income effects. In: Christ CF, Friedman M, Goodman LA, et al., editors. Measurement in economics: studies in mathematical economics and econometrics in memory of Yehuda Grunfeld. Stanford, CA: Stanford University Press; 1963. [Google Scholar]
- 32.Finkelstein E, French S, Variyam JN, Haines PS. Pros and cons of proposed interventions to promote healthy eating. Am J Prev Med. 2004 Oct;27(3 Suppl):163–171. doi: 10.1016/j.amepre.2004.06.017. [DOI] [PubMed] [Google Scholar]
- 33.Chaloupka FJ, Cummings KM, Morley CP, Horan JK. Tax, price and cigarette smoking: evidence from the tobacco documents and implications for tobacco company marketing strategies. Tobacco Control. 2002 Mar;11 1:I62–72. doi: 10.1136/tc.11.suppl_1.i62. [DOI] [PMC free article] [PubMed] [Google Scholar]
- 34.Grossman M, Chaloupka FJ. Cigarette taxes. The straw to break the camel's back. Public Health Reports. 1997 Jul-Aug;112(4):290–297. [PMC free article] [PubMed] [Google Scholar]
- 35.Vartanian L, Schwartz M, Brownell K. Effects of soft drink consumption on nutrition and health: a systematic review and meta-analysis. Am J Public Health. 2007 Apr;97(4):667–675. doi: 10.2105/AJPH.2005.083782. [DOI] [PMC free article] [PubMed] [Google Scholar]
- 36.Dhingra R, Sullivan L, Jacques PF, et al. Soft drink consumption and risk of developing cardiometabolic risk factors and the metabolic syndrome in middle-aged adults in the community. Circulation. 2007 Jul 31;116(5):480–488. doi: 10.1161/CIRCULATIONAHA.107.689935. [DOI] [PubMed] [Google Scholar]
- 37.Schulze MB, Manson JE, Ludwig DS, et al. Sugar-sweetened beverages, weight gain, and incidence of type 2 diabetes in young and middle-aged women. JAMA. 2004 Aug 25;292(8):927–934. doi: 10.1001/jama.292.8.927. [DOI] [PubMed] [Google Scholar]
- 38.Duffey KJ, Gordon-Larsen P, Jacobs DRJ, Williams OD, Popkin BM. Differential associations of fast food and restaurant food consumption with 3-y change in body mass index: the Coronary Artery Risk Development in Young Adults Study. Am J Clin Nutr. 2007 Jan;85(1):201–208. doi: 10.1093/ajcn/85.1.201. [DOI] [PubMed] [Google Scholar]
- 39.Rosenheck R. Fast food consumption and increased caloric intake: a systematic review of a trajectory towards weight gain and obesity risk. Obes Rev. 2008 Mar 14;9:535–547. doi: 10.1111/j.1467-789X.2008.00477.x. [DOI] [PubMed] [Google Scholar]
- 40.Wood P, Stefanick ML, Dreon DM, Frey-Hewitt B, Garay S, et al. Changes in plasma lipids and lipoproteins in overweight men during weight loss through dieting as compared with exercise. N Engl J Med. 1988;319:1173–1179. doi: 10.1056/NEJM198811033191801. [DOI] [PubMed] [Google Scholar]
- 41.Wing RR, Koeske R, Epstein LH, Nowalk MP, Gooding W, Becker D. Long-term effects of modest weight loss in type II diabetic patients. Arch Intern Med. 1987 Oct;147(10):1749–1753. [PubMed] [Google Scholar]
- 42.Goldstein DJ. Beneficial health effects of modest weight loss. Int J Obes Relat Metab Disord. 1992 Jun;16(6):397–415. [PubMed] [Google Scholar]
- 43.Liang L, Chaloupka F, Nichter M, Clayton R. Prices, policies and youth smoking, May 2001. Addiction. 2003 May;98 1:105–122. doi: 10.1046/j.1360-0443.98.s1.7.x. [DOI] [PubMed] [Google Scholar]
- 44.Warner K. Tobacco policy in the United States: lessons for the obesity epidemic. In: Mechanic D, Rogut L, Colby D, Knickman J, editors. Policy Challenges in Modern Health Care. New Brunswick, NJ: Rutgers University Press; 2005. pp. 99–114. [Google Scholar]
- 45.Bouamra-Mechemache Z, Réquillart V, Soregaroli C, Trévisiol A. Demand for dairy products in the EU. Food Policy. 2008;33:644–656. [Google Scholar]
- 46.Barquera S, Hernandez-Barrera L, Tolentino M, et al. Energy from beverages is on the rise among Mexican adolescents and adults. American Journal of Clinical Nutrition. 2008 doi: 10.3945/jn.108.092163. [DOI] [PubMed] [Google Scholar]
- 47.Huang KS. Nutrient Elasticities in a complete food demand system. Am J Agric Econ. 1997;78:21–29. [Google Scholar]
- 48.Huang K, Bouis H. Structural changes in the Demand for Food in Asia” Food, Agriculture and the Environment discussion paper 11. Washington DC: International Food Policy Research Institute; 1996. [Google Scholar]
- 49.Wu Y, Li E, Samuel N. Food consumption in urban China: an empirical analysis. Applied Economics. 1995;27(n6):509. 507. [Google Scholar]
- 50.Burns C, Sacks G, Gold L. Longitudinal study of Consumer Price Index (CPI) trends in core and non-core foods in Australia. Aust N Z J Public Health. 2008;32(5):450–453. doi: 10.1111/j.1753-6405.2008.00278.x. [DOI] [PubMed] [Google Scholar]
- 51.Christian T, Rashad I. Trends in U.S. food prices, 1950-2007. Econ Hum Biol. 2009 Mar;7(1):113–120. doi: 10.1016/j.ehb.2008.10.002. [DOI] [PubMed] [Google Scholar]
Associated Data
This section collects any data citations, data availability statements, or supplementary materials included in this article.