

Abstract
Background
MicroRNAs expression is deregulated in acute myeloid leukemia, but the corresponding functional microRNA-controlled pathways are poorly understood. Integration of mRNA and microRNA expression profiling may allow the identification of functional links between the whole transcriptome and microRNome that are involved in myeloid leukemogenesis.
Methods
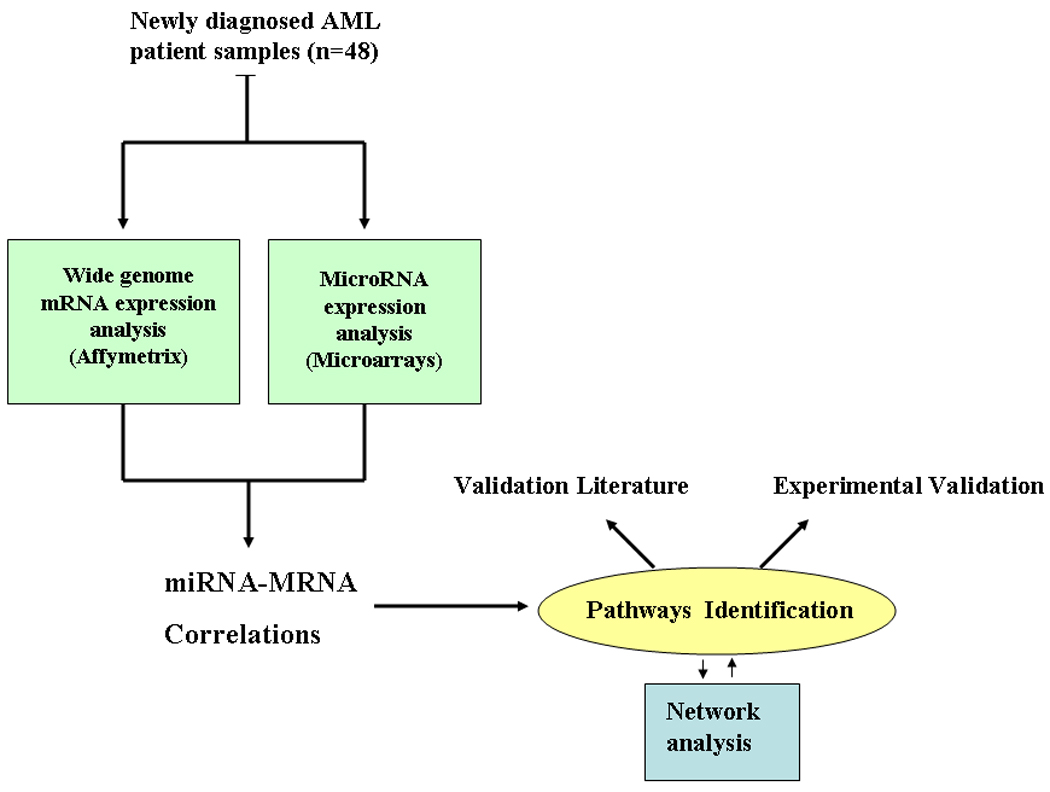
Therefore, here we integrated microRNA and mRNA expression profiles obtained from 48 newly diagnosed acute myeloid leukemia patients by using two different microarray platforms and performed correlation, gene ontology and network analysis. Experimental validation was also performed in acute myeloid leukemia cell lines using microRNA mimics oligonucleotides and functional assays.
Results
Our analysis identified a strong positive correlation of HOX related genes with miR-10 and miR-20a. Furthermore, we observed a negative correlation between miR-181a and -181b, -155 and -146 expression with that of genes involved in immunity and inflammation (e.g. IRF7 and TLR4) and a positive correlation between miR-23a, miR-26a, miR-128a and miR-145 expression with that of pro-apoptotic genes (e.g., BIM and PTEN). These correlations were confirmed by gene ontology analyses, which evidenced the enrichment of members of the homeobox, immunity and inflammation and apoptosis biologic process, respectively. Furthermore, we validated experimentally the association of miR-145, miR-26a and miR-128a with apoptosis in acute myeloid leukemia.
Conclusions
Our results indicate that by integrating the transcriptome and microRNome in acute myeloid leukemia cells is possible to identify previously unidentified putative functional microRNA-mRNA interactions in acute myeloid leukemia.
Keywords: microRNA, networks, AML, microarrays
Introduction
MicroRNAs (miRNAs) are small non-coding RNAs of 18–25 nucleotides in length that regulate gene expression by repressing translation and/or accelerating mRNA decay.1 MiRNAs are involved in critical biological processes, including development, cell differentiation, apoptosis, proliferation and hematopoiesis.2–5 Previous data indicate that miRNAs are deregulated in diseases, such as dementia, heart disease and cancer.6–8 Recently, five large scale studies reported distinctive miRNA expression signatures associated with cytogenetics and molecular abnormalities and outcome in acute myeloid leukemia (AML).9–15 Up-regulation of miR-155 and miR-10a and -10b have been described in cytogenetically normal (CN)–AML with FLT3-ITD and nucleophosmin mutations respectively.9–10 Over-expression of miR-181 family members has been found up-regulated in CN-AML with CEBPA mutations and associated with good outcome in high risk CN-AML, independent from FLT3-ITD or CEBPA mutation status.11–12 Concerning recurrent chromosomal abnormalities, translocations involving the mixed lineage leukemia (MLL) gene in 11q23, are associated with a distinctive miRNA signature that includes up-regulation of miR-191 and down-regulation of miR-29 family members.9 Likewise, up-regulation of miR-126 have been described in patients with core binding factor leukemias, such as t(8;21) and inv16 and in those with CN-AML over-expressing MN1, which impact negatively on outcome.13–14,16
Despite this progress, the functions of most of the deregulated miRNAs in AML are currently unknown. A critical step in that direction is to identify the target genes and pathways that are deregulated by miRNAs during leukemogenesis. However, this has been proven to be a difficult task, since miRNAs are predicted to control ~20–30% of the human genome and a single miRNA can regulate a large number of target genes and multiple miRNAs may regulate the same target.1 Recently, a novel approach has been developed to identify pathways regulated by miRNAs by integrating miRNA with mRNA expression profiles obtained using high–throughput platforms, such as microarrays.17–21 Nielsen et al, integrated miRNA and mRNA expression in neuronal rat progenitors during embryonic differentiation and identify regulatory networks underlying the onset of cortical neurogenesis.17 Liu et al analyzed miRNA and mRNA expression profiles obtained using qRT-PCR and microarrays respectively, from 12 human brain tumors biopsies and inferred and validated a tumor suppressor pathway linked to miR-181c.18
Therefore, to discover relevant functional miRNA-mRNA relationships in AML, here we integrate miRNA and mRNA expression profiles obtained from newly diagnosed AML patients by using two different microarray platforms and performed correlation, gene ontology and network analysis. The integration of a whole genome approach including non–coding RNAs may lead to an improved understanding of AML biology and identified novel targets for treatment.
Design and Methods
Patient’s samples
Frozen diagnostic bone marrow (BM) or peripheral blood (PB) samples were obtained from 48 adult newly diagnosed AML patients from the MD Anderson Tissue bank. Patient’s samples were prepared by Ficoll-Hypaque (Nygaard) gradient centrifugation, enriched for leukemic cells by CD3/CD19 depletion using MACS (Miltenyi Biotech, Auburn, CA) and cryopreserved as previously described.9 Cytogenetic analyses of the samples were performed at diagnosis, using unstimulated short-term (24-, 48-, and 72-hour) cultures with or without a direct method and G-banding. The criteria used to describe a cytogenetic clone and description of karyotype followed the recommendations of the International System for Human Cytogenetic Nomenclature.22 At least 20 bone marrow metaphase cells were analyzed in patients designated as having a normal karyotype. FLT3-ITD, activation loop D835 and NPM1 mutations analysis was performed as previously described.10 All patients gave inform consent for cryopreservation and use of the samples for molecular studies. Approval was obtained from the institutional board review from the MD Anderson Cancer Center.
Microarray experiments
Total RNA was extracted using tryzol reagent (Invitrogen). The integrity of these total RNAs was assessed using an Agilent 2100 bioanalyzer. Five micrograms of total RNA was hybridized on the custom microarray chip (OSUCCC miRNA microchip version 3.0). This array contains around 1,100 probes (including 345 human and 249 mouse miRNA genes spotted in duplicate). For the gene expression profilings, 2–3 micrograms of RNA was analyzed by Affymetrix U133 plus 2.0 GeneChips (Santa Clara, CA). All the microarray experiments were completed in triplicate.
Data analysis
MiRNA microarray images were analyzed using GENEPIX PRO. Average values of the replicate spots of each miRNA probe were background subtracted; log2 transformed and normalized using the global median using and the BRB array tools (http://linus.nci.nih.gov/BRB-ArrayTools.html). A filtering step was performed to remove probe sets that did not show significant variation across the samples: a probe was excluded if less than 20 % of expression data have at least a 1.5 -fold change in either direction from gene's median value or the percent of data missing or filtered out exceeds 50 %. For the Affymetrix experiments, Cel. Files generated by the GeneChip scanner were imported to the BRB software tools. GCRMA procedure was used for background subtraction and normalization. A filtering step was performed as described for miRNAs. To identify mRNAs- miRNAs correlations, we performed quantitative trait analysis (Spearman correlation test) using the BRB tools. To asses whether certain biological terms were enriched or over-represented in a signature, we used the Database for Annotation, Visualization and 7 Integrated Discovery (DAVID) http://david.abcc.ncifcrf.gov/.23 An overrepresented term is one that has more associated genes (also referred to as members) in the gene-expression signature than is expected by chance. DAVID provides a rapid means to reduce large lists of genes into functionally related groups of genes to help unravel the biological content captured by high throughput technologies. DAVID resources provide not only the typical gene-term enrichment analysis (Gene-Ontology), but also new tools and functions that allow users to condense large gene lists into gene functional groups. In our analysis, we used high classification stringency and considered only terms that have P<0.01, after permutation corrections (Benjamini). We excluded from the analysis miR-29a and -29b, which are associated with CN-AML wt-NPM1, MLL translocation and chromosome 7 monosomy, because miR-29/mRNA correlations has been reported elsewhere by our group.24All the analyses were performed using BRB-ArrayTools version 3.6.0 (R. Simon and A.P. Lam, National Cancer Institute, Bethesda, MD) and using the R version 2.3.1 (R Foundation for Statistical Computing, Vienna, Austria) (Fig. 1 show an overflow of the experimental strategy). Network analysis was performed using Osprey.25
Figure 1. Study Schema and workflow.
Target prediction analysis
Mainly two web databases of miRNA target prediction were used in this study: TargetScan (release 5.1)26 and PicTar.27
In vitro transfection with synthetic miRNAs
The synthetic miR-145, miR-128a, miR-26a and scrambled oligonucleotide (control), were purchased from Ambion (Austin, TX). Four millions of K562 cells and KG-1a (ATCC, Manassas, VA) were nucleoporated using AMAXA (Solution V, Program T016) (Gaithersburg, MD) with 5 ug of precursor oligonucleotide and 0.5 ug GFP plasmid in a total volume of 10 ml. These cell lines were used because they exhibit low levels of these miRNAs (Data not shown).
Real-time quantification of miRNAs
The single tube TaqMan miRNA assays were used to detect and quantify mature miRNAs as previously described using PCR 9700 Thermocycler ABI Prism 7900HT and the sequence detection system (Applied Biosystems, Foster City, CA).28 Expression normalization was performed with U44. Comparative real-time PCR was performed in triplicate, including no-template controls. Relative expression was expressed as 2ΔCt.
Apoptosis experiments
To demonstrate that selected miRNAs induces apoptosis, we transfected or infected miRNA mimics or scrambled oligonucleotides into K562 and KG-1a cells and measured Annexin V/Propidium iodide (PI) stain (BD Pharmingen, San Diego, CA) at 24 hours after transfection using Flow cytometry.
Western blotting
Total protein extracts from K562 and KG-1a cells transfected with synthetic miRNA mimics and scrambled oligonucleotides were extracted using RIPA buffer (SIGMA, St Louis, MO). Protein expression was analyzed by Western blotting using Bim, Foxo3a and Pcaf antibodies (Santa Cruz, Santa Cruz, CA). Loading control was performed using β-Actin and Vinculin.
Results
Correlations of miRNA and mRNA expression profiles
Our first task was to generate a genomic wide database of miRNA and mRNA expression using samples from newly diagnosed AML patients. Patient characteristics are shown in Table 1. Total RNA was obtained from bone marrow or peripheral blood leukemic blasts and used for gene and miRNA expression profiling. Altogether, 17,531 gene probe sets and 402 miRNA probes were available for further analysis. The miRNA and mRNA expression profiles were then integrated to identify functional relationships that may contribute to AML. In order to achieve this goal, we performed correlations of expression profiles between miRNAs and mRNAs. Instead of performing correlation with all miRNAs, we focus on miRNAs whose expression levels changed the most across the AML subtypes. Thus, we selected miRNAs that are part of signatures associated with cytogenetics, molecular subtypes and outcome in AML.9–16 Since, most of the patients in our cohort have CN-AML, we selected miRNAs that are associated with the different molecular subgroups of CN-AML, such as: miR-10a, miR-10b, miR-145, miR-146a, miR-196a, miR-204, miR-23a, miR-26, miR-128a, miR-125a, miR-130a, let-7a, miR-15a, miR-16, miR-17, miR-20a, miR-106a and miR-25 (NPM1 mutated signature)10,13; miR-181a, miR-181b (CEBPA signature and outcome11–12); miR-155 (FLT3-ITD signature9–10,13–14). In addition we selected miR-126, miR-223 which has been deregulated in core binding factor leukemias (t(8;21) and inv16) and in CN-AML with MN1 mutations13–14,16 and miR-191, miR-326, miR-21 and miR-199a which are associated with MLL translocations and outcome.9 We next asses the relationship in the expression for each selected miRNA with the expression of the 17,521 gene probe sets in the 48 primary AML samples by using Spearman correlation analysis within the BRB tools. In table 2, we report the numbers of probes that correlate positively and negatively with the selected miRNAs at the level of significance of P<0.01 (Spearman) and a false discovery rate (FDR) value <0.01. The most frequently involved miRNA was miR-17-5p, which correlated with 4694 gene probe sets (about 26% of all gene probes). Since some of the Affymetrix probes detect miRNA expression (i.e. miR-155 probe) we used them as quality controls. The miR-155 Affymetrix probe expression value was indeed positively correlated with the miR-155 expression value detected by miRNA microarrays ((correlation coefficient) cc=0.64, P<0.001).
Table 1.
Patient Characteristics.
| Value | |
|---|---|
| Age | |
| Median | 59.1 |
| Range | 23–81 |
| Sex. No. % | |
| Female | 16 (33) |
| Male | 32 (67) |
| Bone marrow blasts (%) | |
| Median | 61.3 |
| Range | 25–94 |
| FAB-No. % | |
| M0–M1 | 8(16) |
| M2 | 7(14) |
| M3 | 4(9) |
| M4–M5 | 26(54) |
| Unknown | 3(7) |
| Cytogenetics-No % | |
| Normal Karyotype | 32(69) |
| FLT3-ITD | 12 |
| FLT3-TDK | 7 |
| NPM1 | 20 |
| inv16 | 2 (4) |
| t(11q23) | 8 (13) |
| t(8;21) | 1 (2) |
| t(15;17) | 4 (9) |
| del9q | 1 (2) |
Table 2.
Correlation between miRNAs and mRNAs in AML.
| Number of genes | |||
|---|---|---|---|
| miRNA | Positive correlation |
Negative correlation |
Total number of genes |
| let-7a | 220 | 220 | 440 |
| miR-10a | 700 | 375 | 1075 |
| miR-10b | 1097 | 871 | 1968 |
| miR-15a | 95 | 148 | 243 |
| miR-16-1 | 721 | 491 | 1212 |
| miR-17-5p | 3094 | 1600 | 4694 |
| miR-20a | 145 | 182 | 327 |
| miR-21 | 85 | 347 | 432 |
| miR-23a | 1326 | 2348 | 3674 |
| miR-25 | 783 | 1307 | 2090 |
| miR-26a | 987 | 1311 | 2298 |
| miR-30a | 520 | 65 | 585 |
| miR-106a | 79 | 195 | 274 |
| miR-126 | 1117 | 1694 | 2811 |
| miR-128a | 857 | 1776 | 2633 |
| miR-130a | 709 | 967 | 1676 |
| miR-145 | 1075 | 2738 | 3813 |
| miR-146 | 1129 | 1391 | 2520 |
| miR-155 | 252 | 182 | 434 |
| miR-181a | 1195 | 522 | 1717 |
| miR-181b | 1469 | 1201 | 2670 |
| miR-191 | 608 | 461 | 1069 |
| miR-196a | 1394 | 2959 | 4353 |
| miR-199a | 668 | 1668 | 2336 |
| miR-204 | 107 | 107 | 214 |
| miR-221 | 452 | 446 | 898 |
| miR-222 | 2736 | 1514 | 4250 |
| miR-223 | 269 | 166 | 435 |
| miR-326 | 110 | 130 | 240 |
Identification of functional pathways associated with miRNA expression
To discover functional relationships between miRNAs and the transcriptome and uncover the gene pathways that are regulated by miRNAs in AML we performed gene annotation enrichment analysis using DAVID.23 This method provides a rapid means that categorizes large lists of genes into functionally related groups of genes thereby helping in unraveling the biological content captured by genome-wide transcriptome profiling. Table 3 and 4 lists the most significant biological processes, according to David, associated with the miRNA associated gene expression signatures. We found a significant over-representation of HOX genes, in particular HOXB and A clusters, among the genes that correlated positively with miR-20a and the HOX embedded miRNAs; miR-10a and -10b (Table 3). Furthermore, we observed a negative correlation between miR-181a and -181b and miR-155 expression with genes involved in immunity and miR-146a, -221, -25 and -199a with genes involved in inflammatory response (Table 4). MiR-23a, miR-145, miR-196a, miR-128a and miR-26a expression were positively correlated with pro-apoptotic genes such as PTEN, BIM, PDCD and several caspases (Table 3). Mir-23a and -196a were also positively correlated with genes involved in myeloid differentiation while miR-191, miR-222 and miR-17 were negatively correlated with genes involved in erythroid differentiation (Table 3 and 4). The following miRNAs; miR-17, miR-191, miR-222 and miR-181b were positively correlated with chromatin modifiers genes such as histone demethylating genes (Jumonji 1a), histone acetylators (p300/CREB/GCN5) or histone deacetylators (Sirtuin or HDAC4) (Table 3). MiR-196a, miR-23a, miR-145 and miR-126 were negatively correlated with genes involved in epigenetics (Table 4). Altogether, the data indicate an enrichment in homeobox, immunity and inflammation, apoptosis and chromatin modification biologic process among the mRNAs significantly correlated to distinctive miRNAs in AML.
Table 3.
Functional pathways analysis of positively correlated genes.
| David pathways (GO, Interpro) | |||||
|---|---|---|---|---|---|
| miRNA | Positive correlation | P-value | Benjamini | Gene N0* |
Gene ID |
| Let-7a | RNA binding | 8.70E-06 | 9.20E-03 | 20 | PRKA, HNRPM, RBM26, EIF3B, DDX24, SPEN |
| miR-10a | Homeobox | 6.90E-09 | 2.00E-05 | 23 | HOXB2,HOXB3,HOXB4,HOXB5, HOXB6, PBX3 |
| miR-10b | Homeobox | 2.30E-12 | 1.40E-09 | 25 | HOXB2,HOXB3,HOXB4,HOXB5, HOXB6, PBX3 |
| miR-15a | None | ||||
| miR-16-1 | None | ||||
| miR-17-5p | Chromatin modification | 7.10E-13 | 2.70E-10 | 54 | PCAF, WHSC1, HDAC9, JHMDH2, NCOR1 |
| miR-20a | Homeobox | 8.00E-16 | 4.60E-12 | 10 | HOXB4, HOXB5, HOXB6, HOXA3,HOXA4-A7 |
| miR-21 | None | ||||
| miR-23a | Apoptosis | 3.10E-14 | 1.80E-11 | 91 | PTEN, BIM, DIDO1, FOX03, PPP1R15a, BCL2L13 |
| Myeloid cell differentiation | 1.20E-04 | 7.50E-03 | 9 | CEBPB, CSF1, CEBPG, FOX03, SP3, JAG1 | |
| miR-25 | none | ||||
| miR-26a | Apoptosis | 1.90E-07 | 3.20E-05 | 60 | PTEN, PP2A, DIDO1, HSPA1A, PDCD4, PAWR |
| miR-30a | mRNA processing | 3.80E-08 | 6.90E-05 | 20 | CDC5, FIP1L1, WTAP, PAPOLA, DXH35, HNRPH1 |
| RNA Binding | 4.50E-11 | 3.90E-09 | 41 | FXR1, PDCD4, RBM22, DIS3, DHX9, EIF2AK2 | |
| miR-106a | None | ||||
| miR-126 | none | ||||
| miR-128a | Apoptosis | 2.90E-08 | 7.90E-06 | 57 | PTEN, CD28, FOX03A, DIDO1, TP53BP2, PHF17 |
| miR-130a | Zinc finger | 3.80E-08 | 2.80E-05 | 46 | SP4,WT1, ZEB1, FOXP1, ZNF395, ZNF273-4 |
| miR-145 | Apoptosis | 2.90E-14 | 1.50E-10 | 81 | PRKAA1, PTEN, FOX03A, BIM, DIDO1, BCL2L13 |
| miR-146 | Regulation of transcription | 1.80E-12 | 9.60E-10 | 129 | Aebp1, E2f5, RYBP, WT1, ETV6, RUNX1 |
| miR-155 | none | ||||
| miR-181a | Regulation of transcription | 1.70E-14 | 4.50E-11 | 155 | GATA2, SLA2, MLL, PIA2, FOXP1, CHD9 |
| miR-181b | Chromatin modification | 4.50E-05 | 1.10E-02 | 15 | SET, JHMDH1,ASH1, RCC1, MYST4, TLK1 |
| miR-191 | Chromatin modification | 2.00E-09 | 1.30E-06 | 23 | MLL3, MYST4, NCOR1, HDAC4, HDAC9, EHMT2 |
| miR-196a | Apoptosis | 6.20E-13 | 4.10E-10 | 90 | PTEN, BAG4, PPARD, TP63, FXR1, CKAP2 |
| miR-199a | Regulation of transcription | 5.40E-06 | 3.20E-03 | 80 | GATA3, MAX, RORA, FOXP1, ERG, AML1 |
| miR-204 | None | ||||
| miR-221 | None | ||||
| miR-222 | Chromatin modification | 2.70E-08 | 1.40E-05 | 27 | MCBD3, EHMT2, SET, HELLS, H2AFY, SMYD3 |
| miR-223 | RNA binding | 1.20E-07 | 6.50E-05 | 26 | UMHK1, HINT3, UNC13D, SFRS6, SFRS11, GRAP |
| miR-326 | None | ||||
number of genes enriched for that pathway
Table 4.
Functional pathways analysis of negatively correlated genes.
| David pathways (GO, Interpro) | |||||
|---|---|---|---|---|---|
| miRNA | Negative correlation | P-value | Benjamini | Gene N0 |
Gene ID |
| Let-7a | None | ||||
| miR-10a | none | ||||
| miR-10b | Gtpase activator activity | 4.10E-07 | 1.20E-03 | 28 | AKAP13, TBC1D10, TRIO, PSD3, NUP62 |
| miR-15a | Zinc finger region C2H2 | 1.50E-08 | 6.40E-06 | 12 | ZFP225, FFP227, ZFP45, ZPF600, ZFP85 |
| miR-16-1 | none | ||||
| miR-17-5p | Hematopoiesis | 4.20E-05 | 3.50E-03 | 27 | TAL1,SP3, CEBPB,CSF1, AHSP, FOX03A |
| Apoptosis | 3.80E-15 | 2.00E-11 | 103 | BIM, PTEN,CXCR4, PLAGL2, DEDD,STK38 | |
| miR-20a | None | ||||
| miR-21 | Krueppel-box (Zinc Finger) | 4.90E-15 | 1.90E-12 | 29 | ZFP141, ZFP192, ZFP304, ZFP253, ZFP606 |
| Cell cycle | 2.70E-11 | 1.50E-08 | 41 | E2F8, CDC25, CDCA2, CDCA8, NPM1,RIF1 | |
| Mitosis | 3.60E-12 | 2.00E-10 | 20 | KIF11, CENPF, CENPE, HELLS, EB1, KNTC1 | |
| miR-23a | Chromatin modification | 1.60E-08 | 2.70E-06 | 39 | NCOR1,CHD9, JARID1A, HDAC4, TTF, DOT1L |
| miR-25 | Immune response | 1.00E-09 | 5.30E-07 | 77 | Ltb4r, NFAM1, BCL6, MYD88, CCR2, LY86 |
| Hematopoiesis | 6.70E-05 | 1.10E-02 | 21 | STAT5b, KLF6, JAK2, SP1, ITPKB, DLL4 | |
| miR-26a | None | ||||
| miR-30a | None | ||||
| miR-106a | None | ||||
| miR-126 | Chromatin modification | 5.10E-06 | 1.10E-03 | 29 | CHD9, SUV42C, CHD6, Men1, CBX7, CHD3 |
| miR-128a | Gtpase activator activity | 1.90E-07 | 7.70E-05 | 38 | ARF6, SH2B2, CRK, TBC1D14, ARHGAP27 |
| miR-130a | Lysozome | 3.89E-09 | 1.40E-06 | 28 | CD1B, GM2a, CTSL1, CTSL1, IGF2R, CXCR2 |
| miR-145 | Chromatin modification | 1.60E-07 | 2.90E-05 | 46 | SIRT2, JMID2b, TAF6L,BPTF, MEN1, HIRA |
| miR-146 | Inflammatory response | 1.40E-10 | 1.20E-07 | 42 | TLR4, CCl23, Ltb4r, LYZ, IL8RB, MYD88 |
| miR-155 | Immune response | 3.10E-06 | 1.60E-02 | 23 | SHIP-1, CD2, FYB, PRAM1, CD1C, IRF7 |
| miR-181a | Immune response | 7.50E-07 | 4.00E-03 | 31 | IL1RN, BCL-6, CCR1, PTAFR, FN1, CCL2 |
| miR-181b | Immune response | 2.80E-06 | 3.00E-03 | 35 | TLR5, TLR8, LTb4r, IL6R, TNFSF1 |
| miR-191 | Erythrocyte differentiation | 2.20E-12 | 2.30E-09 | 10 | KLF1, ETS1, TAL1, EPB42, HBA1, HBB |
| miR-196a | Chromatin modification | 8.90E-10 | 1.90E-07 | 46 | JARID1B, ASH1L, BRD8, RSF1, TAF6L |
| miR-199a | Inflammatory response | 1.20E-06 | 7.60E-04 | 28 | CCR5, CCR9, CARD12, TLR5, TLR8,PTAFR |
| miR-204 | None | ||||
| miR-221 | Inflammatory response | 3.60E-11 | 1.90E-07 | 26 | NFAM1, Ltb4r, CR1, LTA4H, TLR4, BCL6 |
| miR-222 | Erythrocyte differentiation | 1.70E-06 | 8.70E-03 | 9 | TAL1, EPB42, ETS1, HBB, HBA1, HBD |
| miR-223 | None | ||||
| miR-326 | Mithocondrium | 7.50E-08 | 1.00E-05 | 22 | CYCS, MRPL1, MRPL19, NDFIP2 |
Validation of the functional pathways analysis
To further test whether the functional pathways associated to specific miRNAs could be reproduced experimentally “in vitro”, we carried out validation experiments using miRNAs involved in the apoptosis pathway i.e. miR-145, miR-128a and miR-26a. Furthermore, no functional data of these miRNAs have been reported in AML. Based on the miRNA-mRNA profiling integration analysis, miR-145, miR-128a and miR-26a expression were positively associated with pro-apoptotic genes such as BIM29 and Forkhead box O3 (FOXO3A)30 (Table 3), suggesting that these miRNAs could induce apoptosis in AML. To confirm this hypothesis, we ectopically over-expressed synthetic miR-145, miR-128a and miR-26a oligonucleotides (ODs) or scrambled ODs into K562 and KG-1a human myeloid cell lines (Fig. 2) and examined apoptosis by measuring Annexin V/propidium iodine expression using flow cytometry at 24 hours. We observed that miR-145, miR-128a and miR-26a enhanced apoptosis by 1.9, 1.35 and 2 fold, respectively in the K562 cell line and by 1.4, 1.6 and 1.3 fold, respectively with respect to the controls (scrambled ODs) in KG-1a cells (Fig. 3A and B). Next, we asked whether the apoptotic effects observed after over-expression of the miR-145, miR-26a and miR-128a in leukemic cell lines are associated with up-regulation of pro-apoptotic protein expression levels, in particular to those whose gene expression was positively correlated to the selected miRNAs. We then selected the pro-apoptotic protein Bim (because of its critical role in apoptosis regulation)29 and its expression was positively correlated with miR-145 (cc=0.46, P=0.0009) and the pro-apoptotic Foxo3a30, whose gene expression positively correlated with miR-145 (cc=0.49, P=0.0004), miR-26a (cc=0.65, P=9e-07) and miR-128a (cc=0.5, P=0.0002) in 48 newly diagnosed primary AML patients. Over-expression of miR-145 resulted in a higher Bim protein expression in K562 and KG-1a cells compared with the control (Fig. 3C), while no changes were observed for miR-26a and miR-128a at 72 hours (both miRNAs did not have any correlation with Bim in primary AML samples) (Data not shown). Over-expression of miR-128a and miR-26a resulted in up-regulation of Foxo3a in K562 cells, while no changes were observed for miR-145 and miR-26a in KG-1a cells (Fig. 3D). Last we investigated whether we could validate miRNA-mRNA interactions within the chromatin modification pathway. We selected the top negatively correlated gene with miR-145, the histone acetylator P300/CBP-associated factor (PCAF)31 (cc=−0.71, P=1e-07) and performed immunoblotting analysis after miR-145 or scrambled oligonucleotides transfection in K562 and KG-1a cells. Over-expression of miR-145 induced down-regulation of Pcaf protein expression at 72 hours after transfection with respect to the control in both cell lines (Fig. 3E).
Figure 2. Expression levels of selected miRNAs and transfection efficiency after ectopic synthetic miRNA oligonucleotide nucleoporation in AML cell lines.
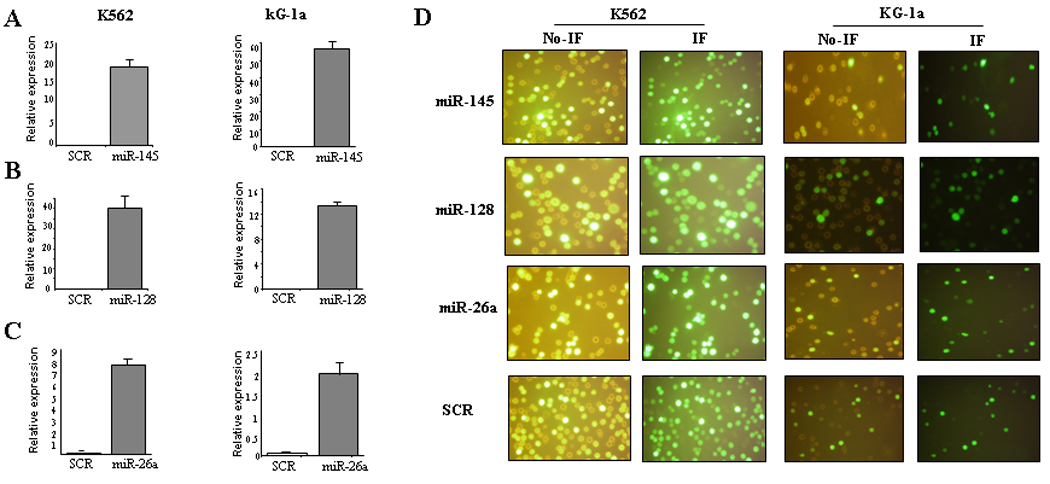
Relative expression of miR-145, miR-128a, miR-26a (A, B, and C) in K562 and KG-1a cells after over-expression of synthetic miRNAs (miR-145, miR-128a and miR-26a) or scrambled oligonucleotides (SCR). The results are shown as relative expression after 2ΔCt calculations. (D) Representative images of K562 and KG-1a cells co-transfected with scrambled-GFP and selected miRNAs-GFP. The images were obtained using a Nikon Eclipse 800 microscope with filter sets for collection of fluorescent images from GFP. Images were captured with a film-based camera. Processing/analysis of images were performed using the MetaMorph software package (Universal Imaging, Inc.). The images in the left panel are from direct microscopy and the images from the right are obtained using the FITC filter (Immunofluoresence(IF)).
Figure 3. Experimental validation of miRNAs associated with apoptosis pathway.
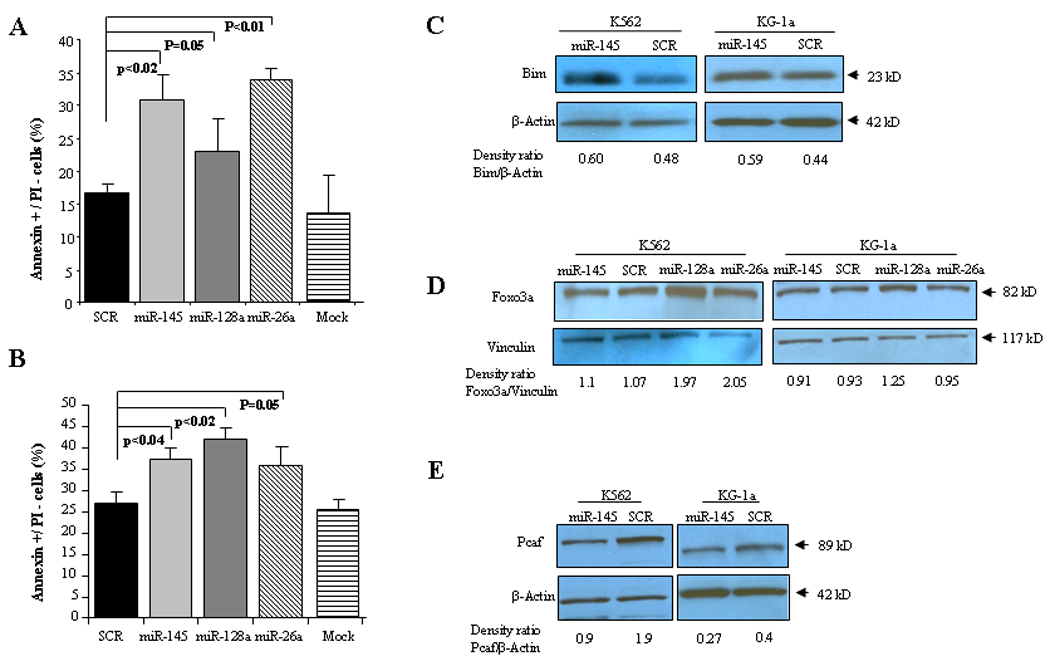
A) Annexin V/PI staining in K562 cells after 24 hours of transfection with water (mock), scrambled oligonucleotides (SCR), miR-145, miR-128a or miR-26a. Bar represents SD± from three independent experiments. B) Annexin V/PI staining in KG-1a cells after 24 hours of transfection with water (mock), scrambled oligonucleotides (SCR), miR-145, miR-128a or miR-26a. Bar represents SD± from three independent experiments. P-values were obtained by using t-test. C) Immunoblotting for Bim in K562 and KG-1a cells after 72 hours of transfection with miR-145 or scrambled oligonucleotides (SCR). D) Immunoblotting for Foxo3a in K562 and KG-1a cells after 72 hours of transfection with miR-145, miR-128a, miR-26a or scrambled oligonucleotides (SCR). E) Immunoblotting for Pcaf in K562 and KG-1a cells after 72 hours of transfection with miR-145 or scrambled oligonucleotides (SCR). Loading control was performed with β-Actin. Densitometry for each band was performed as per methods section and results are shown as a density ratio between target protein/β-Actin.
Network analysis
To determine whether different miRNAs within a signature interact with the same target genes, we performed network analysis using Osprey, which is software platform for visualization of complex interaction networks.25 First, we examined apoptosis and focus on the miRNAs, whose expression was correlated positively with this term; miR-145, miR-128a, miR-23a, miR-26a and miR-196a. As shown in Figure 4A, network analysis identified that most of the transcripts are associated with more than one miRNA, suggesting a combinatorial effect in gene regulation by co-expressed endogenous miRNAs in AML. We also performed network analysis using miRNAs negatively correlated with chromatin modification genes such as; miR-145, miR-126, miR-196a and miR-23a. Similar to the apoptosis network analysis, miRNAs associated with chromatin modification pathways were correlated with the same cluster of transcripts (Fig. 4B). Last we perform network analysis using immune system/inflammation enriched miRNA-mRNA interaction pairs and identified transcripts, like leukotriene B4, NFAT activating molecule 1 and several Toll like receptor (TLR) genes, that were associated with more than one miRNA such as miR-221, miR-181b, miR-146a, miR-155 and miR-199a (Fig. 4C). Altogether, our results suggest that a small group of miRNAs coordinately regulates a pathway transcriptome by modulating the same group of genes within the pathway.
Figure 4. Network Analysis in AML.
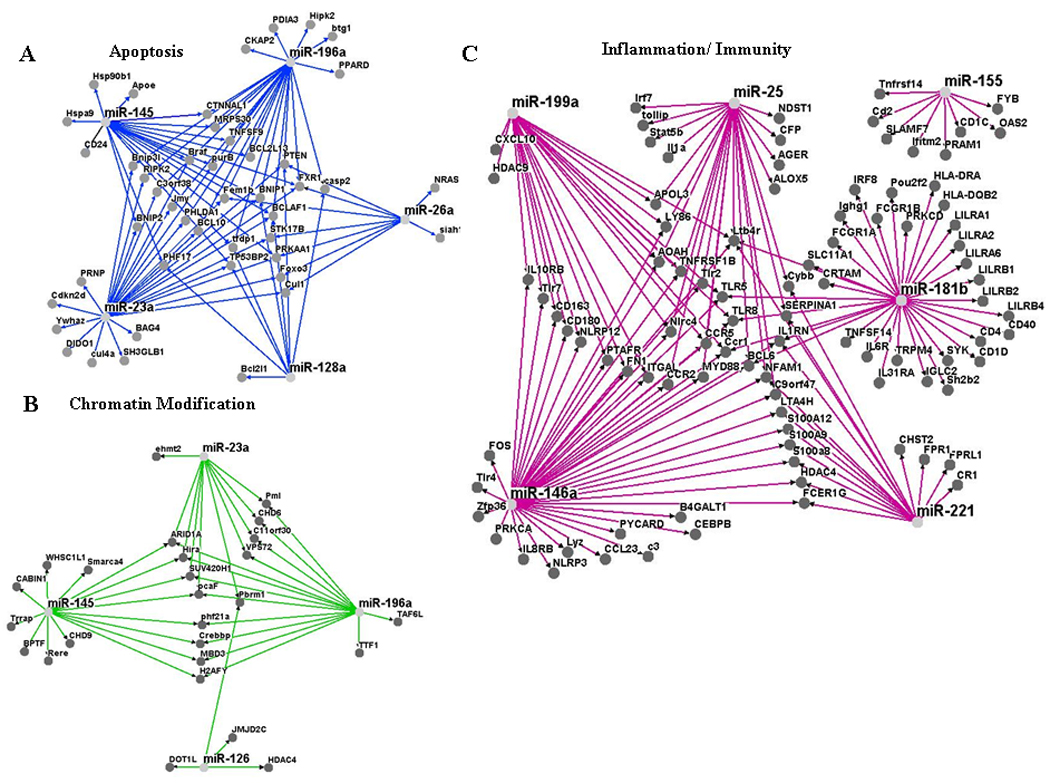
A) Apoptosis network analysis using miRNAs that positively correlated with pro-apoptosis transcripts. B) Chromatin Modification network analysis using miRNAs that negatively correlated with chromatin modification related genes. C) Inflammation/Immunity network analysis using miRNAs that negatively correlated with inflammatory/immune related genes. All the network analysis were performed using Osprey.25
Discussion
Our study indicate that by correlating data from two different platforms that allow assessment of genome-wide gene and miRNA expression profiles, putative functional miRNA-mRNA interactions could be identified in AML samples. These interactions appear to take place within pathways controlling hematopoiesis, innate immunity, apoptosis and chromatin remodeling. Many of these interactions have been experimentally validated in other tumors or disease models. For example, both miR-221 and miR-222, have been shown to negatively regulate erythroid differentiation by targeting the oncogene c-KIT.32 Consistent with the literature, we found that miR-222 is inversely correlated with genes involved in erythroid differentiation. The strong association of the HOX embedded miR-10a and miR-10b with HOX genes was also previously reported 9–10.
Concerning miRNAs correlated positively with apoptosis in our study (Table 3), miR-145 has been described to exhibit pro-apoptotic effects in breast and bladder cancer cells.33–34 The pro-apoptotic effects of miR-145 in breast cancer are dependent on TP53 activation, and TP53 activation can, in turn, stimulate miR-145 expression, thus establishing a death-promoting loop between miR-145 and TP53.33 We further validated this findings experimentally “in vitro” by transiently over-expressing miR-145 in AML cell lines. We found that miR-145 induced apoptosis and increased the expression of the pro-apoptotic protein Bim29, whose gene correlated positively in primary AML samples. Though, BIM is regulated by miR-145, it does so indirectly since there are no predicted sites for direct miRNA-mRNA interaction.26–27
Two other miRNAs involved in the pro-apoptotic signature, miR-23a and miR-26a, when over-expressed, they induced apoptosis in human embryonic kidney cells and liver cancer cells, respectively.35–36 Furthermore, miR-26a has been shown to exhibits potent anticancer effects in a MYC-driven liver cancer mouse model.36 We also validated “in vitro” the pro-apoptotic effects of miR-23a, miR-26a and miR-128a in two myeloid leukemic cell lines and measured the pro-apoptotic protein Foxo3a, whose mRNA was positively correlated with the above miRNAs in primary AML samples. While we observed increase of Foxo3a after miR-128a and miR-26a transfection in K562 cells, no changes were observed for miR-145. We also observed no Foxo3a expression changes after miR-145 or miR-26a in KG-1a, while miR-128a resulted in a minor increase in the Foxo3a protein level. This result underscores the limitations of using cell lines for validation of primary AML samples. It is probable that many miRNA-mRNA interactions occurs only in the context of certain cytogenetics and molecular subtypes of AML and could not be reproduced by artificially manipulating miRNA expression in selected cell lines.
The link between miR-155, miR-181 and miR-146 with immunity and inflammation is well documented, including in AML.12,37–40 Two knockout mouse models have demonstrated the critical role of miR-155 in immunity: BIC/miR-155−/− mice have defective dendritic cell functions, impaired cytokine secretion, and Th cells intrinsically biased toward Th2 differentiation.37–38 Over-expression of miR-181 family members has been found up-regulated in CN-AML with CEBPA mutations and associated with good outcome in high risk CN-AML.11–12 Furthermore, using mRNA gene-chip microarray analysis, the authors showed an inverse correlation between the expression of miR-181 and genes that encode for proteins involved in pathways of innate immunity mediated by Toll-like receptors (TLR2, TLR4, TLR8) and interleukin-1b (NOD-like receptors CARD8, 12, 15 and CASP1).12 Our results identified all three miRNAs associated with genes involved in innate immunity and inflammation such as TLR4, TLR8, IRF8 and IL6R genes among others.
Interestingly, network analysis revealed that miRNAs that correlated with genes within a functional category, such as apoptosis, seems to regulate the same genes (e.g. phosphatase and tensin homolog; PTEN or FOX03A), suggesting that these are key transcripts under extensive miRNA control. It is also possible that not all correlated miRNAs are regulating simultaneously these transcripts in each AML patient and some play a larger role than others depending on the AML cytogenetic and molecular signatures.
Our study provides with many functional miRNA: mRNA relationships that will need to be explored mechanistically for their involvement in myeloid leukemogenesis. Gain and loss of function studies will be needed to investigate the role of miRNAs correlated with chromatin modification, apoptosis and immune function genes. Finally, the discovery of previously unidentified functional relationships may lead to the development of novel therapeutic approaches. Targeting miRNAs that control the aberrant pathways identified here such as innate immunity, apoptosis and chromatin remodeling, by either drugs or miRNA-based approaches may improve treatment response in AML.
Acknowledgments
This work was supported by the National Institute of Health, National Cancer Institute grant: P01CA055164 and Sidney Kimmel Foundation for Cancer Research.
Footnotes
There are no financial disclosures or conflicts from any of the co-authors.
References
- 1.Bartel DP. MicroRNAs: genomics, biogenesis, mechanism, and function. Cell. 2004;116:281–297. doi: 10.1016/s0092-8674(04)00045-5. [DOI] [PubMed] [Google Scholar]
- 2.Karp X, Ambros V. Developmental biology. Encountering microRNAs in cell fate signaling. Science. 2005;310:1288–1289. doi: 10.1126/science.1121566. [DOI] [PubMed] [Google Scholar]
- 3.Chen CZ, Li L, Lodish HF, Bartel DP. MicroRNAs modulate hematopoietic lineage differentiation. Science. 2004;303:83–86. doi: 10.1126/science.1091903. [DOI] [PubMed] [Google Scholar]
- 4.Cheng AM, Byrom MW, Shelton J, Ford LP. Antisense inhibition of human miRNAs and indications for an involvement of miRNA in cell growth and apoptosis. Nucleic Acids Res. 2005;33:1290–1297. doi: 10.1093/nar/gki200. [DOI] [PMC free article] [PubMed] [Google Scholar]
- 5.Liao R, Sun J, Zhang L, et al. MicroRNAs play a role in the development of human hematopoietic stem cells. J Cell Biochem. 2008;104:805–817. doi: 10.1002/jcb.21668. [DOI] [PubMed] [Google Scholar]
- 6.Hébert SS, Horré K, Nicolaï L, et al. Loss of microRNA cluster miR-29a/b-1 in sporadic Alzheimer's disease correlates with increased BACE1/beta-secretase expression. Proc Natl Acad Sci U S A. 2008;105:6415–6420. doi: 10.1073/pnas.0710263105. [DOI] [PMC free article] [PubMed] [Google Scholar]
- 7.van Rooij E, Sutherland LB, Thatcher JE, et al. Dysregulation of microRNAs after myocardial infarction reveals a role of miR-29 in cardiac fibrosis. Proc Natl Acad Sci U S A. 2008;105:13027–13032. doi: 10.1073/pnas.0805038105. [DOI] [PMC free article] [PubMed] [Google Scholar]
- 8.Calin GA, Dumitru CD, Shimizu M, et al. Frequent deletions and down-regulation of micro- RNA genes miR15 and miR16 at 13q14 in chronic lymphocytic leukemia. Proc Natl Acad Sci U S A. 2002;99:15524–15529. doi: 10.1073/pnas.242606799. [DOI] [PMC free article] [PubMed] [Google Scholar]
- 9.Garzon R, Volinia S, Liu CG, et al. MicroRNA signatures associated with cytogenetics and prognosis in acute myeloid leukemia. Blood. 2008;111:3183–3189. doi: 10.1182/blood-2007-07-098749. [DOI] [PMC free article] [PubMed] [Google Scholar]
- 10.Garzon R, Garofalo M, Martelli MP, et al. Distinctive microRNA signature of acute myeloid leukemia bearing cytoplasmic mutated nucleophosmin. Proc Natl Acad Sci USA. 2008;105:3945–3950. doi: 10.1073/pnas.0800135105. [DOI] [PMC free article] [PubMed] [Google Scholar]
- 11.Marcucci G, Maharry K, Radmacher MD, et al. Prognostic significance of, and gene and microRNA expression signatures associated with, CEBPA mutations in cytogenetically normal acute myeloid leukemia with high-risk molecular features: a Cancer and Leukemia Group B Study. J Clin Oncol. 2008;26:5078–5087. doi: 10.1200/JCO.2008.17.5554. [DOI] [PMC free article] [PubMed] [Google Scholar]
- 12.Marcucci G, Radmacher MD, Maharry K, et al. MicroRNA expression in cytogenetically normal acute myeloid leukemia. N Engl J Med. 2008;358:919–928. doi: 10.1056/NEJMoa074256. [DOI] [PubMed] [Google Scholar]
- 13.Jongen-Lavrencic M, Sun SM, Dijkstra MK, Valk PJ, Löwenberg B. MicroRNA expression profiling in relation to the genetic heterogeneity of acute myeloid leukemia. Blood. 2008;111:5078–5085. doi: 10.1182/blood-2008-01-133355. [DOI] [PubMed] [Google Scholar]
- 14.Li Z, Lu J, Sun M, et al. Distinct microRNA expression profiles in acute myeloid leukemia with common translocations. Proc Natl Acad Sci USA. 2008;105:15535–15540. doi: 10.1073/pnas.0808266105. [DOI] [PMC free article] [PubMed] [Google Scholar]
- 15.Dixon-McIver A, East P, Mein CA, et al. Distinctive patterns of microRNA expression associated with karyotype in acute myeloid leukaemia. PLoS One. 2008;3:e2141. doi: 10.1371/journal.pone.0002141. [DOI] [PMC free article] [PubMed] [Google Scholar]
- 16.Langer C, Marcucci G, Holland KB, et al. Prognostic importance of MN1 transcript levels, and biologic insights from MN1-associated gene and microRNA expression signatures in cytogenetically normal acute myeloid leukemia: A Cancer and Leukemia Group B study. J. Clin. Oncol. 2009;27:3198–3204. doi: 10.1200/JCO.2008.20.6110. [DOI] [PMC free article] [PubMed] [Google Scholar]
- 17.Nielsen JA, Lau P, Maric D, Barker JL, Hudson LD. Integrating microRNA and mRNA expression profiles of neuronal progenitors to identify regulatory networks underlying the onset of cortical neurogenesis. BMC Neurosci. 2009;10:98. doi: 10.1186/1471-2202-10-98. [DOI] [PMC free article] [PubMed] [Google Scholar]
- 18.Liu T, Papagiannakopoulos T, Puskar K, et al. Detection of a microRNA signal in an in vivo expression set of mRNAs. PLoS One. 2007;2:e804. doi: 10.1371/journal.pone.0000804. [DOI] [PMC free article] [PubMed] [Google Scholar]
- 19.Chen A, Luo M, Yuan G, et al. Complementary analysis of microRNA and mRNA expression during phorbol 12-myristate 13-acetate (TPA)-induced differentiation of HL-60 cells. Biotechnol Lett. 2008;30:2045–2052. doi: 10.1007/s10529-008-9800-8. [DOI] [PubMed] [Google Scholar]
- 20.Wang L, Oberg AL, Asmann YW, et al. Genome-wide transcriptional profiling reveals microRNA-correlated genes and biological processes in human lymphoblastoid cell lines. PLoS One. 2009;4:e5878. doi: 10.1371/journal.pone.0005878. [DOI] [PMC free article] [PubMed] [Google Scholar]
- 21.Lionetti M, Biasiolo M, Agnelli L, et al. Identification of microRNA expression patterns and definition of a microRNA/mRNA regulatory network in distinct molecular groups of multiple myeloma. Blood. 2009;114:e20–e26. doi: 10.1182/blood-2009-08-237495. [DOI] [PubMed] [Google Scholar]
- 22.Shaffer LG, Tommerup N, editors. ISCN 2005: An International System for Human Cytogenetic Nomenclature. Basel, Switzerland: S. Karger; 2005. [Google Scholar]
- 23.Dennis G, Jr, Sherman BT, Hosack DA, et al. DAVID: Database for Annotation, Visualization, and Integrated Discovery. Genome Biol. 2003;4:P3. [PubMed] [Google Scholar]
- 24.Garzon R, Heaphy CE, Havelange V, et al. MicroRNA 29b functions in acute myeloid leukemia. Blood. 2009;114:5331–5341. doi: 10.1182/blood-2009-03-211938. [DOI] [PMC free article] [PubMed] [Google Scholar]
- 25.Breitkreutz BJ, Stark C, Tyers M. Osprey: a network visualization system. Genome Biol. 2003;4:R22. doi: 10.1186/gb-2003-4-3-r22. [DOI] [PMC free article] [PubMed] [Google Scholar]
- 26.Lewis BP, Shih IH, Jones-Rhoades MW, Bartel DP, Burge CB. Prediction of mammalian microRNA targets. Cell. 2003;115:787–798. doi: 10.1016/s0092-8674(03)01018-3. [DOI] [PubMed] [Google Scholar]
- 27.Krek A, Grün D, Poy MN, et al. Combinatorial microRNA target predictions. Nat Genet. 2005;37:495–500. doi: 10.1038/ng1536. [DOI] [PubMed] [Google Scholar]
- 28.Chen C, Ridzon DA, Broomer AJ, et al. Real-time quantification of microRNAs by stem-loop RT-PCR. Nucleic Acids Res. 2005;33:e179. doi: 10.1093/nar/gni178. [DOI] [PMC free article] [PubMed] [Google Scholar]
- 29.O'Connor L, Strasser A, O'Reilly LA, et al. Bim: a novel member of the Bcl-2 family that promotes apoptosis. EMBO J. 1998;17:384–395. doi: 10.1093/emboj/17.2.384. [DOI] [PMC free article] [PubMed] [Google Scholar]
- 30.Modur V, Nagarajan R, Evers BM, Milbrandt J. FOXO proteins regulate tumor necrosis factor-related apoptosis inducing ligand expression. Implications for PTEN mutation in prostate cancer. J Biol Chem. 2002;277:4928–47937. doi: 10.1074/jbc.M207509200. [DOI] [PubMed] [Google Scholar]
- 31.Ogryzko VV, Schiltz RL, Russanova V, Howars BH, Nakatani Y. The transcription coactivators p300 and CBP are histone acetyltransferases. Cell. 1996;87:953–959. doi: 10.1016/s0092-8674(00)82001-2. [DOI] [PubMed] [Google Scholar]
- 32.Felli N, Fontana L, Pelosi E, et al. MicroRNAs 221 and 222 inhibit normal erythropoiesis and erythroleukemic cell growth via kit receptor down-modulation. Proc Natl Acad Sci USA. 2005;102:18081–18086. doi: 10.1073/pnas.0506216102. [DOI] [PMC free article] [PubMed] [Google Scholar]
- 33.Spizzo R, Nicoloso MS, Lupini L, et al. miR-145 participates with TP53 in a death-promoting regulatory loop and targets estrogen receptor-alpha in human breast cancer cells. Cell Death Differ. 2010;17:246–254. doi: 10.1038/cdd.2009.117. [DOI] [PMC free article] [PubMed] [Google Scholar]
- 34.Ostenfeld MS, Bramsen JB, Lamy P, et al. miR-145 induces caspase-dependent and -independent cell death in urothelial cancer cell lines with targeting of an expression signature present in Ta bladder tumors. Oncogene. 2010;29:1073–1084. doi: 10.1038/onc.2009.395. [DOI] [PubMed] [Google Scholar]
- 35.Chhabra R, Adlakha YK, Hariharan M, Scaria V, Saini N. Upregulation of miR-23a-27a-24-2 cluster induces caspase-dependent and -independent apoptosis in human embryonic kidney cells. PLoS One. 2009;4:e5848. doi: 10.1371/journal.pone.0005848. [DOI] [PMC free article] [PubMed] [Google Scholar]
- 36.Kota J, Chivukula RR, O'Donnell KA, et al. Therapeutic microRNA delivery suppresses tumorigenesis in a murine liver cancer model. Cell. 2009;137:1005–1017. doi: 10.1016/j.cell.2009.04.021. [DOI] [PMC free article] [PubMed] [Google Scholar]
- 37.Thai TH, Calado DP, Casola S, et al. Regulation of the germinal center response by microRNA-155. Science. 2007;316:604–608. doi: 10.1126/science.1141229. [DOI] [PubMed] [Google Scholar]
- 38.Rodriguez A, Vigorito E, Clare S, et al. Requirement of bic/microRNA-155 for normal immune function. Science. 2007;316:608–611. doi: 10.1126/science.1139253. [DOI] [PMC free article] [PubMed] [Google Scholar]
- 39.Li QJ, Chau J, Ebert PJ, et al. miR-181a is an intrinsic modulator of T cell sensitivity and selection. Cell. 2007;129:147–161. doi: 10.1016/j.cell.2007.03.008. [DOI] [PubMed] [Google Scholar]
- 40.Taganov KD, Boldin MP, Chang KJ, Baltimore D. NF-kappaB-dependent induction of microRNA miR-146, an inhibitor targeted to signaling proteins of innate immune responses. Proc Natl Acad Sci USA. 2006;103:12481–12486. doi: 10.1073/pnas.0605298103. [DOI] [PMC free article] [PubMed] [Google Scholar]