

Abstract
The ventral midbrain (vMb) is organized into distinct anatomical domains and contains cohorts of functionally distinct subtypes of midbrain dopamine (mDA) neurons. We tested the hypothesis that genetic history and timing of gene expression within mDA neuron progenitors impart spatial diversity. Using Genetic Inducible Fate Mapping to mark the Sonic hedgehog (Shh) and Gli1 lineages at varying embryonic stages, we performed a quantitative and qualitative comparison of the two lineages’ contribution to the mDA neuron domains. Dynamic changes in Shh and Gli1 expression in the vMb primordia delineated their spatial contribution to the E12.5 vMb: Both lineages first contributed to the medial domain, but subsequently the Gli1 lineage exclusively contributed to the lateral vMb while the Shh lineage expanded more broadly across the vMb. The contribution of both lineages to the differentiated mDA neuron domain was initially biased anteriorly and became more uniform across the anterior/posterior vMb throughout development. Our findings demonstrate that the early Shh and Gli1 lineages specify mDA neurons of the substantia nigra pars compacta while the late Shh and Gli1 lineages maintain their progenitor state longer in the posterior vMb to extend the production of mDA neurons in the ventral tegmental area. Together, our study demonstrates that the timing of gene expression along with the genetic lineage (Shh or Gli1) within the neural progenitors segregate mDA neurons into distinct spatial domains.
Keywords: fate mapping, VTA, SNc
INTRODUCTION
When is a neuron’s fate determined and what is the origin of neuronal subtype diversity? These are fundamental questions in developmental neurobiology. It is well known that neuronal fate and diversification are established when progenitors segregate into distinct cohorts based upon their molecular identity, timing of gene expression, and response to secreted molecules (Jessell, 2000; Pearson and Doe, 2004). Classic examples of these concepts are vertebrate spinal cord and Drosophila neuroblast development (Briscoe and Ericson, 1999; Briscoe et al., 2000; Doe and Bowerman, 2001). The developing mesencephalon (Mes) also has dynamic changes in gene expression patterns (Joyner et al., 2000; Zervas et al., 2005; Ang, 2006). The genetic lineages derived from progenitors within the Mes form the diverse array of cell types and functional domains that comprise the midbrain (Mb). Notably, the progenitors in the ventral Mes (vMes) develop into ventral midbrain dopamine (mDA) neurons (Zervas et al., 2004; Kittappa et al., 2007; Joksimovic et al., 2009). Although all mDA neurons secrete the same neurotransmitter, dopamine, the population of mDA neurons is heterogenous and each cohort modulates distinct behaviors (Van den Heuvel and Pasterkamp, 2008). The anatomical distribution of the mDA neurons closely links different subtypes of mDA neurons into well-organized functional groups. For example, mDA neurons located medially in the ventral tegmental area (VTA) modulate complex behaviors such as cognition, emotion, and reward (Laviolette, 2007; Ikemoto, 2007; Lammel et al., 2008). In contrast, mDA neurons of the bilateral substantia nigra pars compacta (SNc) control motor behaviors (Galvan and Wichmann, 2008). An outstanding question in the field of mDA neuron development is how vMes DA neuron progenitors segregate into spatially distinct functional groups.
The vMes progenitors require Shh signaling and a permissive environment to induce mDA neuron development (Hynes et al., 1995; Ye et al., 1998; Blaess et al., 2006). Shh signaling is mediated by the secreted protein, Shh, that binds to its receptor, Ptch, to turn on expression of downstream target genes, including Gli1 (Dai et al., 1999; Bai et al., 2002; Fuccillo et al., 2006). We used genetic inducible fate mapping (GIFM) to investigate not only the cells expressing Shh but also the cells responding to Shh signaling. Previous fate mapping studies focused primarily on the Shh-expressing cells (Kittappa et al., 2007; Joksimovic et al., 2009), while Zervas et al. (2004) performed GIFM of the Gli1 and Wnt1 lineages and found that both lineages contribute to mDA neurons. However, neither of these studies provided a quantitative or comparative assessment between the contribution of the Shh-secreting versus the Shh-responding cells to the largely invariantly positioned cohorts of mDA neurons across development. We took advantage of our genetic mouse lines to perform a direct comparison of the Shh and Gli1 lineages marked at distinct time points and quantitatively determined their contribution to the mDA neuron domains.
MATERIALS AND METHODS
Animals
Mouse lines were used and maintained in an outbred Swiss Webster background. Specifically, male ShhCre:GFP/+;TaumGFP/mGFP, ShhCreER/+;TaumGFP/mGFP, or Gli1CreER/+;TaumGFP/mGFP were crossed with outbred Swiss Webster females (Taconic) to generate the following experimental embryos: ShhCre:GFP/+;TaumGFP/+, ShhCreER/+;TaumGFP/+, and Gli1CreER/+;TaumGFP/+, respectively. Additionally, ShhCre:GFP/+ was crossed with Gli1lacZ/+ to generate ShhCre:GFP/+;Gli1lacZ/+ embryos. Finally, male ShhCreER/+;TaumGFP/mGFP or Gli1CreER/+;TaumGFP/mGFP were crossed with R26Tomato/Tomato females to generate ShhCreER/+;TaumGFP/+;R26Tomato/+ or Gli1CreER/+;TaumGFP/+;R26Tomato/+ embryos. See Table 1 for a description of each mouse allele. All animals were housed and handled according to the National Institutes of Health Institutional Animal Care and Use Committee guidelines.
Table 1.
Description of Mouse Lines
The mouse alleles used in this study. The nomenclature of mouse lines, description of transgenes expressed in each line, and the references are provided.
| Mouse Strain | Transgene | Reference |
|---|---|---|
| Gli1lacZ/+ | Nuclear β-galactosidase is expressed from the Gli1 genomic locus. | (Bai et al., 2002) |
| Gli1CreER/+ | TM inducible CreER(T2) is expressed from the Gli1 genomic locus. | (Ahn and Joyner, 2004) |
| ShhCre:GFP/+ | Cre:GFP fusion protein is expressed from the Shh genomic locus. | (Harfe et al., 2004) |
| ShhCreER/+ | TM inducible CreER is expressed from the Shh genomic locus. | (Harfe et al., 2004) |
| Taumgfp-ires-nlacZ (TaumGFP) | Bicistronic expression of membrane bound GFP (mGFP) and nuclear β-galactosidase is induced from the Tau genomic locus upon Cre-mediated removal of a loxP-flanked stop cassette. Due to the promoter activity of the Tau, only postmitotic differentiated neurons are labeled. | (Hippenmeyer et al., 2005) |
| R26R | β-galactosidase is expressed from the ROSA26 genomic locus after Cre-mediated recombination. | (Soriano, 1999) |
| R26Tomato | TdTomato is expressed from the ROSA26 genomic locus after Cre-mediated recombination. | (Madisen et al., 2010) |
Tissue Processing
Morning on the day of the appearance of a vaginal plug was designated as embryonic day (E) 0.5. Pregnant dams were cervically dislocated and the embryos were removed from the uterine chain. Intact mouse embryos (E8.5–E10.5), whole heads (E11.5 and E12.5 embryos), or dissected brains (E16.5 embryos) were collected and genotyped using either yolk sac or tail biopsy as described previously (Table 1). Tissue was fixed in 4% paraformaldehyde/PBS (PFA) at 4°C overnight for E8.5–E11.5 embryos, 2 hours for E12.5, and 4 hours for E16.5 brains. Subsequently, tissue was rinsed in PBS, cyroprotected in 15% then 30% sucrose/PBS at 4°C until submerged, embedded in optimal cutting temperature (OCT, Sakura) media, and frozen with isopentane cooled to −150°C in liquid nitrogen (Ellisor et al., 2009). All sections were obtained on a Leica Cryostat (CM3050S) at a thickness of 10 !m (E8.5 – E10.5 embryos), 12 !m (E11.5 and E12.5 heads), and 14 !m (E16.5 brains). Sections were stored at −20°C.
Tamoxifen Injections
Tamoxifen (TM) solution (20 mg/ml) was prepared by dissolving TM (Sigma T5648) in corn oil (Sigma C8267) with vigorous shaking at 37°C for several hours, and was stored at 4°C protected from light (Brown et al. 2009). Between 9:00 and 10:00 a.m. a single dose of 1 mg (E7.5), 2 mg (E8.5), 3 mg (E9.5), or 4 mg (E10.5 and E11.5) of TM was delivered by oral gavage to the timed-pregnant dams using a disposable feeding needle (FST 9921) (Brown et al., 2009). For the cumulative Gli1 fate mapping, 2 mg of TM per day was given at E8.5, E9.5, and E10.5 between 9:00 and 10:00 a.m.
Fluorescent Immunohistochemistry and X-gal histochemistry
Frozen sections were brought to room temperature, post-fixed in 4% PFA/PBS, and rinsed in PBS followed by PBS/0.2% Triton X-100 (Fisher Scientific) (PBT). The sections were blocked in 10% normal donkey serum (Jackson ImmunoResearch) in PBT for 2 hours at room temperature and incubated with primary antibodies against β-galactosidase (AbCam, 1:500), β-galactosidase (MP biologicals, 1:2000), DsRed (Clontech, 1:500), green fluorescent protein (Nacalai Tesque, 1:1000), Lmx1a (a gift from M. German, 1:1000), Otx2 (R&D Systems, 1:150), tyrosine hydrosylase (mouse, Chemicon, 1:2000), or tyrosine hydroxylase (rabbit, Chemicon, 1:500) in blocking solution at 4°C overnight in a humidified chamber. After extensive washing with PBT, sections were incubated with species-specific secondary antibodies conjugated with Alexa fluorophores 488, 555, or 633 (Invitrogen) in 1% normal donkey serum for 2 hours at room temperature. After extensive washing with PBT, sections were counterstained with Hoescht (Invitrogen), washed with PBS, and coverslipped with Fluoromount-G (SouthernBiotech) mounting media.
X-gal histochemistry on frozen sections was performed following the protocol on the Ahn lab website (http://science.nichd.nih.gov/confluence/display/ahn/protocols). Briefly, air-dried sections were incubated in X-gal (Invitrogen, 15520) substrate solution (0.106 g potassium ferrocyanide, 0.082 g potassium ferricyanide, 48 ml wash buffer (2 mM MgCl2, 0.02% NP40, 0.05% deoxycholate in PBS, pH7.4), and 2 ml X-gal substrate stock solution (20 mg/ml in dimethyl formamide)) overnight at 37°C. The stained sections were counterstained with 0.005% Nuclear Fast Red (Poly Scientific), serially dehydrated in ethanol and xylene, and coverslipped with Permount (Fisher Scientific). Fluorescent immunostained images were captured using a Leica DM6000 upright microscope equipped with a Hamamatsu ORCA-ER digital camera or Zeiss LSM 510 confocal microscope and with Volocity (Perkin Elmer) or LSM 510 Image Browser software. Bright field images for X-gal stained samples were captured using a Macrofire (Optronics) camera with the Picture Frame software (Optronics). Images were processed with Photoshop in Adobe Creative Suite 3 (San Jose, CA) for brightness and contrast levels.
Antibody characterization
See Table 2 for information about each antibody.
Table 2.
Description of Primary Antibodies
The primary antibodies used in this study. The immunogen, manufacture’s information, and the dilution used are provided.
| Antigen | Immunogen | Manufacturer | Dilution |
|---|---|---|---|
| β-gal | Full length protein from E. coli | AbCam (Cambridge, MA) Chicken polyclonal (IgY) Cat # ab9361; Lot # 786071 |
1:500 |
| β-gal | Full length protein from E. coli | MP Biologicals (Solon, OH) Rabbit polyclonal (IgG) Cat # 559762, Lot # 06226 |
1:2000 |
| DsRed | Full length DsRed protein | Clontech (Mountain View, CA) Rabbit polyclonal (IgG) Cat # 632496; Lot # 9024766 |
1:500 |
| GFP | Full length GFP protein | Nacalai Tesque (Kyoto, Japan) Rat monoclonal (IgG2a) Cat # 04404-84, Lot # M8E2655, M9K7914 |
1:1000 |
| Lmx1a | Hamster Lmx1a aa 299-378 | Gift from Dr. Michael German, University of California San Francisco Rabbit polyclonal (IgG) |
1:1000 |
| Otx2 | Human (rhOtx2) aa 1-289 | R&D Systems (Minneapolis, MN) Goat polyclonal (IgG) Cat # AF1979, Lot # KNO01 |
1:150 |
| TH | Denatured TH from rat pheochromocytoma | Millipore-Chemicon (Temecula, MA) Rabbit polyclonal (IgG) Cat # AB152; Lot # LV1382810 |
1:500 |
| TH | Purified TH from PC12 cells | Millipore-Chemicon (Temecula, MA) Mouse monoclonal (IgGg1κ) Cat # MAB318; Lot # LV1420321 |
1:2000 |
Anti-β-galactosidase (β-gal, AbCam; Cat # ab9361; Lot # 786071). The polyclonal chicken anti-β-gal antibody was raised against the full-length native Escherichia coli (E. coli) protein and immuno-affinity purified (AbCam technical information). The antibody specificity was confirmed by the absence of staining in wild-type animals, without β-gal (data not shown).
Anti-β-galactosidase (β-gal, MP Biologicals; Cat #: 559762, Lot # 06226). The polyclonal rabbit anti-β-gal antibody was raised against the full length Escherichia coli enzyme in immunized rabbits. The IgG fraction was delipidated, ammonium sulfate fractionated, and purified by anion exchange chromatography. The specificity was confirmed by a single band in western blot analysis and the absence of staining in animals without the lacZ gene (MP Biologicals technical information and data not shown).
Anti-DsRed (DsRed, Clontech; Cat # 632496; Lot # 9024766 ). The polyclonal rabbit anti-DsRed was raised against the full length Discosoma sp. red fluorescent protein and recognizes DsRed-Express, DsRed-Monomer, DsRed fusion proteins, mCherry and tdTomato. Specificity was confirmed by the presence of a 30–38 kDa band from HEK 293 cells expressing DsRed but not in HEK 293 cells expressing GFP (Clontech technical information).
Anti-green fluorescent protein (GFP, Nacalai Tesque; Cat # 04404-84; Lot # M9K7914 and M8E2655). The monoclonal rat anti-GFP was raised against the full length GFP protein with a histidine tag for purification. The specificity was confirmed by the presence of a single 27 kDa band in a western blot analysis (Necalai Tesque technical information). Additionally there was no staining in wild-type animals without a GFP allele (data not shown).
Anti-Lmx1a (a gift from M. German; F11R animal 2 bleed 2). The polyclonal rabbit anti-Lmx1a was raised against the C-terminus (aa 299-378) of the hamster Lmx1a protein with a GST tag. The antibody is now available from Millipore (deposited by M. German) and the specificity was confirmed by the presence of a 50 kDa band in a western blot analysis of mouse testis tissue lysate (Millipore technical information, Cat # AB10533). The labeling pattern was consistent with previously published reports (Andersson et al., 2006).
Anti-Otx2 (R&D Systems; Cat # AF1979; Lot # KNO01). The polyclonal goat anti-Otx2 was raised in immunized goats against the human Otx2 (aa1-289) made in Escherichia coli. The antibody was purified by affinity chromatography and the specificity was confirmed by positive immunostaining on human NTERA-2 cells (R&D Systems technical information). The labeling pattern was consistent with previously published reports (Ang, 2006).
Anti-tyrosine hydroxylase (TH, Chemicon; Cat # AB152; Lot # LV1382810). The polyclonal rabbit anti-TH antibody was raised against denatured TH from rat pheochromocytoma in immunized rabbits. The specificity was confirmed by the presence of a 62 kDa band by western blot analysis corresponding to the TH size (Chemicon technical information). Specificity was further confirmed by the cell morphology and the staining pattern unique to the TH+ domain (Smidt and Burbach, 2007). The antibody did not stain in known TH negative domains (data not shown).
Anti-tyrosine hydroxylase (TH, Chemicon; Cat # AB318; Lot # LV1420321). The monoclonal mouse anti-TH was raised in immunized mice against the N-terminus of the TH protein. The immunogen was purified from PC12 cells and specificity was confirmed by the presence of a 59–61 kDa band on a western blot analysis from brain sympathetic nerve terminals and adrenal glands (Chemicon technical information). Specificity was further confirmed by cell morphology consistent with previous reports (Smidt and Burbach, 2007).
Data Analysis and Quantification
Every 8th horizontal section from E12.5 embryos was fluorescent-immunostained for TH and the adjacent section labeled with X-gal substrate. The sections were photographed using the 10X objective for the immunostaining and the 40X objective for the X-gal histochemistry as described above and then the images were montaged using Adobe Photoshop. The TH staining was visible on 6 horizontal sections (i=most dorsal, vi = most ventral) with each section separated by approximately 84 μm. The third section (iii) from the dorsal most level with TH staining was concomitant with the peak of the cephalic flexure and the fourth section (iv) correlated with the cephalic flexure bisecting the TH expression domain into anterior and posterior regions (Fig. 2). The TH expression (mDA neuron) domain was traced and the outline was superimposed on the adjacent section with X-gal staining (Fig. 2). The X-gal positive cells within the TH domain were labeled with a dot in Adobe Photoshop to indicate the marked cells from the Shh (magenta) or Gli1 (green) lineages (Figs. 2, 3). The mDA neuron domain was further divided into anterior, posterior, medial, and lateral regions. Specifically, the anterior-posterior divide was placed half way between the tip of the third and fourth ventricles with the exception of the dorsal most section (i) in which the anterior-posterior divide was where the ventricle was narrowest (Fig. 2Ci, arrowheads). For the medial-lateral division the narrowest part of the TH domain on the third section (iii, peak of the cephalic flexure) was divided into three equal widths and this medial-lateral division was centered on the other five sections. The number of dots within each of these domains (anterior-left lateral, anterior-medial, anterior-right lateral, posterior-left lateral, posterior-medial, and posterior-right lateral) were counted and subjected to statistical analysis (Figs. 2, 3, 4). We also performed the Abercrombie correction method to correct for over-counting of cell profiles (Abercrombie, 1946). We measured the tissue thickness from 8 sections (each section from a different animal) in 2 locations per section for an average tissue thickness of 11.2 μm ± 1.8 μm (average ± standard deviation). We then measured the nuclei thickness from 192 cells across these animals and locations for an average nucleus thickness of 6.6 μm ± 1.6 μm. We then calculated the correction factor (0.63) and applied this to our cell counts shown in Figure 4.
Figure 2.

Example of tissue preparation and grid layout used for quantifying lineage derived cells within the E12.5 mDA neuron domain. This example shows the Gli1 lineage cells marked with TM at E8. 5. (A) Schematic of the E12.5 vMb. Sagittal view of the E12.5 mouse head indicating the horizontal sectioning planes for the 6 levels spanning the dorsal to ventral mDA neuron domains with i being the most dorsal and vi the most ventral. (B) Horizontal sections of the six dorsal to ventral levels immunostained for TH expression to identify the mDA neurons. (C) Adjacent sections of B were processed for X-gal histochemistry to reveal the marked lineage cells (blue) and outlines of the mDA neuron domain from B were overlaid on the X-gal stained images. In the most dorsal level i, the arrows indicate where the ventricle is the narrowest to place the anterior/posterior divide. (D) Dots were placed on the lineage cells within the mDA neuron domain. In addition, grids were placed to demarcate the medial/lateral and anterior/posterior boundaries. Specifically, the anterior/posterior divide was placed halfway between the tips of third and fourth ventricles (except for i where the narrowest part of the tissue was the divide, Ci arrowheads) and the medial/lateral divide was placed to partition the narrowest point of the TH domain on the third level (iii) into three equal widths. Scale bar = 100 μm. Orientation of images is indicated in the inset of Bi.
Figure 3.

Dynamic changes in the spatial distribution of the Shh and Gli1 lineage cells across the vMb at E12.5. (A) Schematic of the E12.5 head in sagittal view and the horizontal sectioning planes for the 6 levels spanning the dorsal to ventral mDA neuron domains (i–vi, respectively, shaded in grey). Level iii is at the peak of the cephalic flexure and more ventral levels iv–vi were bisected by the cephalic flexure. (B–E) Total spatial distribution of the Shh (magenta) and Gli1 (green) lineages in the vMb marked by TM injection at E7.5–E10.5. The large panels (B–E) are the compiled view of all six levels shown in smaller panels (i–vi or i′-vi′) for each time point from multiple embryos. The horizontal and vertical lines represent the divides we placed for anterior/posterior and medial/lateral distinction. Shh lineage cells marked by TM at E7.5 did not contribute to the vMb at E12.5 (B, NL) while the Gli1 lineage cells contributed to the medial and anterior vMb (Bi′-vi′). At E8.5 marking (C), the contribution of the Shh lineage cells was first observed in the anterior vMb (Ci-vi) while the Gli1 lineage cells contributed extensively to the vMb (Ci′-vi′). At E9.5 marking (D) the Shh lineage cells maximally contributed across the vMb (Di-vi), but the Gli1 lineage cells showed almost exclusive contribution to the lateral vMb (Di′-vi′). At E10.5 marking (E) both Shh and Gli1 lineage cells decreased their contribution to the vMb (Ei-vi, Ei′-vi′). NL = no labeling. Orientation of images is indicated in the inset of B. 4–6 embryos (Fig. 3A) were analyzed and the compiled dots from all embryos at each level are shown for each experimental condition.
Figure 4.

Statistical analysis of the spatial distribution of the Shh and Gli1 lineages in E12.5 vMb. (A) Comparison of the total number of Shh (magenta) and Gli1 (green) lineage cells marked at each developmental stage. Shh and Gli1 lineages showed a trend of minimal initial contribution followed by a dramatic increase and subsequent gradual reduction in their contribution. Interestingly, the pattern of contribution for the Shh lineage followed that of the Gli1 lineage a day later. n = number of embryos analyzed per stage. (B) Quantitative analysis of the proportion of Shh (closed magenta circles) and Gli1 (open green circles) lineage cells distributed in the anterior vMb. Each data point in the graph indicates the percentage of the lineage cells in the anterior domain among all marked cells found in the entire mDA neuron domain for each embryo analyzed. When compared across different marking stages during development, there was a statistically significant reduction in the contribution to the anterior vMb from E7.5 to E10.5 for both the Shh and Gli1 lineage cells (p < 0.0001) that resulted in a more even distribution across the anterior/posterior vMb by E10.5. (C) Quantitative analysis of the proportion of Shh and Gli1 lineage cells in the medial vMb. The Gli1 lineage cells significantly decreased their contribution to the medial vMb from E7.5 to E10.5 (p < 0.0001). In contrast, the Shh lineage cells showed no significant change (p = 0.317). (D) Graph of the average lineage contribution to the dorsal/ventral expanse of the mDA neuron domain. The average number of lineage cell in the mDA neuron domain of each dorsal to ventral section was quantified for the Shh (magenta) and Gli1 (green) lineages. The Gli1 lineage marked at E8.5 showed the greatest contribution at the dorsal most level i. Both the Shh and Gli1 lineages showed contribution to levels ii and iii. There was diminished contribution from both lineages at multiple time points for levels iv – vi. Additionally, the contribution trend for both lineages was maintained at levels ii–iv with the Gli1 lineage contribution beginning at E7.5, peaking at E8.5, and diminishing at E9.5–E10.5 and the Shh lineage following the trend by one day at each dorsal/ventral level. Inset is of the sagittal view of the E12.5 mouse head indicating the horizontal sectioning planes for the 6 levels.
Statistical Analysis of GIFM Results
For each GIFM condition, we analyzed 4–6 mice as indicated by n in the Results and Figures. The spatial distribution of the marked neurons was quantified by comparing anterior with posterior counts and by comparing medial with lateral counts. For each mouse, counts of marked cells were summed across horizontal layers (i–vi), and the left and right sections were combined into a single region (i.e., the lateral region). We calculated the proportions of marked neurons in the anterior and medial regions for each mouse, and fitted quasi-binomial regression models relating these proportions to gene lineage and TM injection time points. We used quasi-binomial models, as opposed to standard binomial models (McCulloch et al., 2008), to account for over-dispersion due to the variability between mice. This analysis was based on 33 mice with non-zero counts in some regions, excluding eight mice with zero counts in all regions.
RESULTS
The temporal contribution of the Shh and Gli1 lineages to the vMb
We first investigated whether the dynamic changes in the expression of Shh and Gli1 in the developing vMes were reflected in their temporal contribution to the vMb. We used the ShhCreER (Harfe et al., 2004) and Gli1CreER (Ahn and Joyner, 2004) mice along with the TaumGFP reporter mouse (Hippenmeyer et al., 2005) (Fig. 1A) to label differentiated neurons derived from the Shh and Gli1 lineages by delivering TM in the morning of E7.5, E8.5, E9.5, or E10.5 (Fig. 1B). Thus our analysis was restricted to neurons that have already differentiated (see below). TM induces Cre recombinase activity from 6 to 30 hours after administration (Robinson et al., 1991; Ahn and Joyner, 2004; Zervas et al., 2004; Joyner and Zervas, 2006) to remove the loxP-flanked STOP cassette from the Tau genomic locus of the TaumGFP allele (Fig. 1A, 1B). Throughout the manuscript, we operationally defined the marking stage as the day of TM administration implying an active marking window of the following 24 hours (Fig. 1B). Thus, the expression pattern of Shh or Gli1 analyzed a day after TM administration indicates the group of cells being marked (Fig. 1C–J). We analyzed each lineage’s contribution at E12.5 when mDA neurons can be identified based on their expression of TH (Fig. 1K) and when mDA neurogenesis peaks in mouse (Bayer et al., 1995).
Figure 1.

Dynamic temporal contribution of the Sonic Hedgehog (Shh) and Gli1 lineage cells in the ventral midbrain (vMb). (A) Schematic of genetic inducible fate mapping (GIFM). ShhCreER and Gli1CreER mice were crossed with TaumGFP reporter mice to label the Shh-secreting and -responding cells, respectively. Tamoxifen (TM) administration liberates CreER from cytoplasmic sequestration and allows translocation of CreER to the nucleus where Cre mediates recombination between loxP sites in the Tau locus to turn on expression of the reporter protein, β-galactosidase (nuclear lacZ) in post-mitotic neurons. (B) Timeline for GIFM marking of Shh and Gli1 expressing cells. TM was delivered at embryonic day (E)7.5, E8.5, E9.5, and E10.5 and embryos were collected at E12.5. The Cre-mediated recombination of the TaumGFP allele occurs 6–30 hours post TM delivery (solid line) and results in a permanent marking (dashed line) of lineage derived cells. (C–J) Dynamic changes in the expression pattern of Shh (ShhCre:GFP/+) and Gli1 (Gli1lacZ/+) in the ventral mesencephalon (vMes) are shown to indicate the origin of progenitor cells being marked upon TM treatment. At E8.5 Shh expression was initially restricted to the notochord while the cells in the ventral neuroepithelium respond to the notochord Shh signal and express Gli1 within the Otx2 domain (C,D). At E9.5 Shh expression commenced overlapping with the Gli1 expression domain, which expanded more lateral than the medial vMes Lmx1a domain (E,F). At E10.5 Shh expression expanded and Gli1 expression down-regulated in the Lmx1a domain of the vMes with only few cells co-expressing both Shh and Gli1 (G,H). At E11.5 Shh expression begins to down-regulate in the Lmx1a positive vMes (medial to yellow dashed line) while maintaining a higher lateral expression domain (I–J). The Gli1 expression at E11.5 is completely down-regulated medially and is only expressed lateral to the Shh expression domain (I–J). The white dashed line and white solid line demarcates the tissue outline and midline, respectively. (K) Schematic of the E12.5 vMb indicating the distribution of midbrain dopamine (mDA; tyrosine hydroxylase (TH)+, green) neurons. Sagittal view of an E12.5 embryonic head with the horizontal sectioning plane indicates the region of vMb containing mDA neurons at the peak of the cephalic flexure (grey shading). (L–S) GIFM of the Shh and Gli1 lineage cells in the E12.5 vMb. Cells from each lineage at indicated marking stage (i.e., TM at: E7.5) were identified by their expression of β-galactosidase (X-gal histochemistry). Shh lineage cells did not contribute to the vMb when marked at E7.5 (L). The first contribution of Shh lineage cells to the vMb was observed from E8.5 marking (N). Shh lineage cells increased their contribution to the vMb at E9.5 marking (P) and decreased at E10.5 marking (R). The contribution of Gli1 lineage cells preceded that of the Shh lineage by one day in general by first contributing to the vMb with TM at E7.5 (M) with subsequent increase at E8.5 marking (O) and gradual decreases at E9.5 (Q) and E10.5 (S) marking. Scale bar = 25 μm for C–J and 100 μm for K–S. Arrowheads in M,R, and S show sparse distribution of lineage cells. Orientation of images is indicated in the inset of C and K: Dorsal (D), Ventral (V), Anterior (A), Posterior (P), Medial (M), and Lateral (L). At least 4 embryos were analyzed and a representative image was selected for each experimental condition.
When TM injection at E7.5 induced Cre-mediated recombination, Shh expression was restricted to the notochord, a non-neural tissue, (Fig. 1C, green) and the Shh lineage cells from this stage of marking did not contribute to the E12.5 vMb (Fig. 1L). In order to rule out the possibility that the absence of marked cells from the Shh lineage cells at E7.5 was due to delayed expression of reporter protein from the TaumGFP allele, we also analyzed at E16.5 and found no contribution from this early Shh lineage (data not shown). In addition, GIFM with the ubiquitous R26R reporter allele showed no contribution from E7.5 Shh lineage (data not shown). In contrast, the Gli1 expression at the time of E7.5 marking was found in the Otx2+ region of the vMes in response to the notochord-derived Shh, (Figs. 1C, red,1D) and the Gli1 lineage contributed to a few cells within the vMb at E12.5 (Fig. 1M, arrowheads). A day later at E8.5 marking, Shh expression was located in the floorplate of the Lmx1a+ vMes (Fig. 1E, green, 1F) and the Shh lineage contributed to the vMb (Fig. 1N). The Gli1 expression domain at E8.5 marking was broad across the vMes including the Lmx1a+ Shh+ expression domains (1E, red, 1F) and the Gli1 lineage cells increased their contribution to the E12.5 vMb (Fig. 1O). At E9.5 marking, Shh was expressed in a broader vMes domain encompassing the Lmx1a expression domain whereas Gli1 expression was minimally overlapping with Shh or Lmx1a and was shifted to more lateral vMes (Fig. 1G, 1H). As a result, the Shh lineage cells marked at E9.5 contributed greatly to the vMb (Fig. 1P) in contrast to the reduced contribution of E9.5 Gli1 lineage cells in the vMb (Fig. 1Q), reflecting the diminished Gli1 expression in the medial vMes. One day later at E10.5 marking, Shh expression was reduced in the medial Lmx1a+ vMes (Fig. 1I, green, 1J) and the contribution of Shh lineage cells marked at this stage was reduced in the E12.5 vMb (Fig. 1R). By E10.5 marking, Gli1 expression was not found in the medial Lmx1a+ Shh+ vMes (Figs. 1I red, 1J) and concomitantly there was almost no contribution of the Gli1 lineage cells to the vMb (Fig. 1S). Interestingly, our results showed that the Gli1 lineage contribution to the vMb preceded that of the Shh lineage by one day. Contribution of the Gli1 lineage was greatest with TM at E8.5 (Fig. 1O) and tapered off in the subsequent marking stages while the Shh lineage contributed maximally at E9.5 TM administration (Fig. 1P) and subsequently decreased.
Spatial segregation of the Shh and Gli1 lineage cells across the vMb
Next, we focused on the contribution of the Shh and Gli1 lineages to the domains that contained TH-expressing mDA neurons. Specifically, we determined whether each lineage marked at specific developmental stages became a spatially distinct population within the mDA neuron domain (Fig. 2). For example, the Gli1 lineage cells marked at E8.5 with GIFM were identified with X-gal histochemistry (Fig. 2C). The distribution of marked cells was then plotted according to their position within the anterior/posterior and medial/lateral subdomains of the mDA neuron domain (Figs. 2A, 2D, see Materials and Methods for details). The differential distribution of lineage cells along the dorsal/ventral axis reflected the location and amount of mDA neurons on E12.5 horizontal sections where the dorsal sections contained DA neurons in the more anterior/lateral domain and the ventral sections showed DA neurons in the more posterior domain with the maximum number of DA neurons found in levels ii and iii (Fig. 2B).
Cells derived from the Shh lineage that were marked at E7.5 did not contribute to any of the mDA neuron domains (Fig. 3B; note the absence of magenta dots). In contrast, cells derived from the Gli1 lineage marked at this same stage (TM at E7.5) contributed mostly to the anterior mDA neuron domain (Fig. 3Bi′-vi′). The first contribution of the Shh lineage was marked by TM administration at E8.5, which resulted in the Shh lineage being confined to the anterior mDA neuron domain (Fig. 3Ci-vi). The pattern of the early contribution of the Shh lineage was similar to the Gli1 lineage distribution marked a day earlier. The Gli1 lineage cells marked at E8.5 were greatly expanded in their contribution to the mDA neuron domains across the dorsal/ventral levels i–iv, with an especially prominent expansion into the posterior domains in level iii (Fig. 3Ci′-vi′). The Shh lineage cells marked at E9.5 contributed heavily to the anterior as well as to the posterior mDA neuron domain in level iii (Fig. 3Di-vi). The Gli1 lineage cells marked at E9.5 underwent a change in their distribution along the dorsal/ventral levels of the mDA neuron domain compared to earlier marking and began contributing more to the posterior/lateral domain at ventral levels (Fig. 3Diii′-vi′). The Shh lineage cells marked at E10.5 showed a decreased contribution in the anterior domain at level iii (Figs. 3Ei-vi) in comparison to those marked at E8.5 and E9.5 (Figs. 3Ciii, 3Diii). In a continuation of diminished contribution, Gli1 lineage cells marked at E10.5 minimally contributed to the mDA neuron domain (Fig. 3Ei′-vi′). Thus E10.5 marking represented the cessation of Gli1 lineage contribution to mDA neuron domains.
Quantitative analysis of Shh and Gli1 lineages across time and space
We performed a rigorous quantitative analysis of the marked lineages to test whether the temporally and spatially segregated distributions were statistically significant. First, we compared the total number of Shh and Gli1 lineage cells that contributed to the six representative levels of the mDA neuron domain across the developmental stages for multiple animals (Fig. 4A). The number of marked cells found across animals was somewhat variable due to the inevitable mosaic nature of GIFM (Joyner and Zervas, 2006, Ellisor et al., 2009), but readily replicated the observed temporal trend in the contribution of each lineage to the mDA neuron domain (Fig. 4A). Specifically, the Shh lineage began its contribution to the mDA neuron domain at E8.5 (229 ± 124 cells (average ± standard deviation)), peaked its contribution at E9.5 (464 ± 69 cells), and tapered off at E10.5 (124 ± 92 cells) lagging behind the contribution pattern of the Gli1 lineage by one day (83 ± 58 cells, 550 ± 272 cells, 247 ± 110 cells, 11 ± 7 cells for TM at E7.5, E8.5, E9.5, and E10.5, respectively) (Fig. 4A).
Next, we quantified the proportion of Shh and Gli1 lineage cells found in the anterior/posterior and medial/lateral mDA neuron domains across all developmental stages we marked. We observed that both the Shh and Gli1 lineages from earlier TM administrations contributed almost exclusively to the anterior mDA neuron domain (95% ± 1.3% (fitted proportion ± standard error) for Shh lineage at E8.5 and 90% ± 3.2% for Gli1 lineage at E7.5) (Fig. 4B). At later TM administrations, the Shh and Gli1 lineage cells were more evenly distributed across the anterior and posterior domains (62% ± 4.6% for Shh lineage at E10.5 and 57% ± 3.4% for Gli1 lineage at E9.5) (Fig. 4B). We fitted a quasi-binomial regression model and determined that there was a statistically significant change in both lineages from an early anterior contribution to a more even distribution at later stages (p < 0.0001).
We also compared the proportion of Shh and Gli1 lineage cells found in the medial and lateral mDA neuron domains. Gli1 lineage cells from earlier marking (TM at E7.5) contributed to both medial and lateral domains, but almost exclusively contributed to the lateral domain at later stages (TM at E9.5 and E10.5). This change in Gli1 distribution across the developmental stages was statistically significant (p < 0.0001) (Fig. 4C). In contrast, the contribution of Shh lineage cells, from all TM markings, did not change across the medial/lateral domains (p = 0.317) (Fig. 4C).
Finally, we compared the contribution of both lineages to each dorsal to ventral level of the mDA neuron domain at E12.5 (Fig. 4D). We found that the total contribution trend of the Shh lineage peaking at E9.5 and the Gli1 lineage peaking at E8.5 was recapitulated at multiple levels and was not skewed by a bias at one particular level along the dorsal/ventral axis (Fig. 4D).
Segregation of the Shh and Gli1 lineages into the VTA and SNc
We next investigated whether the spatial segregation of the Shh and Gli1 lineages into mDA neuron domains at E12.5 was preserved at a more advanced stage of mDA neuron development. By E16.5, the mDA neurons can be partitioned into two well-defined anatomical structures: the medial VTA and lateral SNc (Fig. 5A) (Schambra, 2008). Specifically, we chose to compare the Shh and Gli1 lineage cells marked with TM injection at E9.5 when both lineages showed the biggest differences in their spatial distribution at E12.5. We also analyzed the contribution of the Shh and Gli1 lineage cells marked with TM at E11.5 to further extend our analysis to late-born mDA neurons. Since the Gli1 lineage contribution was already diminishing by E9.5 marking (Figs. 1, 3, 4), we also included the Gli1 lineage cells marked at E8.5 to follow the maximal contribution of the Gli1 lineage. Firstly, the mDA (TH+) neurons of the SNc were heavily populated with cells derived from the E9.5 Shh lineage (Fig. 5B), which was consistent with the distribution that we observed at E12.5. In contrast, few cells from the E11.5 Shh lineage became the mDA neurons of the SNc at E16.5 (Fig. 5C). Additionally, the Gli1 lineage contributed to mDA neurons of the SNc when marked at E8.5, but rarely when marked at E9.5 or E11.5 (Figs. 5D–F). Interestingly, while the Shh lineage cells found in the lateral vMb were mostly TH+ mDA neurons, the Gli1 lineage cells contributed to non-DA neurons in the same lateral domain (Fig. 5E–F, arrows).
Figure 5.

Segregation of the Shh and Gli1 lineages into the VTA and SNc. (A) Schematic of E16.5 brain shows the horizontal sectioning plane and two anatomically distinct mDA neuron domains (shaded in grey). The boxed areas within lateral substantia nigra pars compacta (SNc) and medial ventral tegmental area (VTA) indicate where the images were taken in subsequent panels. Dashed line indicates the midline of the horizontal section. (B–K) Shh and Gli1 lineage cells marked with TM at E8.5, E9.5 or E11.5 were analyzed for their contribution to mDA neurons at E16.5. Shh lineage from E9.5 marking (B) became mDA neurons of the SNc but not from E11.5 marking (C). In contrast, the Gli1 lineage only contributed to the mDA neurons of the SNc when marked at E8.5, but rarely at E9.5 or E11.5 (D, E, and F arrows indicate TH negative lineage cells). The medial VTA contained many Shh lineage cells derived from TM injection at E9.5 (G) and also from TM at E11.5 (H). Gli1 lineage cells marked at E8.5 and E9.5 also contributed to the VTA (I and J) but not at E11.5 marking (K). Higher magnification images of boxed area in each panel is shown on the right to better identify the lineage cells (β-gal+) that became DA neurons (TH+) in separate fluorescent channels as well as in a merged images. Scale bar = 100 μm. n = 4 embryos for each experimental condition.
The VTA contained numerous mDA neurons derived from the Shh lineage marked at E9.5 (Fig. 5G), which was consistent with the E12.5 distribution in which the Shh lineage contributed to many neurons in the medial mDA neuron domain (Figs. 3D, 4C). The E9.5 Shh lineage also contributed to numerous non-DA (TH−) neurons in the medial vMb. The Shh lineage cells marked at E11.5 continued to contribute to mDA neurons in the medial VTA (Fig. 5H). We did not observe labeling of the Shh lineage at E12.5, which is likely because the newly marked cells had not differentiated and turned on the Tau promoter of the TaumGFP allele (Fig. 7) (Ellisor et al., 2009). The Gli1 lineage cells marked at E8.5 and E9.5 contributed extensively to the medial VTA (including TH+ and TH− cells) at E16.5 (Fig. 5I–J). Notably, there was almost no Gli1 lineage (TH+ or TH−) cells from E11.5 marking found in the E16.5 VTA (Fig. 5K), consistent with the E12.5 analysis, which showed the cessation of the Gli1 lineage contribution to the vMb by E10.5 marking (Figs. 3E, 4A).
Figure 7.
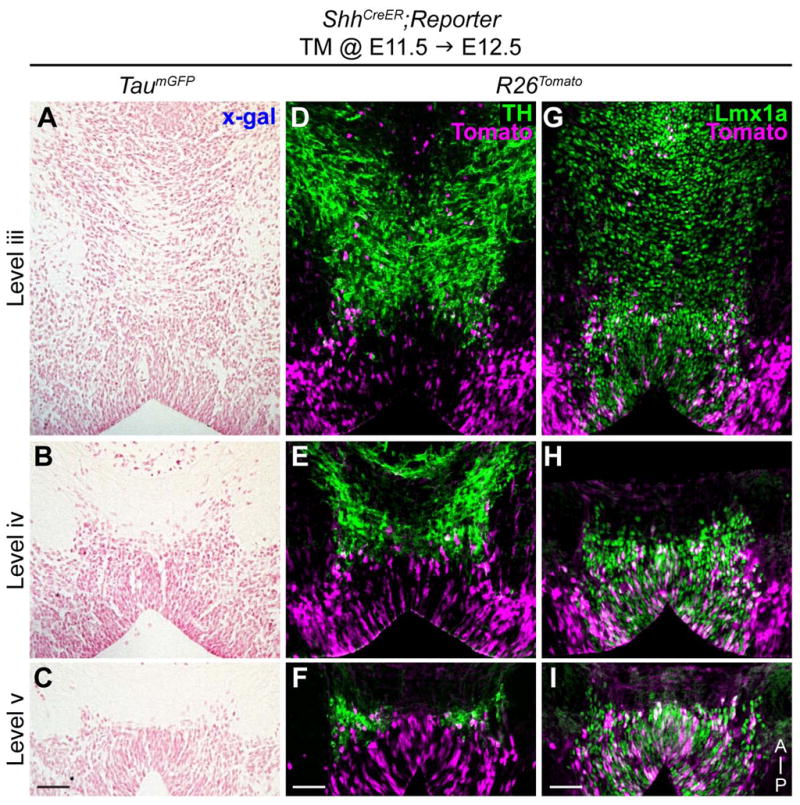
Late Shh lineage cells contribute to posterior mDA neurons and progenitors at E12.5. (A–C) Shh lineage cells marked at E11.5 with the TaumGFP reporter and analyzed at E12.5 show no labeling (X-gal histochemistry) indicating 24 hours is insufficient to turn on the TaumGFP reporter. (D–I) Shh lineage cells marked at E11.5 with the R26Tomato ubiquitous reporter (magenta) show contribution to posterior mDA neurons (TH+) (D–F). E11.5 Shh lineage cells are mostly mDA neuron progenitors (Lmx1a+) in the posterior vMb that have not differentiated into DA neurons at E12.5 (G–I). Level iii, iv, and v are represented in figure 2. Scale bar is 50 μm. Orientation of images is indicated in panel I.
The contribution of E9.5 Gli1 lineage to the VTA was not expected given the sparse medial distribution observed at E12.5 (Fig. 3D). Therefore, we further investigated the origin of the VTA mDA neurons derived from E9.5 Gli1 lineage by examining the expression pattern of Gli1 at E10.5, the time of marking, with respect to Lmx1a. We found dynamic changes in the Gli1 expression in the vMes along the anterior/posterior axis: The anterior Gli1 expression was located very laterally and only few cells overlapped with Shh or Lmx1a at E10.5 (Fig. 6B, arrowheads). In contrast, the most posterior vMes showed greater Gli1 expression in the medial domain overlapping with Shh and Lmx1a, especially at the boundary of the Shh and Gli1 expression domains (Fig. 6D, marquee). At E12.5, this small group of posterior Gli1 expressing cells contributed to the posterior vMb domain as confirmed with two reporter alleles (TaumGFP and R26Tomato) (Figs. 6F–H, 3D). Interestingly, most of Gli1 lineage cells marked at E9.5 continued to express the mDA neuron progenitor marker, Lmx1a, indicating that the VTA DA neurons at E16.5 were derived from the posterior vMes cells and these cells maintain a progenitor state for at least 3 days (E9.5 to E12.5).
Figure 6.

Posterior Gli1 expression in the vMes contributes to a subset of mDA neurons and progenitors. (A) Schematic of E10.5 embryo indicating the three anterior to posterior sectioning planes in the vMes (grey shade). (B–D) Shh (green) and Gli1 (magenta) expression in the anterior (B), intermediate (C), and posterior (D) vMes in E10.5 ShhCre:GFP/+;Gli1lacZ/+ embryos shows the Gli1 expression changes from a lateral to more medial domain along the anterior/posterior axis. The insets show Lmx1a expression. The white arrowheads in B and the marquees in C and D indicate Shh and Gli1 co-expression. (E) Sagittal schematic of the E12.5 embryo indicating the horizontal sectioning plane at level iv and a horizontal schematic of level iv indicating the location of the high magnification images in F–H. The grey shading indicates the mDA neuron domain. (F– G) Gli1 lineage cells marked at E9.5 contributed to TH+ mDA neurons in the posterior vMb domain with both TaumGFP (F) and R26Tomato (G) reporters at E12.5. (H) Additionally, the E9.5 Gli1 lineage cells marked with the R26Tomato reporter contribute greatly to the Lmx1a+ mDA neuron progenitors that have not yet turned on TH at E12.5. Black arrowheads in F indicate lineage cells in the mDA neuron domain. Dashed lines outline the vMb boundary in panels F– H. Scale bar in B–D is 100 μm and F–H is 50 μm. Orientation of images is indicated in the inset of D and H.
The E11.5 Shh lineage also contributed exclusively to the VTA (Fig. 5); therefore, we next investigated whether these late Shh lineage are also derived from the posterior vMb at E12.5. Since the TaumGFP reporter labels only the postmitotic differentiated neurons, 24 hours was an insufficient amount of time for marked progenitors to turn on the Tau promoter and we did not observe any labeling at E12.5 (Fig. 7A–C) (Ellisor et al., 2009). However using the ubiquitous R26Tomato reporter, based on the ROSA26 promoter, we identified Shh lineage cells marked at E11.5 contributing to the posterior vMb at E12.5 (Fig. 7D–F). We found that Shh lineage cells became a few mDA neurons (TH+), but were mostly expressing Lmx1a, indicating that the late Shh lineage also contribute to many posterior/medial DA neuron progenitors at E12.5 (Figs. 5G–I). Together, our results showed that the VTA DA neurons at E16.5 are derived from the posterior vMb progenitors that persist as late as E12.5 (Fig. 5, 6, 7).
Overlapping cumulative contribution of Shh and Gli1 lineages to mDA neurons
Finally, we investigated the cumulative contribution of the Shh and Gli1 lineages to the VTA and SNc to identify any spatial bias inherent to the genetic lineage independent of timing. We used ShhCre:GFP to mark all the cells that ever expressed Shh and their lineage (Fig. 8A). For cumulative fate mapping of the Gli1 lineage, we used Gli1CreER animals with multiple doses of TM (Ahn and Joyner, 2004) at E8.5–E10.5 to mark a maximal number of lineage cells contributing to the mDA neuron domain based on the E12.5 analysis (Figs. 4A, 8). Using these cumulative marking approaches, we complemented our GIFM findings, and confirmed that no one specific population of mDA neurons was derived from a single lineage (Fig. 8). Importantly, these results indicate that derivation from the Shh or Gli1 genetic lineage alone does not impart mDA neuron subtype diversity, but rather the timing of the gene expression within the neural progenitors is essential.
Figure 8.

Overlapping collective contribution of Shh and Gli1 lineages to the mDA neurons. (A) Timeline for cumulative fate mapping of Shh and Gli1 lineage cells. The Shh-expressing cells were cumulatively labeled in ShhCre:GFP;TaumGFP animals. TM was delivered to Gli1CreER/+;TaumGFP animals daily from E8.5–E10.5 to maximally mark the Gli1 lineage cells; the resulting marked cells were permanently labeled (dashed line). Embryos were collected at E16.5. (B) Schematic of E16.5 brain shows horizontal sectioning plane and where the mDA neurons are located (shaded in grey). The schematic shows the lateral SNc and medial VTA with boxed areas where the images were taken in subsequent panels. Dashed line indicates the midline of the horizontal section. (C–F) Cumulative fate mapping of the Shh and Gli1 lineages. The Shh lineage contributed extensively to the mDA neurons in both the SNc (C) and VTA (E). The Gli1 lineage also extensively contributed to the SNc (D) and the VTA (F) mDA neurons. Higher magnification images of boxed area in each panel is shown on the right to better identify the lineage cells (β-gal+) that became mDA neurons (TH+) in separate fluorescent channels as well as in merged images. Scale bar = 100 μm. n = 3–4 embryos for each experimental condition.
DISCUSSION
In this study, we took advantage of the dynamic expression patterns of Shh and Gli1 to temporally and spatially mark genetically distinct pools of progenitors of the vMes, which allowed us to investigate their individual contribution to developing mDA neuron domains. We found that the organization of distinct anatomical classes of mDA neurons is dictated by the genetic history of neural progenitors within the vMes. Interestingly, both genetic lineage and timing of gene expression in progenitors are related to mDA neuron organization at a much earlier developmental stage than suggested by previous birth-dating studies (Altman and Bayer, 1981; Bayer et al., 1995; Gates et al., 2006). Specifically, by marking neural progenitors of the vMes as early as E7.5–E8.5 using GIFM, we show that the spatial specification of mDA neurons is achieved by the neural progenitors two to three days prior to mDA neuron progenitors becoming post-mitotic or expressing mDA neuron markers such as Pitx3, Nurr1, and TH (Altman and Bayer, 1981; Bayer et al., 1995; Gates et al., 2006; Abeliovich and Hammond, 2007).
The Shh and Gli1 expression patterns at the time of marking were closely reflected in the spatial distribution of their lineage cells at E12.5. Shh expression was maintained in the medial vMes and expanded laterally during E8.5–E10.5 and Shh lineage cells contributed to increasingly more cells across the vMb from E8.5 to E9.5 marking. The subsequent decline in the contribution of Shh lineage cells marked at E10.5 and beyond coincided with its diminished expression in the vMes starting at E11.5. In contrast, the dynamic change in Gli1 expression from the medial to more lateral vMes was preserved in their contribution to the E12.5 vMb. We also found that the maximal contribution of each lineage came from a marking stage that correlated with the broadest gene expression domain in the vMes: TM at E9.5 for Shh and TM at E8.5 for Gli1 (Figs. 1, 4). Interestingly, our quantitative analysis of the spatial distribution revealed that the earliest contribution of Shh and Gli1 lineage cells from E7.5 to E9.5 was biased toward the anterior vMb domain with contributions to the posterior domain emerging later (Fig. 9). Previous birth-dating studies showed that the anterior mDA neurons became post-mitotic before the posterior mDA neurons (Altman and Bayer, 1981; Bayer et al., 1995). The E12.5 analysis provides an immediate link between the gene expression pattern of earlier progenitors and the initial spatial segregation of mDA neurons. Our data demonstrates that the developmental order from the anterior to the posterior domain is established within the progenitors well before they become post-mitotic and terminally differentiate.
Figure 9.

Model of the transition from vMes progenitors to mDA neurons. (A–C) Shh and Gli1 expression across development. Schematic of the vMes indicates the coronal sectioning plane in B and C. B illustrates the changes in Shh expression from early medial (pink hatched lines) to later lateral expansion (magenta). C illustrates the changes in Gli1 expression from early medial expression (green hatched lines) to exclusive lateral expression at later stages (dark green). (D–F) Shh and Gli1 lineage contribution to E12.5 vMb. Schematic of E12.5 head (D) show the horizontal plane of sectioning in E and F along with the vMb (grey shading). E illustrates that the early Shh lineage contributes to the anterior mDA neuron domain spanning the medial and lateral domains (pink hatched lines). Later Shh lineage cells contribute across the vMb with an increased contribution to the posterior mDA progenitor domain (E, magenta). F illustrates the early Gli1 lineage cells contributing to the anterior domain spanning both medial and lateral regions of the mDA neuron domain (green hatched lines). Later Gli1 lineage cells contribute to the posterior/lateral domain including mDA neurons and progenitors (F, dark green). (G–I) Shh and Gli1 lineage contribution to the mDA neurons at E16.5. Schematic of E16.5 brain (G) indicates the horizontal plane of sectioning in H and I along with the mDA neurons (grey shading). H illustrates the Shh lineage contribution to the VTA and SNc with the early lineage cells contributing to the SNc and VTA (pink hatched lines), and the later lineage cells contributing to only the VTA (magenta). I shows the early Gli1 lineage contribution (green hatched lines) to the SNc and VTA and then later Gli1 lineage cells only contributing to the VTA (dark green). The Shh lineage cells from early and late stages correlate to E8–E9 and E10–E11 markings, respectively. The Gli1 lineage cells from early and late stages correlate to E7–E8 and E9–E10 markings, respectively. Orientation of images is indicated in the inset of B, E, and H.
However, mDA neurogenesis is only at its peak at E12.5 in mouse (Bayer et al., 1995; Gates et al., 2006). Thus, our analysis of the distribution of Shh and Gli1 lineage cells at E16.5 when DA neurogenesis is complete and the spatial sub-domains (VTA and SNc) are segregated provides a comprehensive view of the Shh and Gli1 lineages’ contribution to the mDA neurons. Our findings demonstrate that the early neural progenitors (Shh lineage cells marked at E8.5–E9.5 and Gli1 lineage cells at E7.5–E8.5) of the vMes undergo lateral expansion and specify mDA neurons of the SNc first. Subsequently, the late neural progenitors (Shh lineage cells at E10.5–E11.5 and Gli1 lineage cells at E9.5–E10.5) maintain their progenitor state longer to extend the production of VTA mDA neurons (Fig. 9). The fact that mDA neurons of the VTA become post-mitotic between E12.5–E14.5 later than those of the SNc further supports our results (Fig. 7) (Altman and Bayer, 1981; Bayer et al., 1995; Gates et al., 2006).
Our analysis of the Gli1 and Shh lineages marked at later stages presents a unique insight into the distinct origin of the VTA from that of the SNc (Fig. 9). We had classified E9.5 Gli1 lineage cells as contributing to the lateral vMb at E12.5 (Figs. 2, 4), but their final destination was mostly within the medial VTA at E16.5 (Fig. 5). Our arbitrary partitioning of the E12.5 vMb that assigned only the middle one third of vMb to be the medial domain (Fig. 2) might have been too stringent, suggesting that the future VTA mDA progenitors occupy a broader medial domain. In fact, Gli1 expression at the time of marking undergoes a remarkable change from the anterior/lateral domain to the posterior/medial vMes (Fig. 6). Interestingly, only the posterior vMes contains the cells that express Gli1, Shh and Lmx1a at E10.5. Together with our analysis showing that mDA neurons derived from Gli1 lineage at E9.5 are also found in the posterior vMb at E12.5 further support our idea that the VTA DA neurons are derived from the posterior vMb cells that continue to express Gli1, Shh and Lmx1a as late as E10.5 (Fig. 6). Additionally some of these Gli1 lineage cells that express Lmx1a at E10.5 are still expressing Lmx1a at E12.5, indicating that the VTA DA neuron progenitors maintain a progenitor state for at least three days (Fig. 5, 6). Conversely, once the Gli1 expression is outside the Shh/Lmx1a domain, Gli1-derived cells stop contributing to mDA neurons despite numerous non-DA lineage cells found in the vMb (Fig. 5). Interestingly, the E11.5 Shh lineage cells that contributed exclusively to the VTA were derived from the same posterior vMb domain at E12.5 as the E9.5 Gli1 lineage cells, further corroborating our idea that the posterior mDA neurons and progenitors at E12.5 contribute to the VTA.
The direct comparison between Shh and Gli1 lineages, which are closely related as cells expressing the signaling molecule and cells that respond to this signal, allowed us to investigate a unique relationship between them. Previous analyses of the Shh (Joksmovic et al., 2009) or Gli1 (Zervas et al., 2004) lineages alone did not provide insights into the biological interactions between multiple genetic lineages. We noticed that the expression pattern and subsequent lineage contribution of Gli1 preceded Shh by one day (Figs. 1, 3, 4A), raising the possibility that the same set of vMes progenitors may have expressed Gli1 at one stage and then turned on Shh expression a day later. In such a scenario, most mDA neurons would be derived from progenitors that had expressed both Gli1 and Shh. Indeed our cumulative fate mapping indicates that the distribution patterns of the Shh and Gli1 lineage cells were almost indistinguishable (Fig. 8), despite their early distinctive expression patterns in the developing vMes (Fig. 1C–J). In addition, the Gli1 lineage marked at E10.5 decreased its contribution to mDA neurons when the Gli1 expression (E11.5 expression) shifted outside the future Shh expression domain and did not overlap with Lmx1a, the mDA neuron progenitor marker (Figs. 1I–J, 5)(Ang, 2006). This suggests that the dual lineage progenitors, which expressed both Gli1 and Shh, are critical for the establishment of mDA neuron progenitors. The E11.5 Gli1 lineage contributed to the vMb at E16.5 but did not become TH+ mDA neurons further supporting the notion that the cells derived from the lateral most Gli1 expressing cells (Shh− and Lmx1a−) do not become mDA neurons (Figs. 1I, 5). In addition, expression of Wnt1, another gene critical for proper mDA neuron development, is nested within the Shh/Lmx1a expression domain in vMes from E8.5–E12.5 and contributes extensively to mDA neurons (Zervas et al., 2004 and Brown et al., co-submitted). Thus, the mDA neuron heterogeneity is established by the timing of gene expression of multiple lineages including, Shh, Gli1, and Wnt1. Additional genetic tools that allow marking of Shh, Gli1, or Wnt1 lineages separately at distinct developmental stages in one animal will be required to elucidate the role of progenitors expressing combinations of these genes in mDA neuron diversity. Furthermore, whether the Shh and Gli1 lineage cells from distinct developmental stages will impart the characteristics of mature mDA neurons, including molecular marker identity and formation of neural circuits, will provide important information to better understand the consequences of perturbations on specific populations of mDA neurons in disease. In summary, our study provides significant insight into how these two related lineages sculpt the mDA neuron organization via the dynamic changes in timing of their expression in the vMes progenitors.
Acknowledgments
We thank Dr. Silvia Arber for the TaumGFP mouse line, Dr. M. German for the antibody against Lmx1a, and the Ahn lab for critical comments on the manuscript and experimental procedures. We would also like to thank Sherry Ralls and the NICHD Microscopy Imaging Core for technical assistance.
This work was supported by the Intramural Research Program of the National Institutes of Health (Grant number: 1ZIAHD008781).
LITERATURE CITED
- Abercrombie M. Estimation of nuclear population from microtome sections. Anat Rec. 1946;94:239–247. doi: 10.1002/ar.1090940210. [DOI] [PubMed] [Google Scholar]
- Abeliovich A, Hammond R. Midbrain dopamine neuron differentiation: factors and fates. Dev Biol. 2007;304:447–454. doi: 10.1016/j.ydbio.2007.01.032. [DOI] [PubMed] [Google Scholar]
- Ahn S, Joyner AL. Dynamic changes in the response of cells to positive hedgehog signaling during mouse limb patterning. Cell. 2004;118:505–516. doi: 10.1016/j.cell.2004.07.023. [DOI] [PubMed] [Google Scholar]
- Altman J, Bayer SA. Development of the brain stem in the rat. V. Thymidine-radiographic study of the time of origin of neurons in the midbrain tegmentum. J Comp Neurol. 1981;198:677–716. doi: 10.1002/cne.901980409. [DOI] [PubMed] [Google Scholar]
- Andersson E, Tyrggvason U, Deng Q, Friling S, Alekseenko Z, Robert B, Perlmann T, Ericson J. Identification of intrinsic determinants of midbrain dopamine neurons. Cell. 2006;124(2):393–405. doi: 10.1016/j.cell.2005.10.037. [DOI] [PubMed] [Google Scholar]
- Ang SL. Transcriptional control of midbrain dopaminergic neuron development. Development. 2006;133(18):3499–3506. doi: 10.1242/dev.02501. [DOI] [PubMed] [Google Scholar]
- Bai CB, Auerbach W, Lee JS, Stephen D, Joyner AL. Gli2, but not Gli1, is required for initial Shh signaling and ectopic activation of the Shh pathway. Development. 2002;129:4753–4761. doi: 10.1242/dev.129.20.4753. [DOI] [PubMed] [Google Scholar]
- Bayer SA, Wills KV, Triarhou LC, Ghetti B. Time of neuron origin and gradients of neurogenesis in midbrain dopaminergic neurons in the mouse. Exp Brain Res. 1995;105:191–199. doi: 10.1007/BF00240955. [DOI] [PubMed] [Google Scholar]
- Blaess S, Corrales JD, Joyner AL. Sonic hedgehog regulates Gli activator and repressor functions with spatial and temporal precision in the mid/hindbrain region. Development. 2006;133:1799–1809. doi: 10.1242/dev.02339. [DOI] [PubMed] [Google Scholar]
- Briscoe J, Ericson J. The specification of neuronal identity by graded Sonic Hedgehog signalling. Semin Cell Dev Biol. 1999;10:353–362. doi: 10.1006/scdb.1999.0295. [DOI] [PubMed] [Google Scholar]
- Briscoe J, Pierani A, Jessell TM, Ericson J. A homeodomain protein code specifies progenitor cell identity and neuronal fate in the ventral neural tube. Cell. 2000;101:435–445. doi: 10.1016/s0092-8674(00)80853-3. [DOI] [PubMed] [Google Scholar]
- Brown A, Brown S, Ellisor D, Hagan N, Normand E, Zervas M. A practical approach to genetic inducible fate mapping: a visual guide to mark and track cells in vivo. J Vis Exp. 2009 doi: 10.3791/1687. [DOI] [PMC free article] [PubMed] [Google Scholar]
- Dai P, Akimaru H, Tanaka Y, Maekawa T, Nakafuku M, Ishii S. Sonic Hedgehog-induced activation of the Gli1 promoter is mediated by GLI3. J Biol Chem. 1999;274:8143–8152. doi: 10.1074/jbc.274.12.8143. [DOI] [PubMed] [Google Scholar]
- Doe CQ, Bowerman B. Asymmetric cell division: fly neuroblast meets worm zygote. Curr Opin Cell Biol. 2001;13:68–75. doi: 10.1016/s0955-0674(00)00176-9. [DOI] [PubMed] [Google Scholar]
- Ellisor D, Koveal D, Hagan N, Brown A, Zervas M. Comparative analysis of conditional reporter alleles in the developing embryo and embryonic nervous system. Gene Expr Patterns. 2009;9:475–489. doi: 10.1016/j.gep.2009.07.007. [DOI] [PMC free article] [PubMed] [Google Scholar]
- Fuccillo M, Joyner AL, Fishell G. Morphogen to mitogen: the multiple roles of hedgehog signalling in vertebrate neural development. Nat Rev Neurosci. 2006;7:772–783. doi: 10.1038/nrn1990. [DOI] [PubMed] [Google Scholar]
- Galvan A, Wichmann T. Pathophysiology of Parkinsonism. Clin Neurophysiol. 2008;119:1459–1479. doi: 10.1016/j.clinph.2008.03.017. [DOI] [PMC free article] [PubMed] [Google Scholar]
- Gates MA, Torres EM, White A, Fricker-Gates RA, Dunnett SB. Re-examining the ontogeny of substantia nigra dopamine neurons. Eur J Neurosci. 2006;23:1384–1390. doi: 10.1111/j.1460-9568.2006.04637.x. [DOI] [PubMed] [Google Scholar]
- Harfe BD, Scherz PJ, Nissim S, Tian H, McMahon AP, Tabin CJ. Evidence for an expansion-based temporal Shh gradient in specifying vertebrate digit identities. Cell. 2004;118:517–528. doi: 10.1016/j.cell.2004.07.024. [DOI] [PubMed] [Google Scholar]
- Hippenmeyer S, Vrieseling E, Sigrist M, Portmann T, Laengle C, Ladle DR, Arber S. A developmental switch in the response of DRG neurons to ETS transcription factor signaling. PLoS Biol. 2005;3:e159. doi: 10.1371/journal.pbio.0030159. [DOI] [PMC free article] [PubMed] [Google Scholar]
- Hynes M, Porter JA, Chiang C, Chang D, Tessier-Lavigne M, Beachy PA, Rosenthal A. Induction of midbrain dopaminergic neurons by Sonic hedgehog. Neuron. 1995;15:35–44. doi: 10.1016/0896-6273(95)90062-4. [DOI] [PubMed] [Google Scholar]
- Ikemoto S. Dopamine reward circuitry: two projection systems from the ventral midbrain to the nucleus accumbens-olfactory tubercle complex. Brain Res Rev. 2007;56:27–78. doi: 10.1016/j.brainresrev.2007.05.004. [DOI] [PMC free article] [PubMed] [Google Scholar]
- Jessell TM. Neuronal specification in the spinal cord: inductive signals and transcriptional codes. Nat Rev Genet. 2000;1:20–29. doi: 10.1038/35049541. [DOI] [PubMed] [Google Scholar]
- Joksimovic M, Anderegg A, Roy A, Campochiaro L, Yun B, Kittappa R, McKay R, Awatramani R. Spatiotemporally separable Shh domains in the midbrain define distinct dopaminergic progenitor pools. Proc Natl Acad Sci USA. 2009;106:19185–19190. doi: 10.1073/pnas.0904285106. [DOI] [PMC free article] [PubMed] [Google Scholar]
- Joyner AL, Liu A, Millet S. Otx2, Gbx2 and Fgf8 interact to position and maintain a mid-hindbrain organizer. Curr Opin Cell Biol. 2000;12:736–741. doi: 10.1016/s0955-0674(00)00161-7. [DOI] [PubMed] [Google Scholar]
- Joyner AL, Zervas M. Genetic inducible fate mapping in mouse: establishing genetic lineages and defining genetic neuroanatomy in the nervous system. Dev Dyn. 2006;235:2376–2385. doi: 10.1002/dvdy.20884. [DOI] [PubMed] [Google Scholar]
- Kittappa R, Chang WW, Awatramani RB, McKay RD. The foxa2 gene controls the birth and spontaneous degeneration of dopamine neurons in old age. PLoS Biol. 2007;5:e325. doi: 10.1371/journal.pbio.0050325. [DOI] [PMC free article] [PubMed] [Google Scholar]
- Lammel S, Hetzel A, Häckel O, Jones I, Liss B, Roeper J. Unique properties of mesoprefrontal neurons within a dual mesocorticolimbic dopamine system. Neuron. 2008;57:760–773. doi: 10.1016/j.neuron.2008.01.022. [DOI] [PubMed] [Google Scholar]
- Laviolette SR. Dopamine modulation of emotional processing in cortical and subcortical neural circuits: evidence for a final common pathway in schizophrenia? Schizophr Bull. 2007;33:971–981. doi: 10.1093/schbul/sbm048. [DOI] [PMC free article] [PubMed] [Google Scholar]
- Madisen L, Zwingman TA, Sunkin SM, Oh SW, Zariwala HA, Gu H, Ng LL, Palmiter RD, Hawrylycz MJ, Jones AR, Lein ES, Zeng H. A robust and high-throughput Cre reporting and characterization system for the whole mouse brain. Nat Neurosci. 2010;13:133–140. doi: 10.1038/nn.2467. [DOI] [PMC free article] [PubMed] [Google Scholar]
- McCulloch CE, Searle SR, Neuhaus JM. Generalized, Linear, and Mixed Models. 2. Hoboken, NJ: John Wiley and Sons; 2008. [Google Scholar]
- Pearson BJ, Doe CQ. Specification of temporal identity in the developing nervous system. Annu Rev Cell Dev Biol. 2004;20:619–647. doi: 10.1146/annurev.cellbio.19.111301.115142. [DOI] [PubMed] [Google Scholar]
- Robinson SP, Langan-Fahey SM, Johnson DA, Jordan VC. Metabolites, pharmacodynamics, and pharmacokinetics of tamoxifen in rats and mice compared to the breast cancer patient. Drug Metab Dispos. 1991;19:36–43. [PubMed] [Google Scholar]
- Schambra U. Prenatal Mouse Brain Atlas. New York, NY: Springer; 2008. [Google Scholar]
- Smidt MP, Burbach JP. How to make a mesodiencephalic dopaminergic neuron. Nat Rev Neurosci. 2007;8:21–32. doi: 10.1038/nrn2039. [DOI] [PubMed] [Google Scholar]
- Soriano P. Generalized lacZ expression with the ROSA26 Cre reporter strain. Nat Genet. 1999;21:70–71. doi: 10.1038/5007. [DOI] [PubMed] [Google Scholar]
- Van den Heuvel DM, Pasterkamp RJ. Getting connected in the dopamine system. Prog Neurobiol. 2008;85:75–93. doi: 10.1016/j.pneurobio.2008.01.003. [DOI] [PubMed] [Google Scholar]
- Ye W, Shimamura K, Rubenstein JL, Hynes MA, Rosenthal A. FGF and Shh signals control dopaminergic and serotonergic cell fate in the anterior neural plate. Cell. 1998;93:755–766. doi: 10.1016/s0092-8674(00)81437-3. [DOI] [PubMed] [Google Scholar]
- Zervas M, Blaess S, Joyner AL. Classical embryological studies and modern genetic analysis of midbrain and cerebellum development. Curr Top Dev Biol. 2005;69:101–138. doi: 10.1016/S0070-2153(05)69005-9. [DOI] [PubMed] [Google Scholar]
- Zervas M, Millet S, Ahn S, Joyner AL. Cell behaviors and genetic lineages of the mesencephalon and rhombomere 1. Neuron. 2004;43:345–357. doi: 10.1016/j.neuron.2004.07.010. [DOI] [PubMed] [Google Scholar]