

Abstract
Ecto-nucleotide pyrophosphatase/phosphodiesterase 1 (NPP1) generates inorganic pyrophosphate (PPi), a physiologic inhibitor of hydroxyapatite deposition. In a previous study, we found NPP1 expression to be inversely correlated with the degree of atherosclerotic plaque calcification. Moreover, function-impairing mutations of ENPP1, the gene encoding for NPP1, are associated with severe, artery tunica media calcification and myointimal hyperplasia with infantile onset in human beings. NPP1 and PPi have the potential to modulate atherogenesis by regulating arterial smooth muscle cell (SMC) differentiation and function, including increase of pro-atherogenic osteopontin (OPN) expression. Hence, this study tested the hypothesis that NPP1 deficiency modulates both atherogenesis and atherosclerotic intimal plaque calcification. Npp1/ApoE double deficient mice were generated by crossing mice bearing the ttw allele of Enpp1 (that encodes a truncation mutation) with ApoE null mice and fed with high-fat/high-cholesterol atherogenic diet. Atherosclerotic lesion area and calcification were examined at 13, 18, 23 and 28 weeks of age. The aortic SMCs isolated from both ttw/ttw ApoE−/− and ttw/+ ApoE−/− mice demonstrated decreased Opn expression. The 28-week-old ttw/ttw ApoE−/− and ttw/+ ApoE−/− had significantly smaller atherosclerotic lesions compared with wild-type congenic ApoE−/− mice. Only ttw/ttw but not ttw/+ mice developed artery media calcification. Furthermore in ttw/+ mice, there was a tendency towards increased plaque calcification compared to ApoE−/− mice without Npp1 deficiency. We conclude that Npp1 promotes atherosclerosis, potentially mediated by Opn expression in ApoE knockout mice.
Keywords: atherosclerosis, plaque calcification, osteopontin, inorganic pyrophosphate
Introduction
Plaque calcification is a biomarker of early atherosclerosis [1] and correlates with complication, severity and plaque stability [2, 3]. Whereas arterial calcification in aging, diabetes mellitus and end-stage renal disease is primarily confined to the medial layer, calcification in atherosclerosis occurs in the intimal plaque. Both intima and media calcification appear to be mediated by ectopic cartilage and bone formation, a consequence of the now well-documented transdifferentiation potential of vascular smooth muscle cells (SMCs) [4, 5] and also of osteochondral differentiation by other cells in the artery, including adventitial myofibroblasts [6], stem cells and pericytes [7–9] . The differentiation to ‘bone-forming’ chondrocyte- or osteoblast-like cells is accompanied by the expression of tissue-nonspecific alkaline phosphatase, increased fibrillar collagen type I expression [10] and certain matrix proteins, e.g. osteopontin (OPN), osteocalcin (OC), collagen type II and type X [11–13]. Recent studies in human beings and animal models have demonstrated that (as in mineralizing bone) arterial calcification is inhibited by physiological function of resident cells (including SMCs and endothelial cells) [14, 15]. Specifically, it was shown that SMCs normally express inhibitors of mineralization, such as inorganic pyrophosphate (PPi) and matrix gla protein (Mgp), respectively, and that lack of these molecules leads to spontaneous vascular calcification and increased mortality [16, 17].
One of these inhibitors is the nucleotide pyrophosphatase/ phosphodiesterase (NPP) family member NPP1, because severe inborn deficiency of NPP1 is associated with calcification of arteries in mice and human beings [18, 19].
NPP1 is a major generator of extracellular PPi in cartilage and a variety of other tissues, including heart, kidney, liver, pancreas and skeletal muscle [20]. PPi potently inhibits hydroxyapatite crystal deposition and growth and regulates chondrogenesis, collagen I expression and synthesis [21] and other cell differentiation processes [22]. These include promotion of the expression of OPN by PPi[19, 23], which in turn promotes atherogenesis via recruitment of monocyte macrophages, and also inhibits arterial calcification by effects that include suppression of hydroxyapatite crystal growth [24].
The physiological role of NPP1-mediated PPi generation in tissue calcification has come to light recently. In human beings, inactivating homozygous or inactivating compound heterozygous mutations of ENPP1 are associated with generalized arterial calcification of infancy (GACI), a frequently lethal form of disseminated arterial media calcification and myointimal proliferation [25]. In Enpp1 knockout mice, hydroxyapatite crystals are found in the aortic medial layer at the level of the internal elastic lamina [18]. These mice additionally develop abnormal calcification of periarticular tissues [23]. A similar phenotype was found in the ttw/ttw mouse, harbouring a homozygous truncation mutation in the Enpp1 gene [26, 27].
The role of NPP1 in atherogenesis and intimal calcification is unknown. Previous studies have shown that the lack of Npp1 leads to decreased expression of Opn in osteoclasts [23]. Opn is a known chemoattractant for macrophages, the most prominent cell type in atherosclerotic lesions [28]. Additionally, we have shown that NPP1 expression is down-regulated in calcified plaques compared to uncalcified atherosclerotic lesions in human carotid endarterectomy samples [29]. We suggested that atherosclerotic lesion progression is attenuated and calcification in the atherosclerotic plaque is enhanced due to a total or partial deficiency of Npp1. To test our hypotheses, we crossed Npp1-deficient ttw/ttw mice with ApoE-deficient mice to generate Npp1 and ApoE double deficient mice. ApoE is a structural component of all lipoprotein particles except low-density lipoprotein (LDL). It serves as a high-affinity ligand for lipoprotein receptors and thus allows the uptake of ApoE-containing particles by the liver [30]. Mice deficient in ApoE show increased serum cholesterol and triglycerides leading to atherosclerotic plaque development [31].
Our studies revealed that on the ApoE knockout background, both partial and severe Npp1 deficiency (heterozygous and homozygous ttw phenotype) slow down atherosclerotic lesion progression. Furthermore, we found that partial Npp1 deficiency was associated with a tendency towards greater intimal plaque calcification. Thus, our results suggest that in the atherosclerotic plaque NPP1 suppresses calcification but promotes atherogenesis.
Materials and methods
Mice
The creation of the Npp1-deficient ttw/ttw mouse [a breeding colony of a ttw mice stock with ICR (Institute of Cancer Research) background in the Central Institute for Experimental Animals (Kanagawa, Japan)] used in this study has been described previously [27]. In this study, heterozygous mice are designated as ttw/+, Enpp1 wild-type as wt. C57BL/6 ApoE−/− mice (Jackson Laboratory, Bar Harbour, ME, USA) were bred to ttw/+ mice. Homozygous double-knockout ttw/ttw ApoE−/− mice were generated by brother–sister mating of ttw/+ ApoE−/− mice on a ICR/C57BL/6 background (1:1).
Enpp1 wt, Enpp1 heterozygous and Enpp1 null mice among ApoE null mice were designated as wt ApoE−/−, ttw/+ ApoE−/− and ttw/ttw ApoE−/−, respectively. Enpp1 and ApoE genotyping was performed by the polymerase chain reaction analysis of tail DNA as described elsewhere ([27]; JAX® Mice database).
The study was approved by the local committee for animal studies (Reg. No.: G21/2004).
Diet and experimental design
The pups were weaned at three weeks of age and then maintained on normal chow diet. At eight weeks of age male littermates (18 ttw/ttw ApoE−/−, 18 ttw/+ApoE−/− and 21 wt ApoE−/−) were set on high-fat/high-cholesterol diet with 16% coconut oil, 1% cholesterol and 0.5% sodium cholate for 5, 10, 15 or 20 weeks. Mice were killed at 13, 18, 23 or 28 weeks of age. Blood samples (0.5–0.8 ml) were obtained by retro-orbital bleed to assess lipid profiles. The arterial tree was fixed by perfusion through the left ventricle at physiological pressure using warmed (37°C) 0.9% NaCl for 4 min. followed by 4% (wt/vol) paraformaldehyde (pH 7.5) for 6 min. The aortic arch, including its main branchpoints (brachiocephalic trunk, left common carotid artery and left subclavian artery) were removed and fixed in 4% paraformaldehyde. All vessels were processed and embedded longitudinally in paraffin. The entire aortic arch was then cut into approximately 30 sections, and a series of 15 sections of 4 μm thickness, which represented the central area of the aortic arch with an intact morphology of the complete arch, was used for analysis.
Plasma cholesterol and triglycerides
Whole blood obtained was centrifugated (5000 rpm, 5 min.) for separating serum and stored at –20°C. Total serum cholesterol and serum triglyceride levels were determined in duplicate using commercially available enzymatic colorimetric assays (cholesterol CHOD-PAP and triglycerides GPO-PAP; ProDiagnostica, Freiburg, Germany).
Histology and morphometry
For histological analysis, four sections (16 μm apart), stained with Elastica von Giesson were used for the morphometrical analysis. Elastica von Giesson staining, which stains the elastic laminae, was used to delineate the internal elastic lamina, to permit an easier distinction between media and intima. The aortic arch region was defined as the aortic root to approximately 1.5 mm caudal from the left subclavian artery branchpoint. Main branchpoints were also included into the measurements: the brachiocephalic trunk, left common carotid artery and left subclavian artery. Plaque area, excluding the underlying media, was determined for each individual plaque as the number of pixels using Adobe Photoshop CS3 extended (San Jose, CA, USA) [32]. Plaque area was converted to square micrometres. Calcified areas were detected in von Kossa stainings in the same serial sections and in the same manner used to determine total plaque area; the relative calcification content was determined by dividing calcified area by plaque area. Opn- and macrophages (MΦ)- containing areas were detected by immunohistochemistry and determined in the same manner in which relative calcification content was estimated. Haematoxylin and eosin standard stain demonstrated general morphology.
Immunohistochemistry
A goat antimouse antibody reacting against OPN, was used in this study (R&D Systems GmbH, Wiesbaden-Nordenstadt, Germany). A monoclonal antibody, reacting against monocytes and macrophages (clone MOMA-2) was purchased from Serotec, Tokyo, Japan. The sections were stained with OPN and MOMA-2 (1:50) followed by biotin-conjugated goat anti-rat IgG followed by Streptavidin-biotin peroxidase complex (ABC Vectastain Elite Kit; Vector Laboratories, Burlingame, CA, USA) and counterstained with nuclear fast red or haematoxylin and eosin.
Isolation and culture of mouse SMCs
To isolate primary SMCs, the aorta of 6-week-old wt ApoE−/−, ttw/+ ApoE−/− and ttw/ttw ApoE−/− mice was explanted, and cultured in Dulbecco’s minimal Eagle medium (DMEM) containing 2% L-glutamine, 100 U/ml penicillin, 50 μg/ml streptomycin and 20% foetal calf serum (FCS) Gold (Lonza, Verviers, Belgium). The sprouted SMC were passaged and cultured in DMEM containing 10% FCS Gold. Only cultures containing more than 90% SMC specific α-actin (using a monoclonal antibody HHF35, 1:500; Dako Corporation, Carpenteria, CA, USA) and SM22α (using a monoclonal antibody 1B8, 1:250; Abcam plc, Cambridge, UK) positive stained cells in passage 3 were used for total RNA isolation.
RT-PCR analyses
Total RNA of SMC was isolated using RNeasy® Mini Kit (Qiagen GmbH, Hilden, Germany). One microgram of total RNA was reverse-transcribed after an initial denaturation step at 65°C for 10 min. in a total volume of 20 μl using 10 U/μl of Superscript™ III reverse transcriptase (Invitrogen™ Life Technologies, Paisley, UK), 1 U/μl Ribo Lock™ ribonuclease inhibitor (MBI Fermentas GmbH, St. Leon-Rot, Germany), 25 ng/μl oligo[(dT)12–18] (Invitrogen™ Life Technologies), 0.5 mmol/l each of 2′-desoxynucleoside-5′triphosphate (dNTP), 5 mmol/l dithiothreitol, 1× first strand buffer [250 mmol/l Tris-HCl (pH 8.4), 375 mmol/l KCl, 15 mmol/l MgCl2] freshly diluted from 5× stock (Invitrogen™ Life Technologies) at 37°C for 60 min. Samples were heated at 95°C for 5 min. to terminate reverse transcriptase activity. Total reverse transcription (RT) products were subsequently used for PCR amplification. mRNAs of SMC specific Sm22α, Mgp, Opn, Oc and the housekeeping gene Gapdh were assessed in aortic SMC.
The RT products (100 ng) were brought to a volume of 25 μl containing 1× Qiagen GmbH PCR buffer, 2.5 mM MgCl2, 0.1 mM of each dNTP, 1.5 U of Taq Polymerase (Qiagen GmbH) and 0.4 μM of each primer. Primers were designed across intron/exon boundaries.
Table S1 summarizes the individual sequences of the primers, annealing temperatures and cycle numbers used for each primer pair and the PCR product sizes. After denaturation at 95°C for 5 min. amplification was carried out in an Eppendorf Mastercycler® Gradient (Eppendorf AG, Hamburg, Germany) using the following temperature and time profile: denaturation at 95°C for 30 sec.; primer annealing at the respective temperatures for 60 sec.; primer extension at 72°C for 60 sec. and a final extension of 72°C for 10 min. 10 μl of the PCR reaction were analysed using standard agarose gel electrophoresis. To evaluate the relative expression, the agarose gels were scanned using a video documentation system and analysed using ImageJ software (version 1.40g; ImageJ, imagej.nih.gov/ij/). The absorption units were corrected for Gapdh mRNA levels.
Statistical analysis
Statistical analysis for comparison of multiple groups used one-way anova followed by the Tukey’s post hoc test, performed with GraphPad Prism software (version 4.0, GraphPad software; San Diego, CA, USA). Results were expressed as mean ± S.E.M. Probability values <0.05 were considered statistically significant.
Results
Npp1 deficiency decreases body weight without affecting serum lipid levels in ApoE null mice
Feeding a high-fat/high-cholesterol diet to wt ApoE−/−, ttw/+ ApoE−/− and ttw/ttw ApoE−/− mice caused hyperlipidemia reflected by elevated serum cholesterol and triglycerides compared to mice with normal chow diet (Table 1). There was no significant difference between genotypes. Body weight measurement revealed no difference between wt ApoE−/− and ttw/+ ApoE−/− mice, but weights of these genotypes were significantly higher than in ttw/ttw ApoE−/− mice. High-fat/high-cholesterol diet had no effect on body weight of all three genotypes compared to mice fed with normal chow diet (Table 1).
Table 1.
Serum cholesterol levels, serum triglyceride levels and body weight measurement in wt ApoE−/−, ttw/+ ApoE−/− and ttw/ttw ApoE−/− mice at different ages
| Time (weeks) | wt ApoE −/− | ttw/+ ApoE −/− | ttw/ttw ApoE −/− | |||||||||||||||||||||||||||||
|---|---|---|---|---|---|---|---|---|---|---|---|---|---|---|---|---|---|---|---|---|---|---|---|---|---|---|---|---|---|---|---|---|
| High-fat diet | Control diet | High-fat diet | Control diet | High-fat diet | Control diet | |||||||||||||||||||||||||||
| Cholesterol (mg/dl) | 13 | 635 ± 39 | 141 ± 91* | 541 ± 181* | 138 ± 24* | 705 ± 135 | 122 ± 51* | |||||||||||||||||||||||||
| 18 | 547 ± 260 | 88 ± 48* | 631 ± 83* | 116 ± 55* | 685 ± 35 | 122 ± 60* | ||||||||||||||||||||||||||
| 23 | 467 ± 222 | 54 ± 27* | 501 ± 70* | 80 ± 47* | 492 ± 156 | 107 ± 27* | ||||||||||||||||||||||||||
| 28 | 589 ± 256 | 62 ± 37* | 515 ± 306* | 97 ± 72* | 648 ± 332 | 65 ± 55* | ||||||||||||||||||||||||||
| Triglycerides (mg/dl) | 13 | 634 ± 71 | 150 ± 73* | 622 ± 63* | 168 ± 86* | 513 ± 178 | 142 ± 88* | |||||||||||||||||||||||||
| 18 | 328 ± 108 | 129 ± 39* | 310 ± 180* | 124 ± 38* | 396 ± 168 | 124 ± 23* | ||||||||||||||||||||||||||
| 23 | 493 ± 87 | 125 ± 94* | 333 ± 106* | 150 ± 65* | 414 ± 262 | 151 ± 47* | ||||||||||||||||||||||||||
| 28 | 361 ± 105 | 128 ± 70* | 350 ± 86* | 130 ± 59* | 297 ± 166 | 112 ± 33* | ||||||||||||||||||||||||||
| Body weight (g) | 13 | 22.5 ± 3.4 | 24.5 ± 1.7 | 22.0 ± 2.2 | 24.6 ± 4.9 | 19.3 ± 3.6 | 20.2 ± 2.3 | |||||||||||||||||||||||||
| 18 | 26.1 ± 2.9 | 27.2 ± 2.6 | 29.0 ± 4.9 | 29.3 ± 4.0 | 20.4 ± 2.5# | 21.2 ± 5.2 | ||||||||||||||||||||||||||
| 23 | 34.2 ± 4.4 | 29.1 ± 3.6 | 33.8 ± 5.0 | 29.1 ± 2.9 | 20.7 ± 3.4## | 23.0 ± 2.9# | ||||||||||||||||||||||||||
| 28 | 33.6 ± 2.9 | 32.0 ± 0.6 | 31.3 ± 2.8 | 30.3 ± 3.5 | 21.7 ± 2.8## | 22.4 ± 2.6## | ||||||||||||||||||||||||||
For serum cholesterol and triglycerides samples, blood was obtained by retro-orbital venipuncture from mice with high-fat/high-cholesterol diet (high-fat diet) and from mice fed with normal chow diet (control diet). Data are presented as mean ± S.D. for n= 4–6 mice. One-way anova was used to determine significant differences with Tukey’s post-hoc analysis comparing results from different genotypes.
P < 0.05 versus mice with high-fat/high-cholesterol diet, #P < 0.01 and ##P < 0.005, both versus wt ApoE−/− and ttw/+ ApoE−/− mice.
Opn expression is decreased in Npp1-deficient ApoE null aortic SMC
RNA preparations of cultured aortic SMC of wt ApoE−/−, ttw/+ ApoE−/− and ttw/ttw ApoE−/− littermate mice, demonstrated equal levels of expression of the SMC-specific marker sm22α as well as mgp (Fig. 1). The expression of Opn differed between the genotypes. In cultured ttw/+ ApoE−/− SMC Opn expression was down-regulated by approximately 14% compared to wt ApoE−/− SMC (P < 0.05), whereas Opn expression in ttw/ttw ApoE−/− SMC was decreased by approximately 30% compared to wt ApoE−/− SMC (P < 0.001).
Fig 1.
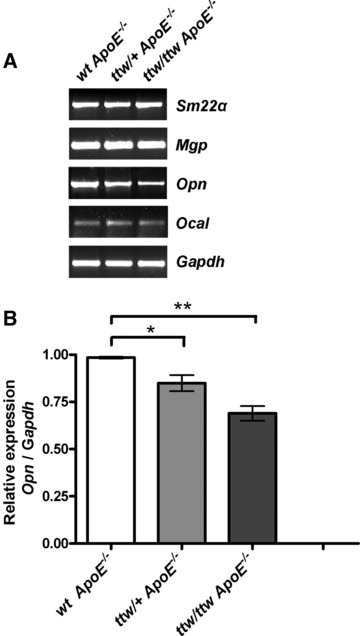
RT-PCR analysis for chondro-osseous gene expression in cultured aortic SMC preparations from wt ApoE−/−, ttw/+ ApoE−/− and ttw/ttw ApoE−/− mice. (A) Representative RT-PCR of one of four individual animals of each genotype is shown. (B) Relative expression of Opn corrected for housekeeping gene Gapdh. Aortic SMC from 6-week-old mice were harvested as described in ‘Material and methods’. The mRNAs were studied by RT-PCR in aliquots of 3 × 10⁴ cells cultured for eight days as described in ‘Material and methods’. Values represent the data mean ± S.E.M. One-way anova was used to determine significant differences with Tukey’s post-hoc analysis. *P < 0.05, **P < 0.001.
Opn expression is decreased in Npp1-deficient ApoE null atherosclerotic lesions
Opn was mainly present in areas of the plaque containing macrophages (Fig. 2). These areas were also the major sites of Enpp1 expression in the plaque (data not shown). After 28 weeks, the relative Opn content in atherosclerotic lesions was significant decreased in ttw/ttw ApoE−/− mice compared to wt ApoE−/− mice (23.7%± 11.6%versus 47.0%± 9.9%, P < 0.05, Figs 2A, E and S1). The relative Opn-containing area was lower by trend in ttw/+ ApoE−/− mice compared with wt ApoE−/− mice (34.7%± 11.1% for ttw/+ ApoE−/− versus 47.0%± 9.9% for wt ApoE−/− mice, P < 0.1; Figs 2A, C, E and S1).
Fig 2.
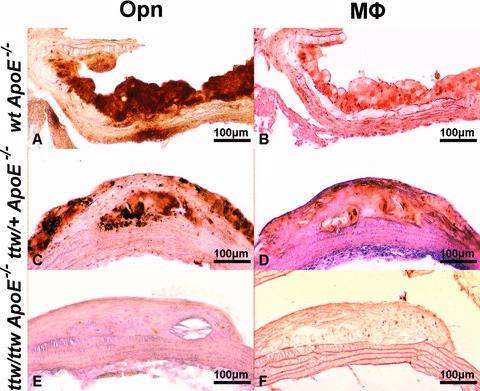
Representative stainings of Opn and macrophages in atherosclerotic lesions of 28-week-old mice. Opn (brown, A, C, E) and macrophages (brown, B, D, F) immunohistochemistry in wt ApoE−/− (A, B), ttw/+ ApoE−/− (C, D) and ttw/ttw ApoE−/− (E, F) mice fed a high-fat/high-cholesterol diet.
The macrophages-containing area expressed as percentage of total lesion area was smaller by trend in ttw/ttw ApoE−/− mice compared with ttw/+ ApoE−/− and wt ApoE−/− mice (22.2%± 14.2% for ttw/+ ApoE−/− versus 35.7%± 10.3% for ttw/+ ApoE−/− and 43.7%± 14.9% for wt ApoE−/− mice, P < 0.1; Figs 2B, D, F and S1).
Absence of Npp1 attenuates atherosclerosis in ApoE null mice
Mice of the three genotypes were analysed at 13, 18, 23 or 28 weeks of age. At the age of 13 weeks, 60% of ttw/ttw ApoE−/−, 80% of ttw/+ ApoE−/− and 100% of wt ApoE−/− mice developed atherosclerotic plaques in the aortic arch (Table 2). One hundred percent of older mice of all genotypes showed plaque development. The atherosclerotic lesion area in the aortic arch was carefully determined on 57 mice. Individual data points plotted by genotype and age are presented in Figure 4. There were no significant differences in the mean lesion area in the aortic arch between groups at 13, 18 and 23 weeks of age (Figs 3A–C, 4A–C and Table 2). However, in 28-week-old mice, ttw/+ ApoE−/− and ttw/ttw ApoE−/− mice had significantly smaller atherosclerotic lesions compared with wt ApoE−/− mice (*P < 0.05 for ttw/ttw ApoE−/− versus wt ApoE−/−, **P < 0.01 for ttw/+ ApoE−/− versus wt ApoE−/−; Figs 3D–F, 4D and Table 2). This finding was consistent when normalizing the lesion areas to the respective body weights of the animals (Fig. S2).
Table 2.
Summary of frequency of atherosclerotic lesions and mean atherosclerotic lesion areas
| Genotype | 13 weeks | 18 weeks | 23 weeks | 28 weeks |
|---|---|---|---|---|
| Frequency of lesions | ||||
| wt ApoE−/− | 100% (4/4) | 100% (6/6) | 100% (6/6) | 100% (5/5) |
| ttw /+ ApoE−/− | 80% (4/5) | 100% (4/4) | 100% (5/5) | 100% (4/4) |
| ttw /ttw ApoE−/− | 60% (3/5) | 100% (5/5) | 100% (4/4) | 100% (4/4) |
| Mean area of atherosclerotic lesion in μm2 | ||||
| wt ApoE−/− | 3.9 ± 1.8 | 108.4 ± 34.7 | 272.8 ± 48.0 | 997.7 ± 173.2 |
| ttw /+ ApoE−/− | 3.2 ± 1.3 | 61.5 ± 35.8 | 167.8 ± 28.0 | 353.7 ± 26.3 ** |
| ttw /ttw ApoE−/− | 5.8 ± 2.9 | 109.0 ± 38.1 | 222.4 ± 31.6 | 404.7 ± 54.8 * |
Values represent the mean ± S.E.M. Numbers in parenthesis indicate number of affected mice to number of mice in each group. One-way anova was used to determine significant differences with Tukey’s post-hoc analysis. *P < 0.05 versus wt ApoE−/− mice, **P < 0.01 versus wt ApoE−/− mice.
Fig 4.
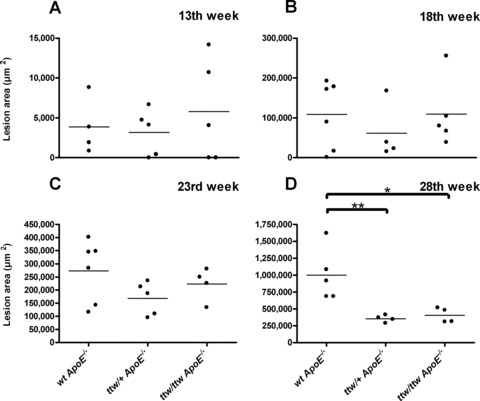
Mean atherosclerosis lesion area in individual mice sorted by genotype and age. Mean lesion area in μm2 was calculated in 13 (A), 18 (B), 23 (C) and 28-week-old mice (D). Bars represent the data mean. One-way anova was used to determine significant differences with Tukey’s post-hoc analysis. *P < 0.05 versus wt ApoE−/− mice, **P < 0.01 versus wt ApoE−/− mice.
Fig 3.
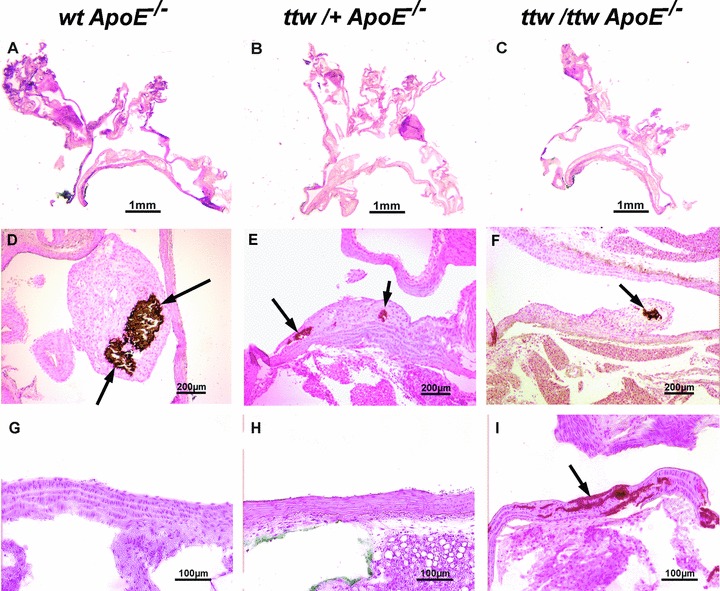
Representative aortic root sections of 28-week-old mice. wt ApoE−/− (A, D, G), ttw/+ ApoE−/− (B, E, H) and ttw/ttw ApoE−/− (C, F, I) mice fed a high-fat/high-cholesterol diet. Haematoxylin and eosin stained sections (A–C) of the whole aortic arch. Von Kossa staining for calcifications (brown, arrows) of atherosclerostic lesions (D–F) and the aortic wall (G–I).
Npp1 deficiency increases both media and atherosclerotic plaque calcification in ApoE null mice
von Kossa staining demonstrated aortic media calcifications in 60% of 13-week-old, 80% of 18-week-old and 100% of older ttw/ttw ApoE−/− mice, whereas ttw/+ ApoE−/− and wt ApoE−/− mice were totally devoid of medial calcification (Fig. 3G–I and Table 3). At the age of 28 weeks, plaque calcification developed in all genotypes, in 60% of wt ApoE−/− and 75% of ttw/+ ApoE−/− and ttw/ttw ApoE−/− mice (Fig. 3D–F). There was a non-significant increase in mean size of calcified areas in the intimal layer of ttw/ttw ApoE−/− and ttw/+ ApoE−/− compared with wt ApoE−/− mice (1332 μm2± 763.2 for ttw/ttw ApoE−/− and 1286 μm2± 621.1 for ttw/+ ApoE−/− versus 598 μm2± 290.7 for wt ApoE−/− mice, P= 0.36 and P= 0.32; Fig. 5C and Table 3). When expressed as percentage of total lesion area, the calcified lesion area was greater by trend in ttw/+ ApoE−/− mice compared with wt ApoE−/− mice (39.7%± 19.2% for ttw/+ ApoE−/− versus 6.4%± 2.8% for wt ApoE−/− mice, P < 0.1; Fig. 5D and Table 3).
Table 3.
Summary of frequency of medial and intimal calcifications, mean calcified areas and calcified area expressed as percentage of total lesion area
| Genotype | Region | 13 weeks | 18 weeks | 23 weeks | 28 weeks |
|---|---|---|---|---|---|
| Frequency of calcifications | |||||
| wt ApoE−/− | Media | 0% (0/4) | 0% (0/6) | 0% (0/6) | 0% (0/5) |
| Intima | 0% (0/4) | 17% (1/6) | 33% (2/6) | 60% (3/5) | |
| ttw /+ ApoE−/− | Media | 0% (0/5) | 0% (0/4) | 0% (0/5) | 0% (0/4) |
| Intima | 0% (0/5) | 0% (0/4) | 0% (0/5) | 75% (3/4) | |
| ttw /ttw ApoE−/− | Media | 60% (3/5) | 80% (4/5) | 100% (4/4) | 100% (4/4) |
| Intima | 0% (0/5) | 0% (0/5) | 25% (1/4) | 75% (3/4) | |
| Mean area of intimal calcifications in μm2 | |||||
| wt ApoE−/− | 0 | 113 ± 113 | 516.5 ± 347.3 | 598 ± 290.7 | |
| ttw/+ ApoE−/− | 0 | 0 | 0 | 1286 ± 621.1 | |
| ttw /ttw ApoE−/− | 0 | 0 | 50.25 ± 50.25 | 1332 ± 763.2 | |
| Calcified area as percentage of total lesion area | |||||
| wt ApoE−/− | 0% | 12.6%± 12.6% | 16.1%± 10.5% | 6.4%± 2.8% | |
| ttw/+ ApoE−/− | 0% | 0% | 0% | 39.7%± 19.2%a | |
| ttw /ttw ApoE−/− | 0% | 0% | 1.8%± 1.8% | 30.4%± 15.9% | |
Values represent the mean ± S.E.M. Numbers in parenthesis indicate number of mice in each group. One-way anova was used to determine significant differences with Tukey’s post-hoc analysis.
P < 0.1 versus wt ApoE−/− mice.
Fig 5.
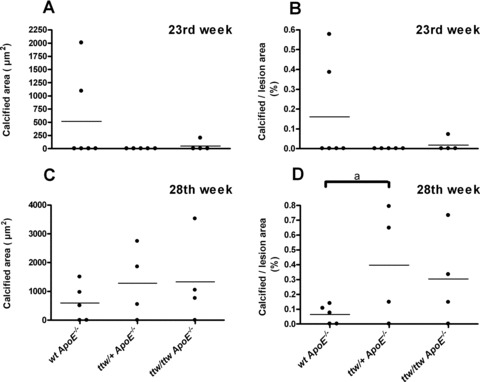
Calcified areas in individual mice, sorted by genotype and age. Mean calcified area in μm2 (A and C) and calcified area expressed as percentage of total lesion area (B and D) determined in 23- (A and B) and 28- (C and D) week-old mice. Bars represent the data mean. One-way anova was used to determine significant differences with Tukey’s post-hoc analysis. aP < 0.1 versus wt ApoE−/− mice.
Discussion
Our study was consistent with prior findings of media calcifications in the aorta of severely Npp1-deficient mice in the absence of atherosclerosis [18, 26] (and own unpublished results). Interestingly, we did not observe any medial calcification in ttw/+ mice with atherosclerosis, suggesting that one functional copy of Enpp1 transcript is sufficient to suppress media calcification. Instead, advanced plaques of 28-week-old ttw/+ ApoE−/− mice showed a tendency of an increase in the calcified to total lesion area ratio compared to wt ApoE−/− mice, suggesting that function- or expression-impairing mutations on one allele of ENPP1 may lead to increased calcified areas in late stages of atherogenesis. However this result was not statistically significant, which may be due to limited power of our study. Our results suggest that expression of NPP1 in the arterial wall is necessary to suppress intimal plaque calcification. This finding is in line with our previous study showing that NPP1 expression is down-regulated in calcified plaques compared to uncalcified atherosclerotic lesions in human carotid endarterectomy samples [29]. Interestingly, several studies on the K173Q genotype of ENPP1 in adults associated this with coronary calcification, aortic stiffness, myocardial infarction and earlier onset of peripheral arterial disease [33, 34]. Accordingly, we previously demonstrated a small decrease in enzymatic activity of the K173Q variant of NPP1 in vitro[16]; however, levels of enzymatic NPP1 activity in patients carrying this variant on one allele have not been studied yet.
In our study we show that, although one copy of ENPP1 is sufficient to suppress media calcification, it is not sufficient to suppress intima calcification in the context of atherosclerosis in mice. We would therefore speculate that those patients carrying the K173Q polymorphism of ENPP1 have an increased risk of intima calcification instead of media calcification. Conversely these patients might have a decreased atherosclerotic lesion burden compared to the general population.
In the current study, we show that in ApoE-deficient mice with total absence as well as with the partial loss of Npp1 Opn expression is reduced, leading to reduced Opn-containing areas in atherosclerotic lesions. Previous studies showed decreased Opn levels in Enpp1−/− mice osteoblast and arterial SMC [18, 23, 35]. Studies on different proteins involved in PPi metabolism, e.g. NPP1, the multiple-pass transmembrane protein ANK and the tissue non-specific alkaline phosphatase, determined that OPN expression is directly regulated by extracellular PPi levels [23, 36]. That reduced OPN levels correlate with reduced plaque size has been shown previously. Matsui et al. described 30–40% smaller atherosclerotic lesion areas in 36-week-old female Opn-deficient atherosclerotic (Opn/ApoE null) mice compared with ApoE null mice, due to less macrophages and lymphocytes in the lesion [37]. Also, in female 34-week-old Opn/ ApoE/ LDL receptor triple knockout mice, atherosclerotic lesion area is reduced compared with ApoE/ LDL receptor deficient mice [38]. Furthermore, it has been shown that transgenic mice that overexpress Opn are more prone to develop fatty streaks than wild-type mice [39]. We also found that the infiltration of macrophages in atherosclerotic lesions in Npp1-/ApoE-deficient mice was less extensive compared with ApoE-deficient mice by trend. These results are consistent with previous findings that OPN is a chemoattractant for macrophages [28]. We speculate that decreased Opn expression associated with Npp1 deficiency is a likely mediator of decreased atherogenesis in our mouse model.
Taken together, our study revealed that absolute NPP1 deficiency caused by a homozygous null mutation as well as partial deficiency caused by heterozygosity in the ENPP1 locus promote intimal plaque calcification and attenuate atherosclerotic lesion progression. Thus, although mutations on both ENPP1 alleles lead to GACI, mutations on one allele might be protective against atherosclerosis. Decreased OPN expression associated with NPP1 deficiency is a likely mediator of decreased atherogenesis but also likely promotes atherosclerotic plaque calcification.
Limitations of the study
Our study was limited by the short lifespan of Npp1-deficient mice, which is caused by the severity of the skeletal phenotype resulting in a feeding disorder. We had to accelerate atherosclerotic lesion development in Npp1 and ApoE double deficient mice by feeding a cholesterol-rich diet, because Npp1-deficient mice usually survive no longer than 30 weeks. For the atherosclerotic ApoE-deficient mice on chow diet, Rattazzi et al. described small areas of plaque calcification apparent between 45 and 60 weeks of age at the earliest [40]. In our study, because the atherogenesis was accelerated by a high-fat/high-cholesterol diet, we were not able to investigate effects of Npp1 deficiency on ‘natural’ plaque development in ApoE null mice.
Conclusions
Based on the results of our current study and previous work [29], we propose a novel model for modulation of NPP1 expression and the role of NPP1 in promotion of atherogenesis and suppression of intimal plaque calcification (Fig. 6). NPP1 generates PPi and thereby promotes OPN expression [23, 36], which is a known chemoattractant for monocyte macrophages [28]. It is known, that NPP1 is up-regulated by transforming growth factor (TGF)-β[41] and down-regulated by interleukin (IL)-1β[42]. During atherosclerotic lesion progression, the expression of pro-inflammatory cytokines including IL-1β is increased [43, 44], whereas TGF-β responsiveness is suppressed [45]. We speculate that this shift within lesions associated with decreased TGF-β responsiveness and increased inflammation including IL-1β expression could account for the drop in NPP1 expression in atherosclerotic lesions. This effect, linked with decreased PPi generation and inhibition of OPN expression has the capacity to promote calcification. It will be of interest to test this paradigm more directly in further in vivo studies.
Fig 6.
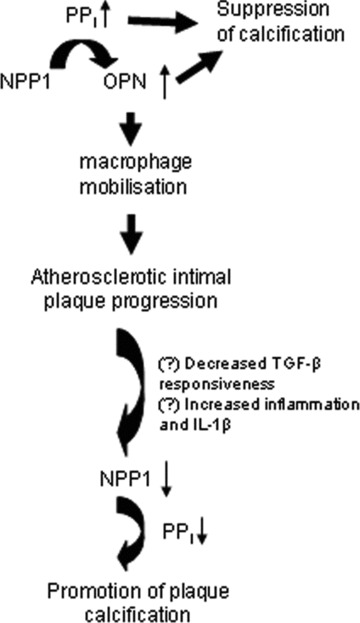
Model for modulation of NPP1 expression and role of NPP1 in atherogenesis and suppression of intimal plaque calcification based on results of promotion of atherosclerotic lesion development but suppression of intimal plaque calcification. This model is based on the results of a previous study that showed regulated expression of NPP1 and OPN in human atherosclerotic lesions [29], and is based on the results of the current study in ApoE knockout mice with partial and severe deficiency of Npp1 in ttw/+ and ttw/ttw mice. NPP1 generates PPi and thereby promotes OPN expression that promotes progression of atherogenesis. However, a shift within lesions to decreased TGF-β responsiveness [45] and increased inflammation including IL-1β expression [43, 44] could account for the previously described drop NPP1 expression in atherosclerotic lesion cells including SMCs. This effect, linked with decreased PPi generation and inhibition of OPN expression, promotes plaque calcification. We observe increased atherosclerotic plaque calcification in Npp1-/ApoE-deficient lesions in vivo in this study.
Acknowledgments
Y.N. and F.R. were supported by a grant from Deutsche Forschungsgemeinschaft (SFB 492 A12) and Interdisciplinary Center for Clinical Research, Muenster University. R.T. was supported by the VA research Service and NIH (HL087252, HL077360). The authors thank Elisabeth Lange, Ulrike Botschen, Sybille Koch and Birgit Geng for expert technical assistance.
Conflict of interest
The authors confirm that there are no conflicts of interest.
Supporting Information
Opn- and macrophages-containing areas inindividual 28-week-old mice, sorted by genotype. Area containingOpn (A) and macrophages (B) expressed as percentageof total lesion area in 28-week-old mice. Bars represent the datamean. One-way ANOVA was used to determine significant differenceswith Tukey's post hoc analysis. *P < 0.5,aP < 0.1.
Fig. S2 Mean lesion area normalized on body weight,sorted by genotype. Values represent mean lesion data inμm2 pro g body weight. One-way ANOVA was used todetermine significant differences with Tukey's post hocanalysis. *P < 0.05 versus wt ApoE-/-mice, **P < 0.01 versus wt ApoE-/- mice.
Table S1 Primer and PCR characteristics
References
- 1.Watson KE, Demer LL. The atherosclerosis-calcification link. Curr Opin Lipidol. 1996;7:101–4. doi: 10.1097/00041433-199604000-00009. [DOI] [PubMed] [Google Scholar]
- 2.Wilson PW, Kauppila LI, O’Donnell CJ, et al. Abdominal aortic calcific deposits are an important predictor of vascular morbidity and mortality. Circulation. 2001;103:1529–34. doi: 10.1161/01.cir.103.11.1529. [DOI] [PubMed] [Google Scholar]
- 3.Wayhs R, Zelinger A, Raggi P. High coronary artery calcium scores pose an extremely elevated risk for hard events. J Am Coll Cardiol. 2002;39:225–30. doi: 10.1016/s0735-1097(01)01737-5. [DOI] [PubMed] [Google Scholar]
- 4.Speer MY, Li X, Hiremath PG, et al. Runx2/Cbfa1, but not loss of myocardin, is required for smooth muscle cell lineage reprogramming toward osteochondrogenesis. J Cell Biochem. 2010;110:935–47. doi: 10.1002/jcb.22607. [DOI] [PMC free article] [PubMed] [Google Scholar]
- 5.Speer MY, Yang HY, Brabb T, et al. Smooth muscle cells give rise to osteochondrogenic precursors and chondrocytes in calcifying arteries. Circ Res. 2009;104:733–41. doi: 10.1161/CIRCRESAHA.108.183053. [DOI] [PMC free article] [PubMed] [Google Scholar]
- 6.Shao JS, Cai J, Towler DA. Molecular mechanisms of vascular calcification: lessons learned from the aorta. Arterioscler Thromb Vasc Biol. 2006;26:1423–30. doi: 10.1161/01.ATV.0000220441.42041.20. [DOI] [PubMed] [Google Scholar]
- 7.Canfield AE, Doherty MJ, Wood AC, et al. Role of pericytes in vascular calcification: a review. Z Kardiol. 2000;89:20–7. doi: 10.1007/s003920070096. [DOI] [PubMed] [Google Scholar]
- 8.Steitz SA, Speer MY, Curinga G, et al. Smooth muscle cell phenotypic transition associated with calcification: upregulation of Cbfa1 and downregulation of smooth muscle lineage markers. Circ Res. 2001;89:1147–54. doi: 10.1161/hh2401.101070. [DOI] [PubMed] [Google Scholar]
- 9.Tintut Y, Alfonso Z, Saini T, et al. Multilineage potential of cells from the artery wall. Circulation. 2003;108:2505–10. doi: 10.1161/01.CIR.0000096485.64373.C5. [DOI] [PubMed] [Google Scholar]
- 10.Murshed M, Harmey D, Millan JL, et al. Unique coexpression in osteoblasts of broadly expressed genes accounts for the spatial restriction of ECM mineralization to bone. Genes Dev. 2005;19:1093–104. doi: 10.1101/gad.1276205. [DOI] [PMC free article] [PubMed] [Google Scholar]
- 11.Bini A, Mann KG, Kudryk BJ, et al. Noncollagenous bone matrix proteins, calcification, and thrombosis in carotid artery atherosclerosis. Arterioscler Thromb Vasc Biol. 1999;19:1852–61. doi: 10.1161/01.atv.19.8.1852. [DOI] [PubMed] [Google Scholar]
- 12.Dhore CR, Cleutjens JP, Lutgens E, et al. Differential expression of bone matrix regulatory proteins in human atherosclerotic plaques. Arterioscler Thromb Vasc Biol. 2001;21:1998–2003. doi: 10.1161/hq1201.100229. [DOI] [PubMed] [Google Scholar]
- 13.Tyson KL, Reynolds JL, McNair R, et al. Osteo/chondrocytic transcription factors and their target genes exhibit distinct patterns of expression in human arterial calcification. Arterioscler Thromb Vasc Biol. 2003;23:489–94. doi: 10.1161/01.ATV.0000059406.92165.31. [DOI] [PubMed] [Google Scholar]
- 14.Weissen-Plenz G, Nitschke Y, Rutsch F. Mechanisms of arterial calcification: spotlight on the inhibitors. Adv Clin Chem. 2008;46:263–93. [PubMed] [Google Scholar]
- 15.Rutsch F, Terkeltaub R. Deficiencies of physiologic calcification inhibitors and low-grade inflammation in arterial calcification: lessons for cartilage calcification. Joint Bone Spine. 2005;72:110–8. doi: 10.1016/j.jbspin.2004.05.014. [DOI] [PubMed] [Google Scholar]
- 16.Rutsch F, Ruf N, Vaingankar S, et al. Mutations in ENPP1 are associated with ‘idiopathic’ infantile arterial calcification. Nat Genet. 2003;34:379–81. doi: 10.1038/ng1221. [DOI] [PubMed] [Google Scholar]
- 17.Luo G, Ducy P, McKee MD, et al. Spontaneous calcification of arteries and cartilage in mice lacking matrix GLA protein. Nature. 1997;386:78–81. doi: 10.1038/386078a0. [DOI] [PubMed] [Google Scholar]
- 18.Johnson K, Polewski M, van ED, et al. Chondrogenesis mediated by PPi depletion promotes spontaneous aortic calcification in NPP1-/- mice. Arterioscler Thromb Vasc Biol. 2005;25:686–91. doi: 10.1161/01.ATV.0000154774.71187.f0. [DOI] [PubMed] [Google Scholar]
- 19.Rutsch F, Vaingankar S, Johnson K, et al. PC-1 nucleoside triphosphate pyrophosphohydrolase deficiency in idiopathic infantile arterial calcification. Am J Pathol. 2001;158:543–54. doi: 10.1016/S0002-9440(10)63996-X. [DOI] [PMC free article] [PubMed] [Google Scholar]
- 20.Bollen M, Gijsbers R, Ceulemans H, et al. Nucleotide pyrophosphatases/phosphodiesterases on the move. Crit Rev Biochem Mol Biol. 2000;35:393–432. doi: 10.1080/10409230091169249. [DOI] [PubMed] [Google Scholar]
- 21.Polewski MD, Johnson KA, Foster M, et al. Inorganic pyrophosphatase induces type I collagen in osteoblasts. Bone. 2010;46:81–90. doi: 10.1016/j.bone.2009.08.055. [DOI] [PMC free article] [PubMed] [Google Scholar]
- 22.Terkeltaub RA. Inorganic pyrophosphate generation and disposition in pathophysiology. Am J Physiol Cell Physiol. 2001;281:C1–11. doi: 10.1152/ajpcell.2001.281.1.C1. [DOI] [PubMed] [Google Scholar]
- 23.Johnson K, Goding J, van Etten D, et al. Linked deficiencies in extracellular PP(i) and osteopontin mediate pathologic calcification associated with defective PC-1 and ANK expression. J Bone Miner Res. 2003;18:994–1004. doi: 10.1359/jbmr.2003.18.6.994. [DOI] [PubMed] [Google Scholar]
- 24.Scatena M, Liaw L, Giachelli CM. Osteopontin: a multifunctional molecule regulating chronic inflammation and vascular disease. Arterioscler Thromb Vasc Biol. 2007;27:2302–9. doi: 10.1161/ATVBAHA.107.144824. [DOI] [PubMed] [Google Scholar]
- 25.Rutsch F, Böyer P, Nitschke Y, et al. Hypophosphatemia, hyperphosphaturia and bisphosphonate treatment are associated with survival beyond infancy in generalized arterial calcification of infancy (GACI) Circ: Cardiovasc Genet. 2008;1:133–40. doi: 10.1161/CIRCGENETICS.108.797704. [DOI] [PMC free article] [PubMed] [Google Scholar]
- 26.Hosoda Y, Yoshimura Y, Higaki S. A new breed of mouse showing multiple osteochondral lesions–twy mouse. Ryumachi. 1981;21:157–64. [PubMed] [Google Scholar]
- 27.Okawa A, Nakamura I, Goto S, et al. Mutation in Npps in a mouse model of ossification of the posterior longitudinal ligament of the spine. Nat Genet. 1998;19:271–3. doi: 10.1038/956. [DOI] [PubMed] [Google Scholar]
- 28.Giachelli CM, Lombardi D, Johnson RJ, et al. Evidence for a role of osteopontin in macrophage infiltration in response to pathological stimuli in vivo. Am J Pathol. 1998;152:353–8. [PMC free article] [PubMed] [Google Scholar]
- 29.Nitschke Y, Hartmann S, Torsello G, et al. Expression of NPP1 is regulated during atheromatous plaque calcification. J Cell Mol Med. 2009 doi: 10.1111/j.1582-4934.2009.00988.x. 10.1111/j.1582-4934.2009.00988.x. [DOI] [PMC free article] [PubMed] [Google Scholar]
- 30.Curtiss LK, Boisvert WA. Apolipoprotein E and atherosclerosis. Curr Opin Lipidol. 2000;11:243–51. doi: 10.1097/00041433-200006000-00004. [DOI] [PubMed] [Google Scholar]
- 31.Zhang SH, Reddick RL, Piedrahita JA, et al. Spontaneous hypercholesterolemia and arterial lesions in mice lacking apolipoprotein E. Science. 1992;258:468–71. doi: 10.1126/science.1411543. [DOI] [PubMed] [Google Scholar]
- 32.McRobb L, Handelsman DJ, Heather AK. Androgen-induced progression of arterial calcification in apolipoprotein E-null mice is uncoupled from plaque growth and lipid levels. Endocrinology. 2009;150:841–8. doi: 10.1210/en.2008-0760. [DOI] [PubMed] [Google Scholar]
- 33.Bacci S, Ludovico O, Prudente S, et al. The K121Q polymorphism of the ENPP1/PC-1 gene is associated with insulin resistance/atherogenic phenotypes, including earlier onset of type 2 diabetes and myocardial infarction. Diabetes. 2005;54:3021–5. doi: 10.2337/diabetes.54.10.3021. [DOI] [PubMed] [Google Scholar]
- 34.Eller P, Schgoer W, Mueller T, et al. The K121Q polymorphism of ENPP1 and peripheral arterial disease. Heart Vessels. 2008;23:104–7. doi: 10.1007/s00380-007-1014-9. [DOI] [PubMed] [Google Scholar]
- 35.Harmey D, Hessle L, Narisawa S, et al. Concerted regulation of inorganic pyrophosphate and osteopontin by akp2, enpp1, and ank: an integrated model of the pathogenesis of mineralization disorders. Am J Pathol. 2004;164:1199–209. doi: 10.1016/S0002-9440(10)63208-7. [DOI] [PMC free article] [PubMed] [Google Scholar]
- 36.Addison WN, Azari F, Sorensen ES, et al. Pyrophosphate inhibits mineralization of osteoblast cultures by binding to mineral, up-regulating osteopontin, and inhibiting alkaline phosphatase activity. J Biol Chem. 2007;282:15872–83. doi: 10.1074/jbc.M701116200. [DOI] [PubMed] [Google Scholar]
- 37.Matsui Y, Rittling SR, Okamoto H, et al. Osteopontin deficiency attenuates atherosclerosis in female apolipoprotein E-deficient mice. Arterioscler Thromb Vasc Biol. 2003;23:1029–34. doi: 10.1161/01.ATV.0000074878.29805.D0. [DOI] [PubMed] [Google Scholar]
- 38.Strom A, Franzen A, Wangnerud C, et al. Altered vascular remodeling in osteopontin-deficient atherosclerotic mice. J Vasc Res. 2004;41:314–22. doi: 10.1159/000079205. [DOI] [PubMed] [Google Scholar]
- 39.Isoda K, Kamezawa Y, Ayaori M, et al. Osteopontin transgenic mice fed a high-cholesterol diet develop early fatty-streak lesions. Circulation. 2003;107:679–81. doi: 10.1161/01.cir.0000055739.13639.d7. [DOI] [PubMed] [Google Scholar]
- 40.Rattazzi M, Bennett BJ, Bea F, et al. Calcification of advanced atherosclerotic lesions in the innominate arteries of ApoE-deficient mice: potential role of chondrocyte-like cells. Arterioscler Thromb Vasc Biol. 2005;25:1420–5. doi: 10.1161/01.ATV.0000166600.58468.1b. [DOI] [PubMed] [Google Scholar]
- 41.Cailotto F, Bianchi A, Sebillaud S, et al. Inorganic pyrophosphate generation by transforming growth factor-beta-1 is mainly dependent on ANK induction by Ras/Raf-1/extracellular signal-regulated kinase pathways in chondrocytes. Arthritis Res Ther. 2007;9:R122. doi: 10.1186/ar2330. [DOI] [PMC free article] [PubMed] [Google Scholar]
- 42.Lotz M, Rosen F, McCabe G, et al. Interleukin 1 beta suppresses transforming growth factor-induced inorganic pyrophosphate (PPi) production and expression of the PPi-generating enzyme PC-1 in human chondrocytes. Proc Natl Acad Sci USA. 1995;92:10364–8. doi: 10.1073/pnas.92.22.10364. [DOI] [PMC free article] [PubMed] [Google Scholar]
- 43.Galea J, Armstrong J, Gadsdon P, et al. Interleukin-1 beta in coronary arteries of patients with ischemic heart disease. Arterioscler Thromb Vasc Biol. 1996;16:1000–6. doi: 10.1161/01.atv.16.8.1000. [DOI] [PubMed] [Google Scholar]
- 44.Dewberry R, Holden H, Crossman D, et al. Interleukin-1 receptor antagonist expression in human endothelial cells and atherosclerosis. Arterioscler Thromb Vasc Biol. 2000;20:2394–400. doi: 10.1161/01.atv.20.11.2394. [DOI] [PubMed] [Google Scholar]
- 45.Chen CL, Liu IH, Fliesler SJ, et al. Cholesterol suppresses cellular TGF-beta responsiveness: implications in atherogenesis. J Cell Sci. 2007;120:3509–21. doi: 10.1242/jcs.006916. [DOI] [PMC free article] [PubMed] [Google Scholar]
Associated Data
This section collects any data citations, data availability statements, or supplementary materials included in this article.
Supplementary Materials
Opn- and macrophages-containing areas inindividual 28-week-old mice, sorted by genotype. Area containingOpn (A) and macrophages (B) expressed as percentageof total lesion area in 28-week-old mice. Bars represent the datamean. One-way ANOVA was used to determine significant differenceswith Tukey's post hoc analysis. *P < 0.5,aP < 0.1.
Fig. S2 Mean lesion area normalized on body weight,sorted by genotype. Values represent mean lesion data inμm2 pro g body weight. One-way ANOVA was used todetermine significant differences with Tukey's post hocanalysis. *P < 0.05 versus wt ApoE-/-mice, **P < 0.01 versus wt ApoE-/- mice.
Table S1 Primer and PCR characteristics