

Abstract
The nucleotidyl transfer reaction leading to formation of the first phosphodiester bond has been followed in real-time by Raman microscopy, as it proceeds in single crystals of the N4 phage virion RNA polymerase (RNAP). The reaction is initiated by soaking NTP substrates and divalent cations into the RNAP and promoter DNA complex crystal, where the phosphodiester bond formation is completed in about 40 minutes. This slow reaction allowed us to monitor the changes of RNAP and DNA conformations as well as bindings of substrate and metal through Raman spectra taken every 5 minutes. Recently published snapshot X-ray crystal structures along the same reaction pathway assisted the spectroscopic assignments of changes in the enzyme and DNA, while isotopically labeled NTP substrates allowed differentiation of the Raman spectra of bases in substrates and DNA. We observed that substrates are bound at 2-7 minutes after commencing soaking, the O-helix completes its conformational change, and that binding of both divalent metals required for catalysis in the active site changes the conformation of the ribose triphosphate at position +1. These are followed by a slower decrease of NTP triphosphate groups due to phosphodiester bond formation that reaches completion at about 15 minutes, and even slower complete release of the divalent metals at about 40 minutes. We have also shown that the O-helix movement can be driven by substrate binding only. The kinetics of the in crystallo nucleotidyl transfer reaction revealed in this study suggest that soaking the substrate and metal into the RNAP-DNA complex crystal for a few minutes generates novel and uncharacterized intermediates for future X-ray and spectroscopic analysis.
INTRODUCTION
RNA polymerase (RNAP) transcribes a DNA sequence into RNA and plays a pivotal role in gene expression. Recently, Gleghorn et al. reported a suite of structural snapshots throughout transcript initiation, 1 where the first two NTPs in the RNA are linked to form a phosphodiester bond, by using a central domain of single-subunit N4 phage virion-encapsulated RNAP (minivRNAP) complexed with promotor DNA2 (Figure 1). By varying soak-in conditions and by using a substrate analog soaking into a preformed RNAP-promoter DNA complex (Binary Complex, BC) crystals, Gleghorn et al. were able to capture two unreacted complexes Substrate Complex I (SCI) and Substrate Complex II (SCII), and a third complex (Product Complex, PC) where the reaction had run to completion in the crystal forming the product. Based on these structures, a reaction scheme for transcript initiation by a single-subunit RNAP was proposed similar to that shown in Scheme 1.
Fig. 1.

RNAP active structure and promoter DNA sequence. A) The active site structure of the transcript initiation complex (SCII) including the N4 mini-vRNAP(Fingers, Palm and O-helix are labeled with colors), promoter DNA (pink tube), two GTPs (ball and stick model, +1 and +2 are green and magenta, respectively) and two divalent metals (yellow balls). B) Sequence and secondary structure of the promoter DNA constructs used for Raman crystallography experiments. Nucleotide binding sites (+1 and +2) for the transcript initiation complex formation are colored in red.
Scheme 1.

(this is for the GTP and ATP substrates used here: Gleghorn et al.1 used mainly two GTPs, see Supplementary):
The corresponding X-ray structures form a molecular basis for understanding NTP and metal loading at the active site as well as the alignment of the nucleotides’ reactive groups O3′(+1) and αP(+2) for transcript initiation. The overall structures of the complexes from BC→SCI→SCII→PC are very similar with the ones in Gleghorn et al.1 and only the active site local conformations are different (in Gleghorn et. al 20111, Figures 3 and 4). Comparing SCI with BC, 2 NTPs comprising the +1 and +2 nucleotides are bound at the active site by Watson-Crick base pairing with the complementary DNA template, and through several hydrogen bonds with residues on the Fingers subdomain (including Y612 and Y678). The binding of NTPs leads to a 6.7° movement of an α-helix (O-helix) of the Fingers subdomain, and a divalent metal -the nucleotide binding metal (MeB) -forms octahedral coordination with the triphosphate group of +2 nucleotide and two conserved Aspartic acids (D559 and D951). In SCII, a second divalent metal -catalytic metal (MeA ) – binds at the active site that realigns the reaction groups and decreases the distance between O3′(+1) and αP(+2) for the phosphodiester bond formation. The D559 and D951 residues in SCII are each coordinated with both MeA and MeB. When the 2-mer RNA and pyrophosphate are formed in the PC, pyrophosphate is still present in the active site and the O-helix has not returned to the original conformation; however no divalent metals are observed in the active site, indicating they are released after the nucleotidyl transfer reaction. All complexes were obtained through overnight soaking using different soaking solutions, thereby the X-ray study could not provide any direct evidence for the temporal order of reaction intermediates. In this study, the formation of intermediate complexes throughout the transcript initiation is followed by Raman microscopy in real-time after the soakings are initiated.
Fig. 3.

The changes from BC to SCI. A) Comparing the spectra of 15N and 13C labeled *GTP (red line) and *ATP (green line) with Raman difference spectrum of SCI at 41 min - BC (brown line). The Raman features from labeled GTP (*G) and ATP (*A) are marked green; features due to DNA perturbations are marked in blue, and features due to changes in the enzyme are marked in magenta. B) Superposition of the active site structures of BC (dark grey) and SCI (yellow). C) Substrate population change in the crystal over time from BC (time = 0) to SCI. Relative intensities at 701 (blue diamonds), 1125 (green triangles) and 1521 (red squares) cm−1 in SCI at x min – BC are plotted as a function of time. The Phe intensity at 1004 cm−1 in spectrum SCI at x min is used as internal standard. Peaks at 701, 1125 and 1521 cm−1 are due to bound *A breathing mode, triphosphate mode, and *G*A ring modes combined, respectively, as shown in Fig 3A. D) Changes of O-helix and metal-carboxylate coordination over time from BC to SCI. Relative intensities at 945 cm−1 due to α-helix change (blue crosses, corresponding to O-helix rotation as it is the only α-helix change according to X-ray crystallography), and 1400 cm−1 due to metal-carboxylate coordination (red circles, corresponding to metal coordinating with D559 and D951) in spectra SCI at x min – BC are plotted as a function of time. The Phe intensity at 1004 cm−1 in SCI at x min is used as internal standard.
Fig. 4.

The changes from BC to SCII with SCII and SCI structure overlay. A) Comparing the spectra of 15N and 13C labeled GTP (red line) and unlabeled AMPCPP (green line) with Raman difference spectrum of SCII at 53 min - BC (orange line). The Raman features from bound labeled GTP (*G) and unlabeled AMPCPP (A) are marked green; features due to DNA perturbations are marked in blue, and features due to changes in the enzyme are marked in magenta. B) Superposition of the active site structures of SCI (yellow) and SCII (green). C) Substrate population change in the crystal over time from BC (time = 0) to SCII. Relative intensities at 717 (blue diamonds), 1125 (green triangles) and 1521 (red squares) cm−1 in SCII at x min – BC are plotted as a function of time. The Phe intensity at 1004 cm−1 in spectrum SCII at x min is used as internal standard. Peaks at 717, 1125 and 1521 cm−1 are due to bound A breathing mode, triphosphate mode of *GTP, and *G ring mode, respectively, as shown in Fig 4A. D) Changes of O-helix and metal-carboxylate coordination over time from BC to SCII. Relative intensities at 945 cm−1 due to α-helix change (red crosses, corresponding to O-helix rotation), and 1400 cm−1 due to metal-carboxylate coordination (green circles, corresponding to metal ions coordinating with D559 and D951) in spectra SCII at x min – BC are plotted as a function of time. The Phe intensity at 1004 cm−1 in SCII at x min is used as internal standard.
Raman microscopy has been used to characterize subtle chemical changes occurring in single crystals on the time scale of seconds to minutes3,4. For an enzyme its Raman spectrum is recorded for a single crystal in a hanging drop placed inside a well of a standard crystallization tray standing on the microscope stage. A ligand is manually injected into the drop penetrating the crystal, typically taking a minute for a small molecule such as an NTP to reach equilibrium in the crystal. The Raman spectrum is taken at several time points following soak-in and the difference spectrum [Raman of complex at time t] minus [Raman of original crystal] provides information on the state of the bound ligand at time t as well as on any conformational changes in the protein brought about by ligand binding. We have used this approach in extensive studies of clinical inhibitors, that act as suicide substrates, blocking the active sites of β-lactamase enzymes that are a source of drug resistance5. The RNAP reaction presented here is much more complex; however, in crystallo Raman spectroscopy is made tractable by the existence of the high-resolution X-ray structures of the complexes1, by the use of isotopically labeled substrates and by the fact that the RNAP reaction in crystals is slow and occurs over a time scale of minutes. We are able to introduce a temporal landscape that describes the time dependence of multiple events, and the order in which they occur, during the soak-ins for SCI, SCII and during the reaction itself inside a single crystal. We also show that the Raman results present new opportunities for studying, by spectroscopy and crystallography, hitherto undetected and unstable intermediates on the reaction pathway.
MATERIALS AND METHODS
N4 mini-vRNAP and DNA purifications, and Crystallization of Binary Complex
Methods for purification of N-terminal His6-tagged mini-vRNAP and promoter DNA, and for crystallization of the binary complex (BC) containing P2_7c DNA and N4 mini-vRNAP were as described in Gleghorn et. al., 2008 2. The sequence and secondary structure of promoter DNA P2_7c is shown in Fig. 1B.
ANALYSIS OF RAMAN DATA
The Raman spectra of single crystals of BC and SCI are overlaid in Figure 2. The quality of the data is exemplary with a signal to noise of 300:1 where 100 mW of 647 nm laser excitation and a total of 100 secs acquisition time are used. Considerable care has to be taken with crystal -laser beam alignment to obtain the near perfect spectral overlap seen in Figure 2. A small feature due to *GTP and *ATP can be seen for SCI in a “spectral window” near 1520 cm−1. This is indicated on the spectrum along with other assignments for protein features that are based on standard literature 6,7. The near identity of the spectra in Figure 2 is further evidence that the structures of major portions of BC and SCI are very similar or identical.
Fig. 2.

Raman spectra of BC and SCI at41 min, overlaid. The spectrum of BC is in blue and spectrum of SCI at 41 min is in Red. The spectra overlap with great fidelity, indicating the overall folding of the complexes are the same. Subtle differences are observed around 706, 1120, 1250-1341 and 1519 cm−1, which are clearly shown in difference spectrum in Fig 3A.
The Raman difference spectrum, after a 41 min soak with 5 mM *GTP and *ATP and 10 mM Mg2+, [SCI] minus [BC] is shown in Figure 3A. This spectrum is noisier (S/N ~10:1) since features in the difference spectra are less than 5% of the intensity of the major bands seen in Figure 2. This imposes limits on the accuracy of kinetic values derived below that are based on changes in the standardized intensities of the various marker bands and prevents the derivation of accurate rate constants. Nevertheless, we are confident that the kinetic data presented are valid in a semi-quantitative sense and accurately describe the trends in population levels we discuss.
Spectroscopic assignments
There are two major factors that assist in assigning features in the difference spectra. We have used GTP and ATP totally labeled with 13C and 15N, identified as *GTP and *ATP. This lowers the characteristic G and A ring modes typically by 20 -40 cm−1 8 (Supplementary Fig. 1), allowing us to unambiguously distinguish GTP and ATP signals from the analogous bases in the DNA template. Secondly we have pioneered the approach of assignment of Raman signals by using X-ray crystallography structures as a guide. Atomic resolution (1.8~2.1 Å) X-ray structures for BC, SCI, SCII and PC show that the changes in going from BC to the other complexes are small and are limited to DNA and protein groups in and near the active site 1. This fact allows us to assign with confidence Raman bands detected in the difference spectra to individual structural features or amino acid side chains.
In the Raman difference spectra we present here, [BC with NTPs and metal] minus [BC], all contributions from the NTPs or product will appear “above” the baseline in the “positive” direction; contributions due to changes in RNAP or DNA (caused by the addition of the NTPs and metal) can be in the “positive” or “negative” direction. Addition of metal via “soaking in” causes small up-shifts in triphosphate and backbone -PO2− modes that, for the latter, result in a characteristic, derivative type, spectral signature 4,9 in the difference trace.
Using X-ray structures to aid spectroscopic interpretation
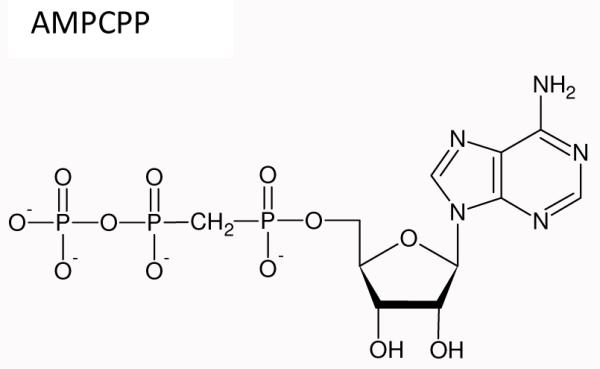
In 2008, Gleghorn et al.2 published the structure of the binary complex (BC), a 1,105 amino acid catalytic fragment of N4 vRNAP (N4 mini-vRNAP) containing the 35 nt DNA template. The active site structure and the DNA sequence are shown in Figure 1. Recently, they published the structures of the transcript initiation complexes SCI, SCII and PC1 shown in Scheme 1 at atomic resolution of 1.8 to 2.1 Å. SCI, substrate complex one, was formed in RNAP crystals by limiting the amount of magnesium used in the soak so that only the nucleotide binding metal was present and the second metal needed for catalysis was absent. Substrate complex II, SCII, had both metals present but the reaction did not take place because an unreactive analog, AMPCPP, was bound at the +2 position (see Figure 1).
Product complex, PC contained 2 molecules of GTP linked by a phosphodiester bond and resulted from soaking RNAP crystals with GTP and Mg2+ overnight (Gleghorn et al.,1). To form SCII containing two divalent cations including catalytic and nucleotide binding metals in the active site, Mn2+ was used instead of Mg2+ for soaking. The affinity of metal to the catalytic metal binding site is weak and the 0.11M dibasic ammonium citrate in the soaking solution binds tightly with Mg2+ but not as effectively with Mn2+: thereby increasing the free divalent cation concentration1. As mentioned previously the structures of the initiation complexes very closely resemble that of BC with the changes occurring only in or near the active site. The structure around the active site for BC, SCI, SCII and PC are compared in Figs 3B, 4B, and 5B. The major portions of the RNAP and DNA are essentially unchanged. Thus, when we perform the Raman difference operation e.g. [Raman spectrum SCI, time t] minus [Raman spectrum BC] we can identify many of the features in the difference spectrum with the changes that have occurred near the active site. The following structural changes identified from the X-ray crystallography study are used to inform the analysis of the Raman data:
-
*
Going from BC to SCI, SCII or PC the O-helix changes its position, undergoing a rotation of 7.6 °. This change is virtually identical in all three initiation complexes and is the only significant change in helix orientation throughout the structures (Figure S7, Supplementary Material). Thus, the α-helix feature in Figures 3A, 4A and 5A near 945 cm−1 is assigned to the O-helix. The rotation markedly changes the environments of the Y612 and Y678.
-
*
Going from BC to SCI, SCII or PC the substrate NTPs base pair with the complementary bases on the DNA template at +1 and +2 positions and bring about very similar changes in DNA structure. This gives rise to changes in the intensity of DNA base ring modes, detected at 1345 and 785 cm−1 in Figure 3A.
-
*
SCI is formed as a stable entity by limiting the available concentration of Mg2+ used for the soak-in solution. Consequently only metal B is found coordinated by three non-bridging oxygens on the triphosphate of the +2 substrate, the carboxylate side chains of D559 and D951and a backbone amide C=O of G560 (Fig. 3C). The presence of the carboxylates is important because they are the only acid side chains coordinating a Mg2+ going from BC to SCI. Free COO−s have a Raman marker band near 1400 cm−1 that shifts when binding to metal creating a negative feature near 1400 in the [SCI] minus [BC] difference spectrum10. SCII has both metal sites A (catalytic) and B (nucleotide binding) fully formed (Fig. 4B). The nucleotidyl transfer reaction cannot occur because *ATP is replaced by its unreactive analog AMPCPP. As in SCI, both D559 and D951 are directly bound to both Mn2+, this time as bridging ligands. Going from SCI to SCII the triphosphate chain on GTP undergoes a major conformational change, the γP moves 5.9 Å to allow the γP group on GTP to interact with the catalytic metal1.
-
*
The PC structure was obtained following an overnight soak. The active site (Fig. 5B) retains GTP (+1) bound to G (+2) (or A in the case of Raman experiments) by a phosphodiester linkage and the bases retain contact with the complementary bases on the DNA template. The triphosphate “tail” of the GTP (+1) moves from its position in SCII (Fig. 5B) to a position close to that seen in SCI. Both metals are absent from the active site and the second product, pyrophosphate, is bound to K666, R660 and Y6121.
Fig. 5.

Changes during PC formation. A) Raman difference spectra of PC at 2 min - BC (red line) and PC at 35 min - BC (blue line). The assignments are marked in the upper spectrum: Substrates *GTP and *ATP are in green, perturbations from DNA are in blue, and changes of the enzyme are in magenta. B) Superposition of the active site structures of SCII (green) and PC (orange). C) A close-up spectroscopic comparison of the bound *GTP conformation in SCI, SCII and PC. In a window from 600 to 750 cm−1, the breathing mode of *G around 640-650 cm−1 is shown in SCI at 41 min – BC (purple line), SCII at 53 min – BC (green line), PC at 2 min – BC (red line), and PC at 35 min – BC (blue line).
Collecting and processing Raman spectra from binary complex (BC) to substrate complex I (SCI)
The Raman data from a single crystal of RNAP and DNA complex were collected using a Raman microscope 3. A BC crystal was stabilized in a hanging drop (4.5 μl) containing equilibrium buffer (0.1M Tris-HCl, pH 8, 0.11 M ammonium citrate dibasic, 0.09M ammonium dihydrogen monophosphate and 15% PEG3350). The drop was sealed in a well containing 1 ml solution (15% PEG 3350) held in a crystallization tray on the microscope stage. A 647 nm laser beam, with a power of 120 mW was focused in the BC crystal. The scattered light from the crystal was collected using back scattering geometry through the Raman microscope and via fiber optics transmitted to a Kaiser Optical spectrograph with a charge-coupled device detector (CCD). This generated the BC Raman spectrum, which was saved and displayed in the computer controlling the detection system. Each Raman spectrum was collected from 10s × 30 accumulations, controlled through Holograms software (Kaiser Optical). A Raman spectrum of the equilibrium buffer (EB) around the crystal was also collected. To obtain a “pure” BC spectrum, the spectral subtraction [BC] minus [EB] was performed in the Grams/AI (Galactic Inc.) software, using the buffer peak at 849 cm−1 as the internal standard. Subsequently, a 0.5 μl concentrated solution (50 mM 15N and 13C labeled GTP (*GTP), 50 mM 15N and 13C labeled ATP (*ATP), 100 mM MgCl2, 0.1 M Tris-HCl pH 8.0, 0.11 M dibasic ammonium citrate, 0.09 M ammonium dihydrogen monophosphate, 15% PEG 3350) was injected into the hanging drop. In this soaking condition, the BC is transformed to SCI containing N4 mini-vRNAP, P2-7c DNA, *GTP, *ATP and single Mg2+ atom at the nucleotide binding metal site1. The time of injecting the concentrated substrate and metal solution into the drop around the crystal was recorded as time 0 minute. During the soak, a Raman spectrum of the crystal undergoing the BC to SCI reaction was collected every 5-10 min, recorded as [SCI crystal x min] where x min equals the time when the spectrum was started to be collected relative to the time point 0 min. A spectrum of the soaking buffer was collected every 30 min and recorded as [SCI soaking buffer t min], where t equals the time from soaking time 0 min to the time when this spectrum was collected. To obtain the “pure” spectrum of [SCI at x min], a series of subtractions [SCI crystal x min] minus [SCI soaking buffer t min] (t was chosen to be close to x) were performed, using the buffer peak at 849 cm−1 for standardization. In order to compare the subtle changes in the RNAP-DNA complex during the process of SCI formation, a series of secondary subtractions [SCI at x min] minus [BC] were carried out, using the enzyme’s Phe feature at 1004 cm−1 as an internal intensity standard. The experimental line widths from the spectrum of a neon discharge lamp are 6 cm−1, whereas most of the line widths seen in seen in the Raman difference spectra are 25-30 cm−1. This demonstrates that line shapes and spectral resolution are not governed by the performance of the microscope/spectrometer combination. The inherent stability of the crystal Raman data over time is shown by the control spectra in Supplementary Figure S5. The difference spectra in Figure S6, Supplementary Material, indicate that the buffer subtraction protocols do not perturb the intensities of the Raman bands from the solute.
Collecting and processing Raman spectra from binary complex (BC) to substrate complex II (SCII)
The BC Raman spectra were generated as described above. To form SCII, 1.5 μl concentrated solution (20 mM *GTP, 20 mM AMPCPP, 40 mM MnCl2, 0.1 M Tris-HCl pH 8.0, 0.11 M dibasic ammonium citrate, 0.09 M ammonium dihydrogen monophosphate, 15% PEG 3350) was injected into a hanging drop of 4.5 μl equilibrium buffer (described above) containing a BC crystal. The method to obtain a series of Raman difference spectra of [SCII at x min] minus [BC] was as described above.
Collecting and processing Raman spectra from binary complex (BC) to product complex (PC)
The nucleotidyl transfer reaction was carried out in crystallo to form the PC by transferring the BC crystal from the equilibrium buffer to reaction buffer (5 mM *GTP, 5 mM *ATP, 10 mM MnCl2, 0.1 M Tris-HCl pH 8.0, 0.11 M dibasic ammonium citrate, 0.09 M ammonium dihydrogen monophosphate, 15% PEG 3350). Mn is used in these experiments, rather than Mg, because it was found that this led to full active site occupancy for the soaks at shorter times. The method to obtain a series of Raman difference spectra of [PC at x min] minus [BC] was as described above.
Kinetics by Raman crystallography
Time courses tracing of the appearance of substrates and metals in the crystal and conformational changes in the enzyme were obtained during BC→SCI, by measuring the heights of the signature Raman features in the Raman difference spectrum [SCI at x min] minus [BC]. The substrates *ATP and *GTP were traced using base ring modes around 701 cm 1 (from *A) and 1521 cm−1 (from *G and *A)8, as well as the triphosphate feature around 1125 cm−1, as shown in Figs. 3A & C. An α-helix change was traced by the negative intensity around 945 cm−1 in the Raman difference spectrum [SCI at x min] minus [BC] (Figs. 3A & D). The 945 cm−1 feature is assigned to the O-helix, the only α-helix in the structure that moves relative to BC1. Metal site formation was traced by the appearance of the negative intensity of COO−feature (side chain of D559 and D951 associating with metals, as observed by X-ray crystallography) around 1400 cm−1 (binding to metal shifts the “free” COO−feature away from the 1400 cm−1 region). Each peak height was measured by the integration function of GRAMS/AI (Galactic) software, and was divided by the peak height of Phe feature at 1004 cm−1 in the mother spectrum of [SCI at X min] for standardization. This peak is due to a Phe ring mode that has constant intensity under the conditions of our experiments because all RNAP’s Phe side chains contribute to the intensity and these are unchanged. Using peak areas instead of peak heights to measure concentration changes gave very similar results. The kinetic data are prone to error due to the intrinsic spectral noise and the difficulty in selecting the baseline. However, great care was taken to be consistent in the selection of the baseline and the trends in the kinetic data are a reproducible monitor of changes in intermediate populations in the multiple experiments we have repeated over the past two years. These relative intensities representing the population of substrate, conformational changes in the enzyme and metal site formation in the transcript initiation complex were plotted versus time, as shown in Fig. 3C & D. The same method was applied to obtain the time courses from BC to SCII, and BC to PC, except for the former we used the relative intensity of the unlabeled A mode around 717 cm−1 (from AMPCPP) instead of labeled *A feature at 701 cm−1 to trace the population of A in SCII. Relative intensities of triphosphate at 1125 cm−1 vs. *A breathing mode at 701 cm−1 were plotted as a function of time for SCI and PC soaking, using difference spectra of [SCI at x min] minus [BC] and [PC at x min] minus [BC], respectively, to compare the change of triphosphate number per active site.
Stepwise soaking experiment from BC to substrate complex without metal (SC0), to SCI and finally to PC, in the same crystal
A BC crystal was transferred from equilibrium buffer to substrate soaking solution (5 mM GTP, 5 mM ATP, 0.1 M Tris-HCl pH 8.0, 0.11 M dibasic ammonium citrate, 0.09 M ammonium dihydrogen monophosphate, 15% PEG 3350) for 1 hour, to form SC0. Then a final concentration of 10 mM MgCl2 was added to the soaking solution for 1 hour, to form SCI. Lastly, a final concentration of 5 mM MnCl2 was added to the surrounding buffer of the crystal for another 1 hr, to form PC. Raman spectra of BC (collected once), SC0 at x min, SCI at y min, and PC at z min was collected every 5 min. Buffer spectra before and after each step of soaking were collected every 30 min.
RESULTS AND DISCUSSION
Crystals used for this study contain two RNAP-DNA complexes in the asymmetric unit (Gleghorn et al., 20082). Ligands from both active sites contribute to the Raman peaks in all of the Raman difference spectra. The laser beam focused inside the crystal is non-polarized and we have never observed changes in Raman peak intensities with changes in crystal orientation.
Thus, it is likely that both active sites in the asymmetric unit contribute equally to the Raman intensities. This view is supported by the results of our calculations of active site concentrations based on absolute Raman intensities (below and Supplementary material). In one instance the Raman and X-ray results differ. The Raman intensities in the PC difference spectra are consistent with an approximate concentration of product in the crystal of 5 mM, suggesting that both active sites in the asymmetric unit are occupied with 2-mer RNA and pyrophosphate up to about 3 hours. However, the X-ray data taken from crystals after overnight soaks show that only one of the active sites in the asymmetric unit was occupied with a 2-mer RNA and pyrophosphate and the other active site contained weak and discontinued map for the 2-mer RNA and clear map for the pyrophosphate, suggesting that the 2-mer RNA was partially dissociated from this active site for a longer period of time. This difference may also come from the different conditions of the PC formation; the X-ray and Raman studies used Mg2+ and Mn2+ for the reaction, respectively.
SCI Raman difference spectra
*NTP modes. In the Raman difference spectrum during SCI formation (Fig. 3A, bottom), the *NTP ring modes and triphosphate contribution are unambiguously identified by comparison to the Raman spectra of free *GTP and *ATP (Fig. 3A, top). The most intense triphosphate Raman mode in the free *GTP and *ATP spectra was observed near 1116 cm−1 in the presence of Na+ counter ion, which that moved to near 1125 cm−1 in the SCI spectra because Mg2+ is present as the counter ion.11
DNA modes
The bands at 1345 (positive) and 785 (negative) cm−1 are assigned to known ring modes of A or C bases of the template DNA12. The intensities of these signals have changed upon a DNA conformational change due to NTP and Mg2+ binding (Fig. 3B). Comparison between the BC and SCI X-ray structures (Fig. 3B) suggests that the DNA bases at −1(A) and +1(C) (Figure 1) are prime candidates for the observed ring modes. The negative feature at 1085 cm−1 is tentatively assigned to PO2 symmetric stretch from non-bridging groups on the DNA backbone. This has been up-shifted by metal binding at the oxygens4,9, the corresponding positive limb is unresolved in the wing of the 1125 cm−1 triphosphate band. In addition, the features seen near 1017 and 886 cm−1 are tentatively assigned to bands derived from changes in the DNA backbone.9
Protein modes
A key finding from the X-ray crystallographic results is that the protein main chain conformational changes, upon forming the initiation complexes from the binary complex, are limited to the region of the O-helix (Supplementary Material, Fig. S7 )1 Thus, the O-helix (Figure 1) is the only helix in the enzyme that changes conformation upon forming the initiation complexes. In Figure 3A, we assign the feature near 945 cm−1 to a polarized α-helix amide band that has changed in intensity due to reorientation of the O-helix. The assignment to an α-helix mode is based on the early work of several groups13,14. Importantly Pézolet et al14, established that the band near 945 cm−1 is an α-helix amide mode that shows a strong dichroism and Tsuboi and co-workers demonstrated the such a mode will vary in intensity depending on the orientation of the alpha helix15. Thus, we use the appearance of the 945 cm−1 mode in the Raman difference spectra as a marker band for O-helix reorientation. The features near 855 and 837 cm−1 are assigned to the well-characterized “tyrosine doublet” 6 whose profile depends on the H-bonding pattern at the -OH group. The major changes in the environments of Y612 and Y678 upon forming SCI (Fig. 3B) indicate that they are the main contributors to the observed peaks. The other tyrosines in the enzyme do not undergo major environmental changes. An important protein mode for monitoring the SCI formation is the negative feature seen near 1400 cm−1, which is assigned to the disappearing of non-metal bound -COO− symmetric stretch mode(s) of Asp and/or Glu side chains12. Upon binding to metal this mode moves up or down by up to 75 cm−1 depending on the geometry of metal binding10. Thus, based on the SCI X-ray structure (Fig. 3B, Gleghorn et al., 20111), we assign the negative 1400 cm−1 band to D951 and D559 where their -COO−stretches disappear in the negative sense when they bind to Mg2+ or Mn2+ for metal B coordination (Fig. 3B). This assignment is supported further by the experiments outlined in section below describing the stepwise substrate and metal soaking experiments.
SCI kinetic data
To reveal the temporal order of the RNAP/DNA conformational changes as well as the substrate and metal bindings during the transition from BC to SCI, kinetic data are obtained as described in Materials and Methods. Figure 3D shows that the change in the 945 cm1 intensity, denoting the O-helix motion, is completed within the dead-time of our measurements, about 2-3 minutes, and remains constant over 3 hours. However, the negative intensity of the 1400 cm−1 band, denoting Mg2+ binding at the active site, reached the maximum at about 25 -30 minutes and was constant after that. NTP signals including the ring (701 and 1521 cm−1) and the triphosphate modes (1125 cm−1) increase right after the soaking and the signals decayed to the stoichiometric value (20~50% compared with the initial intensity) for the active site at about 25 minutes (Fig. 3C). These values are based on the absolute values of the Raman intensities calibrated against a standard curve of [NTP] in solution vs. intensity (see Supplementary Material SFig. 4). We have used this method for other systems16 and it gives population concentrations to within ± 10% accuracy. The reason for the early excess population burst is not fully understood and is discussed below under “Unexpected results in pre-equilibrium soak conditions”.
SCII Raman difference spectra and kinetic data
Figure 4A compares the Raman spectrum of 50 mM free *GTP and AMPCPP with that of SCII recorded after a 53 min. soak of *GTP, AMPCPP and Mn2+ to the BC crystal. The spectrum of SCII resembles closely that of SCI (Fig. 3A) except that the ring modes of unlabelled adenine of AMPCPP replaced those of the labeled isotopomer *ATP. The kinetic data (Figs. 4C and D) also follow those for SCI closely (Figs. 3C and D). The signal of Raman difference spectrum denoting the O-helix motion reached a maximum within a few minutes after soaking. Completion of negative intensity of the 1400 cm−1 band, which is assigned as Mn2+ bindings at the A and B sites, took about 30 minutes and an initial burst of NTP populations decayed to values equal to the active site concentration in the crystal at about 25 mins. The standardized relative Raman intensity of the 1400 cm−1 −COO− bands for SCI and SCII, after reaching constant values, are similar, 0.036±0.006 (Figs. 3D and 4D), reflecting the fact that both D951 and D559 are metal bound in the two complexes, albeit in a different manner (compare Figs. 3B and 4B). Thus, two intensity equivalents are removed from near 1400 cm−1 for both complexes.
One feature of special note in Figure 4A is the band near 641 cm−1 that has a corresponding peak near 652 cm−1 for SCI (Figure 3A): this corresponds to a *G ring mode that is sensitive to the conformation of the ribose-triphosphate moiety bound to *G due to changes in vibrational coupling. This assignment is based on the work of Ghomi and co-workers17, 18 who showed that a G ring mode is near−1 665 cm−1 in the case of 3′-endo/anti ribose conformation (corresponding to our *G mode at 655 cm in the SCI, see Supplementary Fig. 1) and it moves to 636 cm−1 for 3′endo/syn (corresponding to our *G mode at 641 cm−1 in the SCII). Based on this we postulate that the shift from 655 (SCI) to 641 cm−1 (SCII) is brought about by the reorientation of *G’s triphosphate group observed in the X-ray structure (Gleghorn et al.1,) (Fig. 4B). We use this signal assignment to analyze the temporal changes of *G’s ribose triphosphate moiety during PC formation in the next section.
PC Raman difference spectra and kinetic data
Figure 5A compares the Raman difference spectra of [PC at 2-7 mins] minus [BC] with that at 35-40 minutes after soaking with 5mM *GTP and *ATP and 10 mM Mn2+. The structural changes around the RNAP active site for PC formation after an overnight soak compared to SCII are shown in Figure 5B. The spectroscopic assignments are given on Figure 5. Compared to SCII, there are three major differences in the data that are borne out in the kinetic data in Figure 6. The negative intensity near 1400 cm−1, characteristic of metal binding at the active site, reached a maximum immediately, and appeared to disperse at about 50 minutes. The triphosphate intensity near 1125 cm−1 decreased rapidly to about 50% of its initial value in the 15-20 minute time frame (Fig. 6B). The loss of one triphosphate group strongly suggests that the nucleotidyl transfer reaction is complete within half an hour, which is supported by the loss of negative intensity near 1080 cm−1. The latter feature has been ascribed to metal binding to non-bonded PO2− groups in the DNA backbone, an effect that occurs very quickly4 and becomes time invariant. The 1080 cm−1 negative peak loses intensity because pyrophosphate has a major broad band near 1085 cm−1, at the pH of our experiment (pH 7.6, Supplementary Figure 2). As the phosphodiester bond is formed, this pyrophosphate feature “fills in” the dip due to the DNA PO2− groups in inner sphere contact with Mn2+ ions. Consequently, at the end of the reaction -~ 12 minutes -the baseline around 1080 cm−1 becomes flat (Fig. 6D). Another major difference compared to SCI and SCII is that there is no sign of a substrate population burst, *GTP and *ATP are detected immediately at active site concentrations and the base concentrations remain unchanged (Fig. 6 A). In common with SCI and SCII, the Raman signal denoting the O-helix motion (945 cm−1) has reached maximum quickly and thereafter does not change with time.
Fig. 6.

Kinetics of PC soaking in the N4 mini-vRNAP crystals. A) Base population change from BC to PC. The relative intensities of *A breathing mode at 701 cm−1 (blue triangles), and *G*A ring mode at 1520 cm−1 (red circles) in spectrum PC at x min – BC are plotted as a function of time. B) Relative population of triphosphates per bound *A during PC and SCI formation. Relative intensities of triphosphate feature at 1125 cm−1 to *A feature at 701 cm−1 in PC at x min – BC (purple squares) and SCI at x min – BC (green circles) are plotted as a function of time. C) Changes of the enzyme during PC soaking. Relative intensities at 945 cm−1 (blue crosses, corresponding to O-helix rotation) and 1400 cm−1 (megenta circles, corresponding to metal-carboxylate coordination) in PC at x min – BC are plotted as a function of time.. D) The decrease of the negative peak at 1076 cm−1 indicates the increase of product pyrophosphate. The relative intensity of 1076 cm−1 negative peak in spectrum PC at x min – BC is measured as a function of time. In A), C), and D) the Phe feature at 1004 cm−1 in spectrum PC at x min is used as internal standard and the intensity values on the y axes are the ratio of the peak intensities in the difference spectrum to the Phe band.
The *G base mode near 652 cm−1, discussed in the previous section (e.g. in Fig. 3), occurs at 642 cm−1 in the 2-7 minute trace showing that the *GTP triphosphate group is in the conformation shown for SCII in Figure 4B, which coordinates the metal A. However, at 35-40 minutes the Raman band has moved to 658 cm−1 (Fig. 5 C) suggesting that the tail has relaxed to a conformation similar to that seen in SCI and free *GTP. The data for the GTP triphosphate group (+1) at 35-40 mins. are consonant with the finding that metal A dissociated at 40 minutes (Fig 6C).
Adding NTPs and metals sequentially
In order to confirm our assignments of the Raman markers and that SCI can be converted to PC, we undertook a “stepwise soaking” experiment, 1) soaking GTP and ATP to BC crystal first, 2) soaking Mg2+ next to form the SCI and then 3) soaking Mn2+ to create conditions for SCII and PC formations. Unlabeled GTP and ATP were used in the experiment to create a broad window around 1400 cm−1, unobstructed by modes from *GTP. Adding the NTPs alone led to the appearance of the negative feature near 950 cm−1 (Fig. 7A) suggesting that the movement of the O-helix can be triggered by adding NTPs in the absence of divalent metal. When 10 mM Mg2+ is soaked in, we see the appearance of the negative band near 1400 cm−1 at 23 mins (Fig. 7B). This feature is absent when only NTPs are present strongly supporting our assignment of the 1400 cm−1 feature to the COO− side chains of D559 and D951, the band shifts away when the side chains bind to divalent cation (Mg2+ or Mn2+). The shifted band has not been detected because its actual position depends on the geometry of the metallo COO− site10, and thus we do not know precisely its position or profile.
Fig. 7.

Changes from BC to substrate complex without metals (SC0), SCI, and finally to PC. A multi-step soaking was performed inside a single crystal of BC to firstly form a no-metal substrate complex by soaking unlabled GTP and ATP only, for about an hour, then 10 mM Mg2+ was added to form SCI, for an hour, and finally 5 mM Mn2+ was added to form PC. (A) Raman difference spectrum of SC at 14 min – BC, B) SCI at 23 min (soaked from SC) – BC, assignments are shown on this spectrum with NTPs in green, perturbations of DNA in blue and changes of the enzyme in magenta; C) PC at 10 min (soaked from SCI) – BC.
When 5 mM Mn2+ was added to load the catalytic metal at the active site, the Raman signals characteristic for PC formation appeared rapidly. After 10 minutes of Mn2+ soaking (Fig 7C), the intensity of the triphosphate band near 1120 cm−1 drops by about 50% indicating that the nucleotidyl transfer reaction is essentially complete. There appears to be some metal remaining at 10 minutes (see the 1400 cm−1 region) and possibly some pyrophosphate is absent under these conditions since the region around 1075 cm−1 has not completely “filled in”. However, as expected from the X-ray structure (Gleghorn et al., 20111), the O-helix remains in the position seen in Figure 3, as evidenced by the negative 950 cm−1 band.
Unexpected results in pre-equilibrium soak conditions
In many of our experiments we obtained unexpected results early in the soaking process. We showed above that there are bursts of populations of ATP and GTP under the conditions used to form SCI and SCII. Initially, these are 2-5 times higher than the concentrations of active sites in the crystal and they decay to levels equivalent to active site concentrations after about 20 minutes (Figs. 3C and 4C). Upon sequential addition of NTPs and then metals, we see equally remarkable results in the early soaks. For example when we perform the subtractions [(BC + GTP + ATP one hour) + Mg2+ soak 1-6 minutes] minus [BC +ATP +GTP one hour] we see intense negative peaks for ATP and GTP (Supplementary Figure 3). Thus, addition of metal reduced the NTP populations in the crystal, an effect that disappeared after about 15 min. Similarly when we add Mn2+ to a crystal equilibrated with GTP, ATP and Mg2+ we see a temporary reduction in the GTP and ATP levels in the crystals that recovers after 10 mins. It is unlikely that the population changes we see are due to artifacts, since we are following the intense, sharp ring mode features from the NTPs. Although the causes of these population fluctuations are not understood it is apparent that, prior to equilibrium being established, populations of ligands and metals in the crystals are very sensitive to the conditions used for the soak experiments.
Comparison of soak kinetics for SCI, SCII and PC predicts the presence of unstable intermediates
Figure 8 compares in schematic form the kinetic data for soaks leading to SCI, SCII and PC. The period 0-2 minutes is presently a “dead zone” for Raman crystallography data collection where we see a rapidly fluctuating response at the CCD, presumably this is a pre-equilibrium regime. TP/*A, the triphosphate intensity standardized by dividing the intensity of an *A mode, follows the change in triphosphate population per ATP equivalent, O-helix change is derived from the α-helix band near 945 cm−1, changes in metal - COO− binding are gathered from the 1400 cm−1 carboxylate mode, and *G and *A (and AMPCPP) populations are easily probed via the standardized intensities of the corresponding intense ring modes. All X-ray structures published in Gleghorn et al.1 are collected from flash frozen crystals after overnight soaks and correspond to the far right hand side of Figure 8. Although the experimental soak conditions of the X-ray and Raman studies are slightly different, the conclusions are in good agreement with each other. The TP/*A population for PC drops to about 50% of that seen in SCI and SCII showing that the nucleotidyl transfer reaction has likely occurred around the 15-20 minute time frame (Fig. 8B). For SCI, SCII and PC, the Raman intensity values for the O-helix band, formed immediately after the dead time are the same (0.03 ± 0.005). Similarly, the relative heights of the *GTP and *ATP ring modes are the same for PC, SCI and SCII after 20 minutes, where we measure just *GTP for SCII, indicating the stoichiometries are the same in the three complexes at equilibrium. The level of -COO− and metal complex population for PC at the beginning is very similar to that after 25 mins for SCI and SCII. For the initial data point for PC, we see a TP/*A ratio that is about 75% that found in SCI and SCII. Thus, we conclude that significant product formation has occurred in the time needed for the collection of the first Raman data set.
Fig. 8.

Schematic of kinetic data during SCI, SCII and PC formations from the BC crystal revealed by time dependent Raman microscopy. A) The kinetic data are similar in SCI and SCII formation. Substrates quickly reach 2-5 fold of active site concentration in the complex, and decrease to active site concentration at about 25 min; O-helix turning along with Tyr-substrate H-bond formation completes within minutes after soaking, and remains constant thereafter; M2+-COO− coordination forms more slowly, and completes at about 30-40 min of soaking. The SCI and SCII are fully formed at about 30-40 min after soaking. B) The transcription reaction is monitored from BC to PC in single crystals. The whole machinery is fully initiated for the reaction within minutes after soaking, which is very similar to fully formed SCI and SCII. Substrate bases reach active site concentration quickly and remain constant afterwards, while the triphosphate number per active site (purple line) decreases to about half of the initial value in about 20 min; O-helix turning completes immediately in minutes and remain constant; M2+-COO− coordination forms completely within minutes and gradually disappears in about 50 min. The transcript initiation is complete at about 50 min after the soaking the BC crystal.
Overall, there is a parallel between the sequence of events described here with those found recently by Bernak et al. 19 who used fluorescence-based assays and stopped flow kinetics to determine the sequence of events leading to a reaction-competent conformation in the active site of Escherichia coli DNA polymerase I (Klenow fragment). The order of events described by their rapid solution kinetics is similar to that determined here for RNAP in a single crystal. This suggests that the temporal order of the nucleotidyl transfer reaction within the RNAP crystal is close to that in solution, albeit on a longer time scale.
Clearly, there are events occurring early on the PC pathway that have not been characterized by X-ray crystallography thus far. At around 5 minutes stoichiometric levels of *GTPs and *ATPs are bound and significant reduction in triphosphate populations have occurred. Unlike in SCI and SCII, the binding of metals to COO−s occurs very early on the PC pathway -an obvious requirement for catalysis to occur. A common element is that the O-helix has undergone its rotation very early and remains invariant thereafter. For PC in Figure 8, after approximately 15 minutes the substrate triphosphate has dropped to 50% of its original level wheras the metals sites appear to have dispersed in about 50 minutes.
A prediction from Figure 8 is that until about 20 minutes on the PC pathway, as yet uncharacterized, novel and unstable species exist. This promises to be a productive region for future combined X-ray and Raman analyses.
Supplementary Material
ACKNOWLEDGEMENTS
This work was supported by NIH grants AI12575 and GM071897 to K.S.M. GM54072 and GM81420 to P.R.C. We thank L.B. Rothman-Denes for critical reading of the manuscript. Figures were prepared using PyMOL (http://pymol.sourceforge.net/).
Footnotes
Supporting Information Available. This includes the Raman spectra of unlabeled and 13C, 15N labeled ATP and GTP, the Raman spectra of pyrophosphate at different pHs, a Raman Figure showing the conversion of SCI to PC, details of quantifying *G, *A and active site concentrations in the crystal, and control experiments illustrating the stability of the crystal Raman spectra and the efficacy of buffer subtractions. This information is available free of charge via the internet at http://pubs.acs.org/
REFERENCES
- (1).Gleghorn ML, Davydova EK, Basu R, Rothman-Denes LB, Murakami KS. PNAS. 2011;108:3566. doi: 10.1073/pnas.1016691108. [DOI] [PMC free article] [PubMed] [Google Scholar]
- (2).Gleghorn ML, Davydova EK, Rothman-Denes LB, Murakami KS. Mol. Cell. 2008;32:707. doi: 10.1016/j.molcel.2008.11.010. [DOI] [PMC free article] [PubMed] [Google Scholar]
- (3).Carey PR. Annu. Rev. Phys. Chem. 2006;57:527. doi: 10.1146/annurev.physchem.57.032905.104521. [DOI] [PubMed] [Google Scholar]
- (4).Gong B, Chen JH, Yajima R, Chen Y, Chase E, Chadalavada DM, Golden BL, Carey PR, Bevilacqua PC. Methods. 2009;49:101. doi: 10.1016/j.ymeth.2009.04.016. [DOI] [PMC free article] [PubMed] [Google Scholar]
- (5).Carey PR, Chen Y, Gong B, Kalp M. Biochim. Biophys. Acta. 2010;1814:742. doi: 10.1016/j.bbapap.2010.08.006. [DOI] [PMC free article] [PubMed] [Google Scholar]
- (6).Harada I, Takeuchi H. In: Spectroscopy of Biological Systems. Clark RJH, Hester RE, editors. John Wiley & Sons Ltd; New York City: 1986. p. 113. [Google Scholar]
- (7).Raso SW, Clark PL, Haase-Pettingell C, King J, Thomas GJ., Jr. J Mol Biol. 2001;307:899. doi: 10.1006/jmbi.2001.4476. [DOI] [PubMed] [Google Scholar]
- (8).Chen Y, Eldho NV, Dayie TK, Carey PR. Biochemistry. 2010;49:3427. doi: 10.1021/bi902117w. [DOI] [PMC free article] [PubMed] [Google Scholar]
- (9).Duguid J, Bloomfield VA, Benevides J, Thomas GJ., Jr. Biophys. J. 1993;65:1916. doi: 10.1016/S0006-3495(93)81263-3. [DOI] [PMC free article] [PubMed] [Google Scholar]
- (10).Nakamoto K. III-8. John Wiley & Sons, Inc; New York: 1997. [Google Scholar]
- (11).Takeuchi H, Murata H, Harada I. J. Am. Chem. Soc. 1988;110:392. [Google Scholar]
- (12).Carey PR. Biochemical Applications of Raman and Resonance Raman Spectroscopies. Academic Press; New York: 1982. [Google Scholar]
- (13).Frushour BG, Koenig JL. Biopolymers. 1974;13:1809. doi: 10.1002/bip.1974.360130913. [DOI] [PubMed] [Google Scholar]
- (14).Pézolet M, Pigeon M, Ménard D, Caillé JP. Biophys. J. 1988;53:319. doi: 10.1016/S0006-3495(88)83109-6. [DOI] [PMC free article] [PubMed] [Google Scholar]
- (15).Tsuboi M, Suzuki M, Overman SA, Thomas GJ., Jr. Biochemistry. 2000;39:2677. doi: 10.1021/bi9918846. [DOI] [PubMed] [Google Scholar]
- (16).Zheng X, Rivera-Hainaj RE, Zheng Y, Pusztai-Carey M, Hall PR, Yee VC, Carey PR. Biochemistry. 2002;41:10741. doi: 10.1021/bi020422g. [DOI] [PubMed] [Google Scholar]
- (17).Leulliot N, Baumruk V, Abdelkafi M, Turpin PY, Namane A, Gouyette C, Huynh-Dinh T, Ghomi M. Nucleic Acids Res. 1999;27:1398. doi: 10.1093/nar/27.5.1398. [DOI] [PMC free article] [PubMed] [Google Scholar]
- (18).Baumruk V, Gouyette C, Huynh-Dinh T, Sun JS, Ghomi M. Nucleic Acids Res. 2001;29:4089. doi: 10.1093/nar/29.19.4089. [DOI] [PMC free article] [PubMed] [Google Scholar]
- (19).Bermek O, Grindley ND, Joyce CM. J. Biol. Chem. 2010;286:3755. doi: 10.1074/jbc.M110.167593. [DOI] [PMC free article] [PubMed] [Google Scholar]
Associated Data
This section collects any data citations, data availability statements, or supplementary materials included in this article.