

Abstract
Alzheimer’s disease (AD) is a neurodegenerative disorder, characterized by amyloid plaque accumulation, intracellular tangles and neuronal loss in selective brain regions. The frontal cortex, important for executive functioning, is one of the regions that are affected. Here, we investigated the neurodegenerative effects of mutant human amyloid precursor protein (APP) and presenilin 1 (PS1) on frontal cortex neurons in APP/PS1KI mice, a transgenic mouse model of AD, expressing two mutations in the human APP, as well as two human PS1 mutations knocked-in into the mouse PS1 gene in a homozygous (ho) manner. Although the hippocampus is significantly affected in these mice, very little is known about the effects of these mutations on selective neuronal populations and plaque load in the frontal cortex. In this study, cytoarchitectural changes were characterized using high precision design-based stereology to evaluate plaque load, total neuron numbers, as well as total numbers of parvalbumin- (PV) and calretinin- (CR) immunoreactive (ir) neurons in the frontal cortex of 2- and 10-month-old APP/PS1KI mice. The frontal cortex was divided into two subfields: layers II–IV and layers V–VI, the latter of which showed substantially more extracellular amyloid-beta aggregates. We found a 34% neuron loss in layers V–VI in the frontal cortex of 10-month-old APP/PS1KI mice compared to 2-month-old, while there was no change in PV- and CR-ir neurons in these mice. In addition, the plaque load in layers V–VI of 10-month-old APP/PS1KI mice was only 11% and did not fully account for the extent of neuronal loss. Interestingly, an increase was found in the total number of PV-ir neurons in all frontal cortical layers of single transgenic APP mice and in layers II–IV of single transgenic PS1ho mice between 2 and 10 months of age. In conclusion, the APP/PS1KI mice provide novel insights into the regional selective vulnerability in the frontal cortex during AD that, together with previous findings in the hippocampus, are remarkably similar to the human situation.
Keywords: Alzheimer’s disease, Neuropathology, Stereology, Frontal cortex, Mouse model
Introduction
Alzheimer’s disease (AD) is a severe, progressive brain disorder that affects a significant portion of the aged population. The neuropathological hallmarks consist of intra- and extracellular amyloid-beta aggregates, intracellular neurofibrillary tangles, and dysfunction of neurons and synapses, resulting in brain atrophy and ultimately neuron loss that is restricted to specific brain regions (Cummings and Cole 2002; Selkoe 2001; Dickson 2001; Probst et al. 1991). Although AD’s neuropathology is well defined, its etiology remains to be elucidated.
According to the amyloid cascade hypothesis, altered amyloid processing and accumulation of aggregated amyloid-beta is a main causative factor in AD (Hardy and Selkoe 2002; Tanzi and Bertram 2005). Based on the identification of specific mutations in the amyloid precursor protein (APP) and the presenilin (PS1 and PS2) genes that are associated with increased amyloid production, various mouse models have been developed that mimic several aspects of AD. Although these models allow to study spatiotemporal development of the neuropathology of AD (Gotz and Gotz 2009), only some actually show hippocampal cell loss (Casas et al. 2004; Schmitz et al. 2004), a characteristic feature of the human AD brain (Duyckaerts et al. 2009). The APP/PS1KI mouse model investigated by Casas et al. (2004) did not only show significant neuron loss (Bayer and Wirths 2008), but also displayed a significant decrease in the numbers of parvalbumin- (PV) and calretinin- (CR) immunoreactive (ir) neurons in the hippocampus (Takahashi et al. 2010).
In addition to the hippocampus, higher association areas (Francis 2006; Miller and Cohen 2001), like the frontal cortex (Braak et al. 1996; Price and Sisodia 1998), are affected in AD, accounting for executive dysfunction and many of the other higher-order cognitive deficits observed in AD patients (Miller and Cohen 2001). The large pyramidal neurons, especially those in layers III and V of the temporal and frontal cortex, are among the first to degenerate in AD (Morrison and Hof 2002; Brun and Englund 1981; Hof et al. 1990). Specifically, layer V pyramidal neurons are important for long-range corticocortical, corticospinal, and corticostriatal connections (Anderson et al. 2010; Bussiere et al. 2003). Several studies reported abnormalities in the frontal cortex in AD, particularly in these large pyramidal neurons, which are particularly vulnerable (Mann et al. 1988; Mesulam and Geula 1988; Gomez-Isla et al. 1997; Morrison and Hof 2007).
Of particular interest are neurons expressing calcium-binding proteins (CaBP); i.e. PV-ir and CR-ir neurons (Kubota and Kawaguchi 1994) that are thought to execute highly specific inhibitory tasks during cognitive functions (Cauli et al. 1997; Conde et al. 1994; Kawaguchi and Kubota 1997). Despite their valuable role in cognition, the selective vulnerability of these PV-ir and CR-ir neurons in AD remains unresolved (Satoh et al. 1991; Sampson et al. 1997).
The aim of this study was therefore to assess the neurodegenerative effects of mutant APP and PS1 in the frontal cortex of the APP/PS1KI mice on total neuron numbers, numbers of PV-ir and CR-ir neurons, and plaque load as a function of age. Based on previous studies, we hypothesize that APP/PS1KI mice exhibit an age-related increase in plaque load, paralleled by a decrease in overall neuron numbers as well as in PV-ir and CR-ir neuron numbers. We used high precision design-based stereology to analyze layers II–IV and layers V–VI of the frontal cortex of these mice, as well as of APP, PS1 heterozygote (PS1he), and PS1 homozygote (PS1ho) mice as controls. Layers II–IV and layers V–VI, respectively, of the frontal cortex were chosen since most pathology was expected in layers V–VI due to the selective vulnerability of large pyramidal neurons. For each genotype, 2-month-old mice were compared with 10-month-old mice, to address genotype-specific age-related effects.
Materials and methods
Animals
The following groups of 2-month-old (M2) and 10-month-old (M10) mice were obtained from Sanofi-Aventis Centre de Recherche de Paris (Vitry sur Seine, France): APP mice [transgenic mice expressing human mutant APP751 carrying the Swedish (K670N/M671L) and London (V717I) mutations; mouse Thy-1 promoter] (n = 9; 6 male, 3 female), PS1he mice [expressing human PS1 mutations (M233T and L235P) knocked-in into the mouse PS1 gene in a hemizygous manner] (n = 13; 4 male, 9 female), PS1ho mice [expressing human PS1 mutations (M233T and L235P) knocked-in into the mouse PS1 gene in a homozygous manner] (n = 9; 7 male, 2 female), and APP/PS1KI mice (expressing both the aforementioned APP and PS1ho mutations) (n = 8; 5 male, 3 female). A detailed description of these mice was provided in the literature (Casas et al. 2004). Due to the complicated genetic background of the mice used in this study, we decided not to include wild-type mice in this study. Furthermore, wild-type mice do not show significant any age-related changes in the frontal cortex (Duyckaerts et al. 2008; Phinney et al. 2003). Since the APP mice have the same genetic background and do not show any age-related differences, these animals can serve as an internal control. All experiments were approved by the Aventis Animal Care and Use Committee, in accordance with standards for the care and use of laboratory animals formulated by the French and European Community (Centre National de la Recherche Scientifique, Institute of Laboratory Animal Resources).
Tissue processing
The mice were anesthetized with chloral hydrate and transcardially perfused with tyrode buffer, followed by a fixative consisting of 4% paraformaldehyde, 15% picric acid, and 0.05% glutaraldehyde in phosphate buffer (Schmitz et al. 2004). Brains were dissected from the skulls, and halved along the mediosagittal line. The left brain halves were post-fixed for 2 h at 4°C in the fixative, omitting the glutaraldehyde. Subsequently, they were cryoprotected with 30% sucrose, and thereafter quickly frozen. The frozen brains were cut into series of 30-μm thick coronal cryostat sections (Leica, CM3050, Wetzlar, Germany). Every tenth section was systematically assigned to a series of sections, yielding a total of 10 series. While cutting, each brain was divided in three regions: frontal cortex, hippocampus, and cerebellum. For this study, only sections from the frontal cortex were analyzed. After cutting, the material was stored at −80°C until further processing. The right brain halves were not included in this study.
Immunohistochemistry
To analyze volumes of brain regions, plaque load, total neuron numbers, and PV-ir and CR-ir neuron numbers in the frontal cortex, standard fluorescence immunohistochemical detection procedures were used. One series was used for the detection of NeuN, a neuronal marker (1:50; monoclonal mouse anti-neuronal nuclei; Millipore, Billerica, MA, USA), another was used for immunofluorescent detection of both Parvalbumin (1:10,000; monoclonal mouse; Swant, Bellinzona, Switzerland) and Calretinin (1:2,000; polyclonal rabbit anti-mouse; Swant). A third series was used to detect amyloid-beta (1:1,200; monoclonal mouse anti-amyloid-beta [17–24]; Sigma, St. Louis, MO, USA); and thioflavin S was added to stain the aggregated core of the plaques (0.015% in TBS; 10 min; Sigma). In all protocols, Hoechst 33342 was used as DNA counterstain (1:500 in TBS; 30 min; Sigma). Free-floating sections were washed in tris-buffered saline (TBS) with (TBS-T) and without (TBS) triton X-100 (Merck, Darmstadt, Germany). Primary antibodies were incubated overnight at 4°C in TBS-T at a specific concentration. On the next day, the sections were washed and incubated with secondary antibodies for 2 h at room temperature in TBS-T. For NeuN and Parvalbumin, donkey anti-mouse IgG Alexa Fluor 488 (1:200; Molecular Probes, Eugene, OR, USA) was used; for Calretinin, donkey anti-rabbit IgG Alexa Fluor 594 (1:200; Molecular Probes); and for amyloid-beta, donkey anti-mouse IgG Alexa Fluor 594 (1:200; Molecular Probes). After rinsing with TBS, the sections were mounted on gelatinized glass slides, air-dried, and coverslipped with 80% glycerol in TBS. The immunoprocessed sections were microscopically checked for complete penetration of the antibodies, resulting in immunoreactivity evenly distributed throughout the entire section thickness.
Stereologic analyses
The sections were investigated with high precision design-based stereology (see, e.g., Schmitz and Hof 2005). This approach is considered the gold standard for microscopic quantification of 3D structures and allows accurate, reliable, and efficient estimates of volumes of brain regions, plaque load, and numbers of neurons within specific brain regions.
Volumes of brain regions, and numbers of NeuN immunoreactive neurons
Volume measurements of the frontal cortex were performed on sections immunoprocessed for the detection of NeuN. To this end, all sections between stereotaxic bregma coordinates 1.10 mm and −0.22 mm (Franklin and Paxinos 1997) were selected, and the frontal cortex was delineated as described before, drawing an angle of 45° and taking the entire area within this triangle, from the corpus callosum up (Kantor et al. 2006). The frontal cortex was divided into layers II–IV, and layers V–VI, respectively. Volumes were calculated from projection area measurements and the average actual section thickness after histological processing, using Cavalieri’s principle (Gundersen and Jensen 1987). The actual section thickness was measured with the electronic microcator of a stereology workstation (described below) and a UPlanSApo 40× objective (NA = 0.9; Olympus, Tokyo, Japan). All details regarding the stereologic analysis were extensively described by Schmitz and Hof (2005). Microscopic inspection of the sections was performed with a Stereo Investigator Confocal Spinning Disk (SI-SD) system (MBF Bioscience; Williston, VT, USA), consisting of a modified Olympus BX51 fluorescence microscope (Olympus) with UPlanSApo objectives 10× (NA = 0.4; Olympus), 20× (NA = 0.75; Olympus) and 40× (NA = 0.9; Olympus), customized spinning disk unit (DSU; Olympus), computer-controlled excitation and emission filter wheels (Olympus), three-axis high-accuracy computer-controlled stepping motor specimen stage (4 × 4 Grid Encoded Stage; Ludl Electronic Products, Hawthorne, NY, USA), linear z-axis position encoder (Ludl), ultra-high sensitivity monochrome electron multiplier CCD camera (1,000 × 1,000 pixels, C9100-02; Hamamatsu Photonics, Hamamatsu City, Japan), and controlling software (StereoInvestigator; MBF Bioscience). The Optical Fractionator Probe was used to quantify numbers of NeuN-ir cells. The surface area of the unbiased virtual counting spaces (UVCS) used to count the neurons was 900 μm2, the height of the UVCS was 14 μm (upper and lower guard zones were 1.5 μm each), and the distance between the UVCS in orthogonal directions X and Y was 250 and 125 μm, respectively. Cells were counted if they fell inside the unbiased virtual counting frame and the top of the nucleus came into focus within the optical disector height. The counting variability was measured with the Schmitz–Hof coefficient of error (CE) (Schmitz 1998). The CE for of both layers II–IV and layers V–VI was 0.057.
Numbers of PV-ir and CR-ir neurons
The numbers of PV-ir and CR-ir neurons were assessed with a computerized stereology workstation, consisting of a modified fluorescent light microscope (Olympus BX50), motorized specimen stage for automatic sampling (Ludl), focus drive linear encoder (Ludl Electronics), CCD colour video camera (HVC20AMP; Hitachi, Tokyo, Japan), and stereology software (StereoInvestigator; MBF Bioscience). All PV-ir and CR-ir neurons coming into focus within the section thickness were counted (Takahashi et al. 2010). Then, densities of PV-ir and CR-ir neurons were calculated by dividing the number of counted neurons per region (i.e., layers II–IV and layers V–VI, respectively) by the product of the cut section thickness (30 μm) with the sum of all cross-sectional areas of this region. This was valid as all PV-ir and CR-ir neurons coming into focus within the section thickness were counted. Numbers of PV-ir and CR-ir neurons were obtained by multiplying the volumes of layers II–IV and layers V–VI with the densities of PV-ir and CR-ir neurons within the corresponding regions. For the delineation of the entire frontal cortex or layers II–IV and layers V–VI, respectively, a 10× objective was used (UplanApo, NA = 0.40), and for counting PV-ir and CR-ir neurons a 40× oil objective (UplanApo, NA = 1.00). The base of the UVCS used to count neurons was the same as the grid size, namely 125 μm (X) by 100 μm (Y) and the measured actual average section thickness after histological processing was 20.55 μm (Schmitz 1998). The counting variability was measured with the Schmitz–Hof coefficient of error (CE) (Schmitz 1998). The CE for PV-ir neurons was 0.041 and for the CR-ir neurons, the CE was 0.064.
Plaque load
The plaque load was analyzed with the same stereology workstation that was used to determine the numbers of the PV-ir and CR-ir neurons, using a 40× oil objective (UplanApo, NA = 1.00). Both markers for amyloid plaques (amyloid-beta and thioflavin S) were analyzed as relative volumes with the Cavalieri probe of the StereoInvestigator software (MBF Bioscience) and a grid size of 20 μm × 20 μm. The Cavalieri probe is implemented by overlaying a rectangular lattice of points on the frontal cortex and then counting the number of points in the lattice that lie within a plaque.
Statistical analysis
For each group of mice, mean and standard error of the mean were calculated for the estimated volumes of brain regions, plaque load, overall neuron numbers, and PV-ir and CR-ir neuron numbers. Comparisons between 2- and 10-month-old animals were performed with two-way analysis of variance (ANOVA; univariate; with age and genotype as fixed factors) followed by post-hoc Bonferroni’s multiple comparison test for pair-wise comparisons. Statistical significance was established at p < 0.05. Calculations were performed using GraphPad Prism (Version 4.00 for Windows; GraphPad Software, San Diego, CA, USA).
Photography
All photomicrographs were captured with the SI–SD system described above (MBF Bioscience). Only minor adjustments were made in brightness and contrast, without changing the original content of the pictures.
Results
Volume of the frontal cortex
The mean volume of the frontal cortex (or of respectively layers II–IV and layers V–VI within the frontal cortex) did not differ significantly among the groups of mice (Fig. 1; all significant p values of the ANOVAs are summarized in Table 1).
Fig. 1.
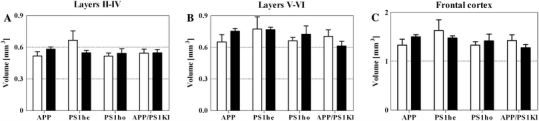
Mean and standard error of the mean (SEM) of volumes of layers II–IV (a), layers V–VI (b), and the entire frontal cortex (c) of 2-month-old (open bars) and 10-month-old (closed bars) APP mice, PS1he mice, PS1ho mice, and APP/PS1KI mice. Statistical analysis did not reveal significant differences among the groups of mice (p < 0.05)
Table 1.
Overview of significant ANOVA p values (<0.05), for both fixed factors (age and genotype) and their interaction
| ANOVA | Age (p) | Genotype (p) | Interaction (p) |
|---|---|---|---|
| NeuN-ir neurons in layers V–VI | 0.1746 | 0.0304 | 0.1746 |
| PV-ir neurons in layers II–IV | 0.0111 | 0.6076 | 0.0528 |
| PV-ir neurons in layers V–VI | 0.7887 | 0.3007 | 0.0037 |
| Amyloid-beta in layers II–IV | <0.0001 | <0.0001 | <0.0001 |
| Amyloid-beta in layers V–VI | <0.0001 | <0.0001 | <0.0001 |
| Thioflavin S in layers II–IV | <0.0001 | <0.0001 | <0.0001 |
| Thioflavin S in layers V–VI | <0.0001 | <0.0001 | <0.0001 |
Bold values are statistically significant (i.e. p < 0.05)
The mean volume ± SEM (in mm3) for the total frontal cortex was 1.330 ± 0.119 for APP M2; 1.500 ± 0.042 for APP M10; 1.629 ± 0.218 for PS1he M2; 1.471 ± 0.046 for PS1he M10; 1.331 ± 0.068 for PS1ho M2; 1.416 ± 0.139 for PS1ho M10; 1.422 ± 0.117 for APP/PS1KI M2 and 1.275 ± 0.066 for APP/PS1KI M10. The mean volume ± SEM (in mm3) for layers II–IV was 0.518 ± 0.041 for APP M2; 0.582 ± 0.021 for APP M10; 0.666 ± 0.090 for PS1he M2; 0.548 ± 0.023 for PS1he M10; 0.516 ± 0.028 for PS1ho M2; 0.542 ± 0.044 for PS1ho M10; 0.544 ± 0.038 for APP/PS1KI M2 and 0.546 ± 0.031 for APP/PS1KI M10. The mean volume ± SEM (in mm3) for layers V–VI was 0.652 ± 0.068 for APP M2; 0.754 ± 0.025 for APP M10; 0.773 ± 0.115 for PS1he M2; 0.767 ± 0.024 for PS1he M10; 0.662 ± 0.032 for PS1ho M2; 0.723 ± 0.080 for PS1ho M10; 0.704 ± 0.062 for APP/PS1KI M2 and 0.613 ± 0.044 for APP/PS1KI M10.
Numbers of NeuN-ir, PV-ir, and CR-ir neurons
In layers II–IV of the frontal cortex, the mean number of NeuN-ir neurons did not differ significantly among the groups of mice (Fig. 2). In contrast, a statistically significant decrease of 34% was found in the mean number of NeuN-ir neurons in layers V–VI of the frontal cortex in APP/PS1KI mice at M10 compared to M2 (Table 1; Figs. 2b, 3). The mean number of NeuN-ir neurons ± SEM for layers II–IV was 74,100.850 ± 9,534.305 for APP M2; 101,155.700 ± 4,778.673 for APP M10; 118,913.400 ± 21,318.720 for PS1he M2; 98,809.700 ± 8,171.961 for PS1he M10; 81,321.560 ± 8,705.061 for PS1ho M2; 111,689.200 ± 13,577.850 for PS1ho M10; 96,401.660 ± 6,566.594 for APP/PS1KI M2 and 88,737.490 ± 2,714.963 for APP/PS1KI M10. The mean number of NeuN-ir neurons ± SEM for layers V–VI was 94,070.380 ± 12,013.250 for APP M2; 90,665.040 ± 3,728.086 for APP M10; 105,525.300 ± 17,185.940 for PS1he M2; 101,437.200 ± 3,994.310 for PS1he M10; 90,533.980 ± 2,619.225 for PS1ho M2; 99,831.590 ± 9,228.039 for PS1ho M10; 95,491.390 ± 5,957.515 for APP/PS1KI M2 and 63,374.960 ± 5,099.795 for APP/PS1KI M10.
Fig. 2.
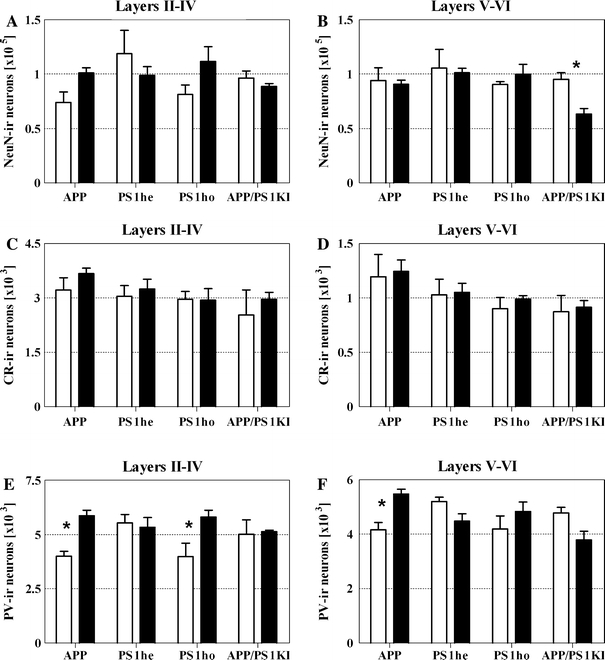
Mean and standard error of the mean (SEM) of numbers of NeuN-ir neurons (a, b), CR-ir neurons (c, d), and PV-ir neurons (e, f) within layers II–IV (a, c, e) and layers V–VI (b, d, f) of 2-month-old (open bars) and 10-month-old (closed bars) APP mice, PS1he mice, PS1ho mice, and APP/PS1KI mice. Statistical analysis revealed significant (p ANOVA < 0.05) differences among the groups of mice in b (numbers of NeuN-ir neurons within layers V–VI), e (numbers of PV-ir neurons within layers II–IV), and f (numbers of PV-ir neurons within layers V–VI), respectively. Results of post-hoc Bonferroni’s multiple comparison test for pair-wise comparisons are indicated by asterisks (*p < 0.05)
Fig. 3.
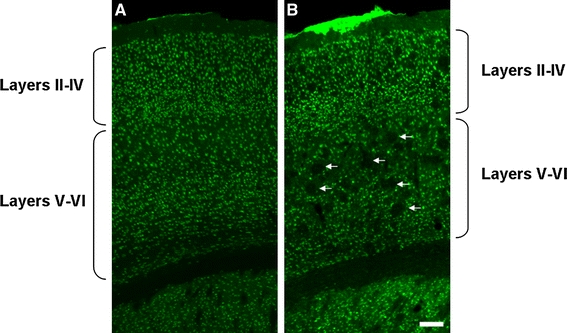
Representative photomicrographs of coronal sections showing the frontal cortex of 2- (a) and 10-month-old (b) APP/PS1KI mice, immunoprocessed for the detection of NeuN. Note the age-related increase in the plaque load (holes, indicated by arrows). The scale bar represents 100 μm
The mean numbers of CR-ir neurons showed no significant differences among the groups of mice (Figs. 2c, d, 4). In contrast, the mean numbers of PV-ir neurons did differ significantly (Table 1; Figs. 2e, f, 4). Surprisingly, the APP mice showed a significant (p < 0.05) age-related increase in the mean total numbers of PV-ir neurons in both layers II–IV and layers V–VI between M2 and M10. A similar age-related increase was found in the mean number of PV-ir neurons in layers II–IV of the PS1ho mice, but not the PS1he mice or the APP/PS1KI mice. The mean number of CR-ir neurons ± SEM for layers II–IV was 3,220.667 ± 334.491 for APP M2; 3,669.833 ± 149.847 for APP M10; 3,043.667 ± 299.130 for PS1he M2; 3,247.143 ± 270.756 for PS1he M10; 2,961.000 ± 216.431 for PS1ho M2; 2,939.000 ± 319.162 for PS1ho M10; 2,530.000 ± 693.574 for APP/PS1KI M2 and 2,960.667 ± 187.024 for APP/PS1KI M10. The mean number of CR-ir neurons ± SEM for layers V–VI was 1,195.667 ± 203.851 for APP M2; 1,244.833 ± 104.241 for APP M10; 1,027.667 ± 145.502 for PS1he M2; 1,050.000 ± 86.112 for PS1he M10; 903.250 ± 100.945 for PS1ho M2; 988.250 ± 33.807 for PS1ho M10; 872.000 ± 150.742 for APP/PS1KI M2 and 913.000 ± 62.386 for APP/PS1KI M10. The mean number of PV-ir neurons ± SEM for layers II–IV was 4,005.333 ± 218.155 for APP M2; 5,865.667 ± 249.856 for APP M10; 5,538.000 ± 386.355 for PS1he M2; 5,330.857 ± 452.588 for PS1he M10; 3,983.250 ± 616.890 for PS1ho M2; 5,808.250 ± 309.408 for PS1ho M10; 5,012.333 ± 657.345 for APP/PS1KI M2 and 5,126.333 ± 76.062 for APP/PS1KI M10. The mean number of PV-ir neurons ± SEM for layers V–VI was 4,161.333 ± 269.094 for APP M2; 5,470.000 ± 182.240 for APP M10; 5,200.667 ± 154.942 for PS1he M2; 4,484.000 ± 263.349 for PS1he M10; 4,194.000 ± 480.449 for PS1ho M2; 4,836.500 ± 345.734 for PS1ho M10; 4,778.667 ± 201.878 for APP/PS1KI M2 and 3,789.333 ± 321.910 for APP/PS1KI M10.
Fig. 4.
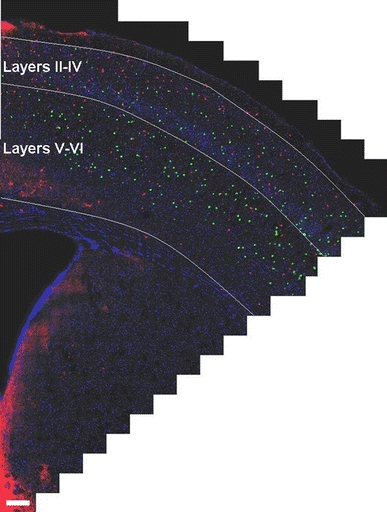
Representative photomicrograph of CV-ir neurons (red) and PV-ir neurons (green) in the frontal cortex of a 2-month-old PS1ho mouse. The picture was created by montaging a total of 573 high-resolution fields-of-view into a single two-dimensional virtual slide. The scale bar represents 200 μm
Plaque load
Both APP mice and APP/PS1KI mice showed an age-related increase in the mean plaque load between M2 and M10 in the frontal cortex (Table 1; Figs. 5, 6). In the frontal cortex of the APP/PS1KI mice, the mean plaque load (immunohistochemical detection of amyloid-beta) increased in layers II–IV from 0.2% at M2 to 7.3% at M10, and in layers V–VI from 1% at M2 to 11.3% at M10. PS1he and PS1ho mice did not exhibit amyloid plaques.
Fig. 5.
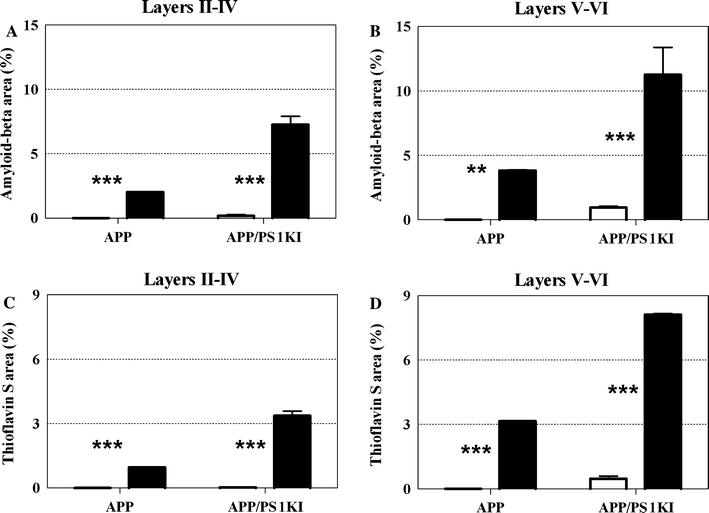
Mean and standard error of the mean (SEM) of the plaque load within layers II–IV (a, c) and layers V–VI (b, d) of the frontal cortex of 2-month-old (open bars) and 10-month-old (closed bars) APP mice and APP/PS1KI mice, analyzed by immunohistochemical detection of amyloid-beta (a, b) or staining of the plaque cores with thioflavin S (c, d), respectively. Statistical analysis revealed significant (p ANOVA < 0.05) differences among the groups of mice in a–d. Results of post-hoc Bonferroni’s multiple comparison test for pair-wise comparisons are indicated by asterisks (**p < 0.01; ***p < 0.001). PS1he and PS1ho mice did not exhibit amyloid plaques. The SEM of APP mice (all graphs) and 10-month-old APP/PS1 mice are not shown because the interindividual variation was too small
Fig. 6.
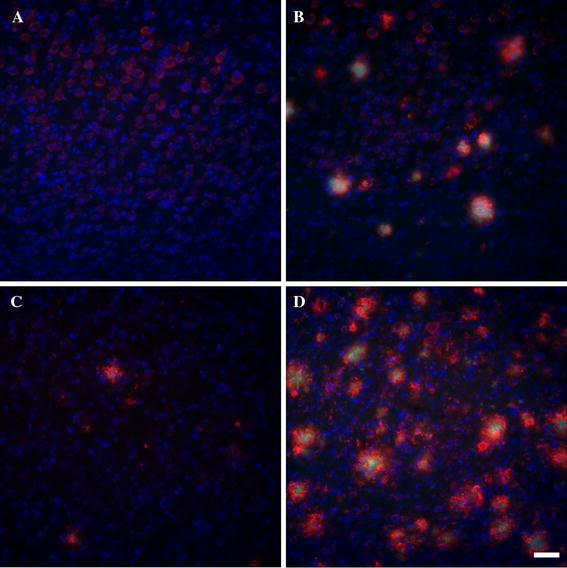
Representative photomicrographs of plaque load in layers V–VI of the frontal cortex of 2- and 10-month-old APP (a, b) and APP/PS1KI mice (c, d). Amyloid-beta is shown in red, thioflavin S in green and Hoechst in blue. Since PS1he and PS1ho mice do not have plaques, these mice were not included in the figure. Each image is the maximum intensity projection of a complete confocal image stack of 15 μm thick on average, with a distance between the single images of 0.5 μm. The scale bar represents 50 μm
The mean percentage of plaque load ± SEM for layers II–IV was 0.000 ± 0.000 for APP M2 (amyloid-beta and thioflavin S); 2.027 ± 0.008 for APP M10 (amyloid-beta); 0.954 ± 0.000 for APP M10 (thioflavin S); 0.178 ± 0.110 for APP/PS1KI M2 (amyloid-beta); 0.025 ± 0.025 for APP/PS1KI M2 (thioflavin S); 7.260 ± 0.643 for APP/PS1KI M10 (amyloid-beta) and 3.363 ± 0.210 for APP/PS1KI M10 (thioflavin S). The mean percentage of plaque load ± SEM for layers V–VI was 0.000 ± 0.000 for APP M2 (amyloid-beta and thioflavin S); 3.826 ± 0.066 for APP M10 (amyloid-beta); 3.155 ± 0.000 for APP M10 (thioflavin S); 0.956 ± 0.101 for APP/PS1KI M2 (amyloid-beta); 0.470 ± 0.108 for APP/PS1KI M2 (thioflavin S); 11.260 ± 2.177 for APP/PS1KI M10 (amyloid-beta); and 8.112 ± 0.044 for APP/PS1KI M10 (thioflavin S).
Discussion
The present study resulted in two main findings that were not reported in the literature before: (i) unlike APP mice, PS1he mice and PS1ho mice, APP/PS1KI mice showed an age-related, averaged 34% loss of neurons in layers V–VI of the frontal cortex between M2 and M10, which exceeded the plaque load in these cortical layers. (ii) APP mice and PS1ho mice, but not PS1he mice and APP/PS1KI mice, showed an age-related increase in the mean total numbers of PV-ir neurons in cortical layers II–IV between M2 and M10 (APP mice also in layers V–VI).
With respect to the age-related neuron loss in layers V–VI, but not in layers II–IV, of the frontal cortex of the APP/PS1KI mice, the data reported by Christensen et al. (2008) is in line with our study. These authors also investigated neuron loss in the frontal cortex of APP/PS1KI mice with design-based stereology, and found—compared to PS1ho mice—an average 30% neuron loss in the frontal cortex between M2 and M10, and an age-related increase in average plaque load from 5% at M2 to 13% at M10. However, unlike in the present study, Christensen et al. (2008) did not perform layer-specific analyses of neuron numbers, did not investigate the frontal cortex of APP mice and PS1he mice, and did not study numbers of CR-ir and PV-ir neurons. Based on light microscopic analysis of immunohistochemical detection of amyloid-beta, Christensen et al. (2008) concluded that age-related neuron loss in the frontal cortex of APP/PS1KI mice was due to transient intraneuronal amyloid-beta, rather than extracellular plaque pathology.
The finding that the extent of age-related neuron loss could not be accounted for by the coverage of the plaque load was also observed in the hippocampal CA1/2 region of APP/PS1KI mice at M10 compared to M2 (Casas et al. 2004) as well as in the hippocampal CA1/2 region of double transgenic APP751/PS1M146L mice at M17 compared to M2 (Schmitz et al. 2004). Thus, it appears that neuron loss in transgenic mouse models of AD is not just the result of the occurrence of extracellular amyloid-beta plaques (also discussed in Bayer and Wirths 2008; Wirths et al. 2010). The same appears to happen in human AD (Gomez-Isla et al. 1997) where the clinical severity of AD cannot be predicted from the amount of amyloid-beta plaques alone, and substantial numbers of amyloid-beta plaques can be present in otherwise symptom-free elderly (Giannakopoulos et al. 2003). It has been suggested that intraneuronal amyloid-beta aggregates could be a major contributing early factor for neuron loss in human AD, as well as in transgenic mouse models of AD. In this regard, abundant intraneuronal amyloid-beta 40–42, together with neuronal stress markers, is known to be present before the occurrence of extracellular amyloid-beta plaques in hippocampal neurons of double transgenic APP751/PS1M146L mice (Wirths et al. 2001). Obviously, this neuron loss may be accompanied, or even preceded, by other signs of neuropathology, such as synapse loss (Moechars et al. 1999; Pratico et al. 2001).
The age-related increase in the total number of PV-ir neurons in the frontal cortex of 10-month-old APP mice and PS1ho mice was unexpected and this study is therefore, to our knowledge, the first to report such an age-related increase in a mouse model of AD. In contrast, the hippocampus of PS1he mice, PS1ho mice and APP/PS1KI mice showed a complex pattern of age-related loss of CR-ir and PV-ir neurons in the different hippocampal subregions, but no age-related increase in the numbers of these neurons (Takahashi et al. 2010). This indicates that the increase in the number of PV-ir neurons in APP mice and PS1ho mice is region-specific.
Conflicting reports exist about the fate of CR-ir and PV-ir neurons in AD. While some studies stated that PV-ir neurons are resistant to AD pathology (Ferrer et al. 1991; Hof et al. 1991; Sampson et al. 1997), other studies reported significant loss of these neurons in both hippocampus and cortex (Arai et al. 1987; Brady and Mufson 1997; Mikkonen et al. 1999; Satoh et al. 1991; Solodkin et al. 1996).
A possible explanation for the age-related increase in PV-ir neuron number in the frontal cortex of APP mice and PS1ho mice could be proliferation. However, although postnatal neurogenesis could in theory be implicated, it appears—if at all existent—very rare, particularly in the adult cortex (Thompson et al. 2008; Rakic 2002; Gould 2007; Marlatt and Lucassen 2010). An alternative option could be the presence of delayed differentiation. Next to its well-known toxic properties (Trotti et al. 1998; Mattson et al. 1992), amyloid-beta can also serve as a neurotrophic factor for differentiating neurons (Yankner et al. 1990; Kwak et al. 2006). Based on these opposite aspects of amyloid-beta, one could postulate that the mutations in APP and PS1 induced an overproduction of amyloid-beta, which—due to its neurotrophic function—could have initially promoted neuronal growth, development and survival, resulting in (delayed) differentiation of PV-ir neurons in the frontal cortex of APP mice and PS1ho mice. However, when all mutations are combined in APP/PS1KI mice, this may have resulted in an excessive amount of amyloid-beta through which its toxic effects overruled effects on neuronal differentiation.
Alternatively, a delayed differentiation (or proliferation) could occur as a protective mechanism triggered by initial toxic effects of amyloid-beta. Such a protective or compensatory mechanism could be involved in amyloid-beta action particularly in the APP mice and PS1ho mice, and at least partly explain the results of the present study. Although not investigated in great detail, previous studies have suggested neurotrophic and proliferative effects of selective amyloid-beta fragments in in vitro models, as well as in the response of neurogenesis in some AD mouse models (Marlatt and Lucassen 2010; Kuhn et al. 2007; Thompson et al. 2008). Together, these results indicate that in response to a pathogenic stimulus, neuronal de-differentiation and reengagement in cell cycle may occur, but only under restricted conditions and in specific subregions of the brain. An additional explanation in this regard is that the age-related increase in the mean numbers of PV-ir neurons in the frontal cortex of APP mice and PS1ho mice could occur in an attempt to protect pyramidal neurons against excitotoxicity. Finally, a less obvious mechanism could involve alterations in migration processes of neurons, since it is known that both APP and PS1 are involved in neurodevelopment. Loss of PS1 function was shown to inhibit normal migratory trajectories of neurons during neurodevelopment (Louvi et al. 2004), and deficiency of APP further reduces not only viability of postnatal mice but also produces cortical developmental abnormalities that resemble lissencephaly, a cortical condition in which no normal gyri are formed in the brain of humans (Herms et al. 2004).
Considering these three possible mechanisms, the most likely explanation for the age-related increase in the mean numbers of PV-ir neurons in the frontal cortex of APP mice and PS1ho mice would be altered or delayed neuronal differentiation. Thus, the present changes may be the result of a complex interplay of pathological as well as physiological roles of the APP and PS1 proteins and needs to be addressed in detail in future studies.
Acknowledgments
Figures 3, 4 and 6 were generated with an SI–SD system (MBF Bioscience), which was obtained by NWO grant no. 91106003. Furthermore, this work was supported by the European Commission, MarieCurie Early Stage Training, MEST-CT-2005-020013 (NEURAD consortium), Alzheimer Ph.D. Graduate School. PJL is supported by the EU (NEURAD), the Internationale Stichting Alzheimer Onderzoek (ISAO), the International Parkinson Foundation (IPF), and the Dutch Brain Foundation.
Open Access
This article is distributed under the terms of the Creative Commons Attribution Noncommercial License which permits any noncommercial use, distribution, and reproduction in any medium, provided the original author(s) and source are credited.
Footnotes
The authors Harry W. M. Steinbusch, Paul J. Lucassen and Christoph Schmitz have equally contributed to the work.
References
- Anderson CT, Sheets PL, Kiritani T, Shepherd GMG. Sublayer-specific microcircuits of corticospinal and corticostriatal neurons in motor cortex. Nat Neurosci. 2010;13(6):739–744. doi: 10.1038/nn.2538. [DOI] [PMC free article] [PubMed] [Google Scholar]
- Arai H, Emson PC, Mountjoy CQ, Carassco LH, Heizmann CW. Loss of parvalbumin-immunoreactive neurones from cortex in Alzheimer-type dementia. Brain Res. 1987;418(1):164–169. doi: 10.1016/0006-8993(87)90974-7. [DOI] [PubMed] [Google Scholar]
- Bayer TA, Wirths O. Review on the APP/PS1KI mouse model: intraneuronal Abeta accumulation triggers axonopathy, neuron loss and working memory impairment. Genes Brain Behav. 2008;7(Suppl 1):6–11. doi: 10.1111/j.1601-183X.2007.00372.x. [DOI] [PubMed] [Google Scholar]
- Braak H, Braak E, Yilmazer D, de Vos RA, Jansen EN, Bohl J. Pattern of brain destruction in Parkinson’s and Alzheimer’s diseases. J Neural Transm. 1996;103(4):455–490. doi: 10.1007/BF01276421. [DOI] [PubMed] [Google Scholar]
- Brady DR, Mufson EJ. Parvalbumin-immunoreactive neurons in the hippocampal formation of Alzheimer’s diseased brain. Neuroscience. 1997;80(4):1113–1125. doi: 10.1016/S0306-4522(97)00068-7. [DOI] [PubMed] [Google Scholar]
- Brun A, Englund E. Regional pattern of degeneration in Alzheimer’s disease: neuronal loss and histopathological grading. Histopathology. 1981;5(5):549–564. doi: 10.1111/j.1365-2559.1981.tb01818.x. [DOI] [PubMed] [Google Scholar]
- Bussiere T, Giannakopoulos P, Bouras C, Perl DP, Morrison JH, Hof PR. Progressive degeneration of nonphosphorylated neurofilament protein-enriched pyramidal neurons predicts cognitive impairment in Alzheimer’s disease: stereologic analysis of prefrontal cortex area 9. J Comp Neurol. 2003;463(3):281–302. doi: 10.1002/cne.10760. [DOI] [PubMed] [Google Scholar]
- Casas C, Sergeant N, Itier JM, Blanchard V, Wirths O, van der Kolk N, Vingtdeux V, van de Steeg E, Ret G, Canton T, Drobecq H, Clark A, Bonici B, Delacourte A, Benavides J, Schmitz C, Tremp G, Bayer TA, Benoit P, Pradier L. Massive CA1/2 neuronal loss with intraneuronal and N-terminal truncated Abeta42 accumulation in a novel Alzheimer transgenic model. Am J Pathol. 2004;165(4):1289–1300. doi: 10.1016/S0002-9440(10)63388-3. [DOI] [PMC free article] [PubMed] [Google Scholar]
- Cauli B, Audinat E, Lambolez B, Angulo MC, Ropert N, Tsuzuki K, Hestrin S, Rossier J. Molecular and physiological diversity of cortical nonpyramidal cells. J Neurosci. 1997;17(10):3894–3906. doi: 10.1523/JNEUROSCI.17-10-03894.1997. [DOI] [PMC free article] [PubMed] [Google Scholar]
- Christensen DZ, Kraus SL, Flohr A, Cotel MC, Wirths O, Bayer TA. Transient intraneuronal A beta rather than extracellular plaque pathology correlates with neuron loss in the frontal cortex of APP/PS1KI mice. Acta Neuropathol. 2008;116(6):647–655. doi: 10.1007/s00401-008-0451-6. [DOI] [PubMed] [Google Scholar]
- Conde F, Lund JS, Jacobowitz DM, Baimbridge KG, Lewis DA. Local circuit neurons immunoreactive for calretinin, calbindin D-28k or parvalbumin in monkey prefrontal cortex: distribution and morphology. J Comp Neurol. 1994;341(1):95–116. doi: 10.1002/cne.903410109. [DOI] [PubMed] [Google Scholar]
- Cummings JL, Cole G. Alzheimer disease. JAMA. 2002;287(18):2335–2338. doi: 10.1001/jama.287.18.2335. [DOI] [PubMed] [Google Scholar]
- Dickson DW. Neuropathology of Alzheimer’s disease and other dementias. Clin Geriatr Med. 2001;17(2):209–228. doi: 10.1016/S0749-0690(05)70066-5. [DOI] [PubMed] [Google Scholar]
- Duyckaerts C, Delatour B, Potier MC. Classification and basic pathology of Alzheimer disease. Acta Neuropathol. 2009;118(1):5–36. doi: 10.1007/s00401-009-0532-1. [DOI] [PubMed] [Google Scholar]
- Duyckaerts C, Potier MC, Delatour B. Alzheimer disease models and human neuropathology: similarities and differences. Acta Neuropathol. 2008;115(1):5–38. doi: 10.1007/s00401-007-0312-8. [DOI] [PMC free article] [PubMed] [Google Scholar]
- Ferrer I, Soriano E, Tunon T, Fonseca M, Guionnet N. Parvalbumin immunoreactive neurons in normal human temporal neocortex and in patients with Alzheimer’s disease. J Neurol Sci. 1991;106(2):135–141. doi: 10.1016/0022-510X(91)90250-B. [DOI] [PubMed] [Google Scholar]
- Francis P (2006) Targeting cell death in dementia. Alzheimer Dis Assoc Disord 20(2 Suppl 1):S3–S7. doi:10.1097/01.wad.0000213803.82058.46 [DOI] [PubMed]
- Franklin KBJ, Paxinos G. The mouse brain in stereotaxic coordinates. San Diego: Academic Press; 1997. [Google Scholar]
- Giannakopoulos P, Herrmann FR, Bussiere T, Bouras C, Kovari E, Perl DP, Morrison JH, Gold G, Hof PR. Tangle and neuron numbers, but not amyloid load, predict cognitive status in Alzheimer’s disease. Neurology. 2003;60(9):1495–1500. doi: 10.1212/01.wnl.0000063311.58879.01. [DOI] [PubMed] [Google Scholar]
- Gomez-Isla T, Hollister R, West H, Mui S, Growdon JH, Petersen RC, Parisi JE, Hyman BT. Neuronal loss correlates with but exceeds neurofibrillary tangles in Alzheimer’s disease. Ann Neurol. 1997;41(1):17–24. doi: 10.1002/ana.410410106. [DOI] [PubMed] [Google Scholar]
- Gotz J, Gotz NN (2009) Animal models for Alzheimer’s disease and frontotemporal dementia: a perspective. ASN Neuro 1(4). doi: 10.1042/AN20090042 [DOI] [PMC free article] [PubMed]
- Gould E. How widespread is adult neurogenesis in mammals? Nat Rev Neurosci. 2007;8(6):481–488. doi: 10.1038/nrn2147. [DOI] [PubMed] [Google Scholar]
- Gundersen HJ, Jensen EB. The efficiency of systematic sampling in stereology and its prediction. J Microsc. 1987;147(Pt 3):229–263. doi: 10.1111/j.1365-2818.1987.tb02837.x. [DOI] [PubMed] [Google Scholar]
- Hardy J, Selkoe DJ. The amyloid hypothesis of Alzheimer’s disease: progress and problems on the road to therapeutics. Science. 2002;297(5580):353–356. doi: 10.1126/science.1072994. [DOI] [PubMed] [Google Scholar]
- Herms J, Anliker B, Heber S, Ring S, Fuhrmann M, Kretzschmar H, Sisodia S, Muller U. Cortical dysplasia resembling human type 2 lissencephaly in mice lacking all three APP family members. EMBO J. 2004;23(20):4106–4115. doi: 10.1038/sj.emboj.7600390. [DOI] [PMC free article] [PubMed] [Google Scholar]
- Hof PR, Cox K, Morrison JH. Quantitative analysis of a vulnerable subset of pyramidal neurons in Alzheimer’s disease: I. superior frontal and inferior temporal cortex. J Comp Neurol. 1990;301(1):44–54. doi: 10.1002/cne.903010105. [DOI] [PubMed] [Google Scholar]
- Hof PR, Cox K, Young WG, Celio MR, Rogers J, Morrison JH. Parvalbumin-immunoreactive neurons in the neocortex are resistant to degeneration in Alzheimer’s disease. J Neuropathol Exp Neurol. 1991;50(4):451–462. doi: 10.1097/00005072-199107000-00006. [DOI] [PubMed] [Google Scholar]
- Kantor O, Temel Y, Holzmann C, Raber K, Nguyen HP, Cao C, Turkoglu HO, Rutten BP, Visser-Vandewalle V, Steinbusch HW, Blokland A, Korr H, Riess O, von Horsten S, Schmitz C (2006) Selective striatal neuron loss and alterations in behavior correlate with impaired striatal function in Huntington’s disease transgenic rats. Neurobiol Dis 22:538–547 [DOI] [PubMed]
- Kawaguchi Y, Kubota Y. GABAergic cell subtypes and their synaptic connections in rat frontal cortex. Cereb Cortex. 1997;7(6):476–486. doi: 10.1093/cercor/7.6.476. [DOI] [PubMed] [Google Scholar]
- Kubota Y, Kawaguchi Y. Three classes of GABAergic interneurons in neocortex and neostriatum. Jpn J Physiol. 1994;44(Suppl 2):S145–148. [PubMed] [Google Scholar]
- Kuhn HG, Cooper-Kuhn CM, Boekhoorn K, Lucassen PJ. Changes in neurogenesis in dementia and Alzheimer mouse models: are they functionally relevant? Eur Arch Psychiatry Clin Neurosci. 2007;257(5):281–289. doi: 10.1007/s00406-007-0732-4. [DOI] [PubMed] [Google Scholar]
- Kwak YD, Brannen CL, Qu T, Kim HM, Dong X, Soba P, Majumdar A, Kaplan A, Beyreuther K, Sugaya K. Amyloid precursor protein regulates differentiation of human neural stem cells. Stem Cells Dev. 2006;15(3):381–389. doi: 10.1089/scd.2006.15.381. [DOI] [PubMed] [Google Scholar]
- Louvi A, Sisodia SS, Grove EA. Presenilin 1 in migration and morphogenesis in the central nervous system. Development. 2004;131(13):3093–3105. doi: 10.1242/dev.01191. [DOI] [PubMed] [Google Scholar]
- Mann DM, Marcyniuk B, Yates PO, Neary D, Snowden JS. The progression of the pathological changes of Alzheimer’s disease in frontal and temporal neocortex examined both at biopsy and at autopsy. Neuropathol Appl Neurobiol. 1988;14(3):177–195. doi: 10.1111/j.1365-2990.1988.tb00880.x. [DOI] [PubMed] [Google Scholar]
- Marlatt MW, Lucassen PJ. Neurogenesis and Alzheimer’s disease: biology and pathophysiology in mice and men. Curr Alzheimer Res. 2010;7(2):113–125. doi: 10.2174/156720510790691362. [DOI] [PubMed] [Google Scholar]
- Mattson MP, Cheng B, Davis D, Bryant K, Lieberburg I, Rydel RE. Beta-amyloid peptides destabilize calcium homeostasis and render human cortical neurons vulnerable to excitotoxicity. J Neurosci. 1992;12(2):376–389. doi: 10.1523/JNEUROSCI.12-02-00376.1992. [DOI] [PMC free article] [PubMed] [Google Scholar]
- Mesulam MM, Geula C. Acetylcholinesterase-rich pyramidal neurons in the human neocortex and hippocampus: absence at birth, development during the life span, and dissolution in Alzheimer’s disease. Ann Neurol. 1988;24(6):765–773. doi: 10.1002/ana.410240611. [DOI] [PubMed] [Google Scholar]
- Mikkonen M, Alafuzoff I, Tapiola T, Soininen H, Miettinen R. Subfield- and layer-specific changes in parvalbumin, calretinin and calbindin-D28 K immunoreactivity in the entorhinal cortex in Alzheimer’s disease. Neuroscience. 1999;92(2):515–532. doi: 10.1016/S0306-4522(99)00047-0. [DOI] [PubMed] [Google Scholar]
- Miller EK, Cohen JD. An integrative theory of prefrontal cortex function. Annu Rev Neurosci. 2001;24:167–202. doi: 10.1146/annurev.neuro.24.1.167. [DOI] [PubMed] [Google Scholar]
- Moechars D, Dewachter I, Lorent K, Reverse D, Baekelandt V, Naidu A, Tesseur I, Spittaels K, Haute CV, Checler F, Godaux E, Cordell B, Van Leuven F. Early phenotypic changes in transgenic mice that overexpress different mutants of amyloid precursor protein in brain. J Biol Chem. 1999;274(10):6483–6492. doi: 10.1074/jbc.274.10.6483. [DOI] [PubMed] [Google Scholar]
- Morrison JH, Hof PR. Selective vulnerability of corticocortical and hippocampal circuits in aging and Alzheimer’s disease. Prog Brain Res. 2002;136:467–486. doi: 10.1016/S0079-6123(02)36039-4. [DOI] [PubMed] [Google Scholar]
- Morrison JH, Hof PR. Life and death of neurons in the aging cerebral cortex. Int Rev Neurobiol. 2007;81:41–57. doi: 10.1016/S0074-7742(06)81004-4. [DOI] [PubMed] [Google Scholar]
- Phinney AL, Horne P, Yang J, Janus C, Bergeron C, Westaway D. Mouse models of Alzheimer’s disease: the long and filamentous road. Neurol Res. 2003;25(6):590–600. doi: 10.1179/016164103101202020. [DOI] [PubMed] [Google Scholar]
- Pratico D, Uryu K, Leight S, Trojanoswki JQ, Lee VM. Increased lipid peroxidation precedes amyloid plaque formation in an animal model of Alzheimer amyloidosis. J Neurosci. 2001;21(12):4183–4187. doi: 10.1523/JNEUROSCI.21-12-04183.2001. [DOI] [PMC free article] [PubMed] [Google Scholar]
- Price DL, Sisodia SS. Mutant genes in familial Alzheimer’s disease and transgenic models. Annu Rev Neurosci. 1998;21:479–505. doi: 10.1146/annurev.neuro.21.1.479. [DOI] [PubMed] [Google Scholar]
- Probst A, Langui D, Ulrich J. Alzheimer’s disease: a description of the structural lesions. Brain Pathol. 1991;1(4):229–239. doi: 10.1111/j.1750-3639.1991.tb00666.x. [DOI] [PubMed] [Google Scholar]
- Rakic P. Neurogenesis in adult primate neocortex: an evaluation of the evidence. Nat Rev Neurosci. 2002;3(1):65–71. doi: 10.1038/nrn700. [DOI] [PubMed] [Google Scholar]
- Sampson VL, Morrison JH, Vickers JC. The cellular basis for the relative resistance of parvalbumin and calretinin immunoreactive neocortical neurons to the pathology of Alzheimer’s disease. Exp Neurol. 1997;145(1):295–302. doi: 10.1006/exnr.1997.6433. [DOI] [PubMed] [Google Scholar]
- Satoh J, Tabira T, Sano M, Nakayama H, Tateishi J. Parvalbumin-immunoreactive neurons in the human central nervous system are decreased in Alzheimer’s disease. Acta Neuropathol. 1991;81(4):388–395. doi: 10.1007/BF00293459. [DOI] [PubMed] [Google Scholar]
- Schmitz C. Variation of fractionator estimates and its prediction. Anat Embryol (Berl) 1998;198(5):371–397. doi: 10.1007/s004290050191. [DOI] [PubMed] [Google Scholar]
- Schmitz C, Hof PR. Design-based stereology in neuroscience. Neuroscience. 2005;130(4):813–831. doi: 10.1016/j.neuroscience.2004.08.050. [DOI] [PubMed] [Google Scholar]
- Schmitz C, Rutten BP, Pielen A, Schafer S, Wirths O, Tremp G, Czech C, Blanchard V, Multhaup G, Rezaie P, Korr H, Steinbusch HW, Pradier L, Bayer TA. Hippocampal neuron loss exceeds amyloid plaque load in a transgenic mouse model of Alzheimer’s disease. Am J Pathol. 2004;164(4):1495–1502. doi: 10.1016/S0002-9440(10)63235-X. [DOI] [PMC free article] [PubMed] [Google Scholar]
- Selkoe DJ. Alzheimer’s disease: genes, proteins, and therapy. Physiol Rev. 2001;81(2):741–766. doi: 10.1152/physrev.2001.81.2.741. [DOI] [PubMed] [Google Scholar]
- Solodkin A, Veldhuizen SD, Van Hoesen GW. Contingent vulnerability of entorhinal parvalbumin-containing neurons in Alzheimer’s disease. J Neurosci. 1996;16(10):3311–3321. doi: 10.1523/JNEUROSCI.16-10-03311.1996. [DOI] [PMC free article] [PubMed] [Google Scholar]
- Takahashi H, Brasnjevic I, Rutten BP, Van Der Kolk N, Perl DP, Bouras C, Steinbusch HW, Schmitz C, Hof PR, Dickstein DL. Hippocampal interneuron loss in an APP/PS1 double mutant mouse and in Alzheimer’s disease. Brain Struct Funct. 2010;214(2–3):145–160. doi: 10.1007/s00429-010-0242-4. [DOI] [PMC free article] [PubMed] [Google Scholar]
- Tanzi RE, Bertram L. Twenty years of the Alzheimer’s disease amyloid hypothesis: a genetic perspective. Cell. 2005;120(4):545–555. doi: 10.1016/j.cell.2005.02.008. [DOI] [PubMed] [Google Scholar]
- Thompson A, Boekhoorn K, Van Dam AM, Lucassen PJ. Changes in adult neurogenesis in neurodegenerative diseases: cause or consequence? Genes Brain Behav. 2008;7(Suppl 1):28–42. doi: 10.1111/j.1601-183X.2007.00379.x. [DOI] [PubMed] [Google Scholar]
- Trotti D, Danbolt NC, Volterra A. Glutamate transporters are oxidant-vulnerable: a molecular link between oxidative and excitotoxic neurodegeneration? Trends Pharmacol Sci. 1998;19(8):328–334. doi: 10.1016/S0165-6147(98)01230-9. [DOI] [PubMed] [Google Scholar]
- Wirths O, Bethge T, Marcello A, Harmeier A, Jawhar S, Lucassen PJ, Multhaup G, Brody DL, Esparza T, Ingelsson M, Kalimo H, Lannfelt L, Bayer TA. Pyroglutamate Abeta pathology in APP/PS1KI mice, sporadic and familial Alzheimer’s disease cases. J Neural Transm. 2010;117(1):85–96. doi: 10.1007/s00702-009-0314-x. [DOI] [PMC free article] [PubMed] [Google Scholar]
- Wirths O, Multhaup G, Czech C, Blanchard V, Moussaoui S, Tremp G, Pradier L, Beyreuther K, Bayer TA. Intraneuronal Abeta accumulation precedes plaque formation in beta-amyloid precursor protein and presenilin-1 double-transgenic mice. Neurosci Lett. 2001;306(1–2):116–120. doi: 10.1016/S0304-3940(01)01876-6. [DOI] [PubMed] [Google Scholar]
- Yankner BA, Duffy LK, Kirschner DA. Neurotrophic and neurotoxic effects of amyloid beta protein: reversal by tachykinin neuropeptides. Science. 1990;250(4978):279–282. doi: 10.1126/science.2218531. [DOI] [PubMed] [Google Scholar]