

Abstract
We describe a syndrome of primary microcephaly with simplified gyral pattern in combination with severe infantile epileptic encephalopathy and early-onset permanent diabetes in two unrelated consanguineous families with at least three affected children. Linkage analysis revealed a region on chromosome 18 with a significant LOD score of 4.3. In this area, two homozygous nonconserved missense mutations in immediate early response 3 interacting protein 1 (IER3IP1) were found in patients from both families. IER3IP1 is highly expressed in the fetal brain cortex and fetal pancreas and is thought to be involved in endoplasmic reticulum stress response. We reported one of these families previously in a paper on Wolcott-Rallison syndrome (WRS). WRS is characterized by increased apoptotic cell death as part of an uncontrolled unfolded protein response. Increased apoptosis has been shown to be a cause of microcephaly in animal models. An autopsy specimen from one patient showed increased apoptosis in the cerebral cortex and pancreas beta cells, implicating premature cell death as the pathogenetic mechanism. Both patient fibroblasts and control fibroblasts treated with siRNA specific for IER3IP1 showed an increased susceptibility to apoptotic cell death under stress conditions in comparison to controls. This directly implicates IER3IP1 in the regulation of cell survival. Identification of IER3IP1 mutations sheds light on the mechanisms of brain development and on the pathogenesis of infantile epilepsy and early-onset permanent diabetes.
Introduction
Microcephaly is defined as small brain size detected by a head circumference more than 2.5 standard deviations (SD) below the mean for age and sex. Microcephaly can be either primary, i.e., congenital and present at birth, or progressive, i.e., caused by a decrease of the head circumference growth rate, which was normal until birth. The incidence of primary microcephaly ranges from 1 in 10,000 (consanguineous population) to 1 in 30,000 (nonconsanguineous population).1 Primary microcephaly is considered to be caused by a brain developmental defect, and at present, the most widely accepted classification of primary microcephaly is Barkovich's et al. classification, which is based on brain MRI imaging and genetic knowledge.2 The classification includes microcephaly with a normal or a simplified cortex (MSG [MIM 603802]), with a thickened cortex (microlissencephaly, presumed to result from a neuronal migration disorder), or with polymicrogyria (presumed to be caused by a defect of cortical organization) and other structural malformations. MSG is presumed to be derived from abnormal neuronal and glial proliferation or apoptosis.1 Mutations in at least seven genes (ASPM [MIM 605481], MCPH1 [MIM 607117], CDK5RAP2 [MIM 608201] , CEP152 [MIM 613529], CENPJ [MIM 609279], WDR62 [MIM 613583] and STIL [MIM 181590])3 have been found that are causative for congenital primary microcephaly with normal or simplified gyration, which is broadly indicated as “higher functioning,” isolated microcephaly. These patients have near-normal motor development with speech delay and moderately compromised cognition. In a recent review, microcephaly with simplified gyral pattern represented the largest group of patients with primary microcephaly, and almost all of these had near-normal function, with only mildly delayed milestones, and none had epilepsy.4
In contrast, primary microcephaly also occurs in syndromes with additional features. In such cases, patients have a poorer neurological function, with severe cognitive and motor impairment and epilepsy as common symptoms. For this group of patients, mutations in at least four genes (SLC25A19 [MIM 606521],2 ATR [MIM 609215],3 ARFGEF2 [MIM 605371],5 RAB3GAP1 [MIM 602536]5) have been identified.
Darvish et al. recently reviewed genetic causes of microcephaly in 112 Iranian families and came to the conclusion that the genetic cause is even more heterogeneous than previously thought.6
A common function of many known microcephaly genes (both isolated and with additional features) includes a role in microtubule and centrosomal organization, regulating mitosis, which is postulated to occur via a disruption in the balance of symmetrical and asymmetrical division of neural progenitors in the proliferative layer of the developing cortex; i.e., the ventricular and subventricular zone. This is dependent on correct centrosome and microtubule orientation to achieve the correct cleavage plane.7
Despite this common theme, studies in animal models have shown that abnormal control of apoptosis can also be a pathogenic mechanism; therefore, it has been proposed as a cause of human MSG but has thus far not been demonstrated in patients.2 Apoptosis is an important regulatory mechanism of brain development, specifically related to the size of the forebrain.8 Apoptosis is under complex control, which results in activation of the caspase cascade and ultimately cell death.
The assumption that regulation of apoptosis is necessary for normal brain development has been demonstrated in Mos+/− mice haploinsufficient for Magoh, the exon junction complex component, which controls brain size by regulating neural stem cell division. Mutant mice show a microcephaly due to both an increase in neuronal apoptosis and a depletion of the intermediate neuron progenitor population.9 Additionally, mice deficient in the RhoGTPase Rac1 produce a phenotype similar to primary microcephaly and also demonstrate an increase in apoptosis in the forebrain.10
In contrast, a reduction of apoptosis leads to increased brain size in caspase 9 knockout mice.11 This further supports the hypothesis that a specific level of apoptosis is needed for normal brain development.
In some human disorders, deletion or duplications at the same locus can alternatively cause either micro- or macrocephaly, demonstrating a dosage effect and suggesting a primary regulation of brain size, hence of neural proliferation, at that same locus.12
In some cases apoptosis is a response to stress conditions; for example, if an excess of unfolded proteins accumulate in the endoplasmic reticulum (ER stress). In such cases a cascade of events, collectively called an unfolded protein response (UPR), provides suppression of protein translation. If this UPR mechanism fails, apoptotic cascades are triggered, leading to cell death.13
Infantile-onset permanent diabetes (permanent neonatal diabetes, PND [MIM 606176]) has an incidence of approximately 1/260 000.14 Unlike juvenile- and adult-onset diabetes, it is not found to have an autoimmune cause. Instead, the main mechanism is inappropriate apoptosis of Langerhans beta-islet cells, which are unable to cope with ER stress. This has been described in Wolcott-Rallison Syndrome (WRS [MIM 22980]), the most common cause of PND in patients with consanguineous parents, which is caused by a mutation in the eukaryotic translation initiation factor 2-alpha kinase 3 gene, EIF2AK3.15 Patients exhibit a combination of PND associated with multiple epiphyseal dysplasia and variable additional clinical features, including psychomotor retardation, hepatic dysfunction, and MSG.16
We have ascertained three patients from two consanguineous families with a striking overlapping phenotype. The affected children presented at an early age with the combination of MSG on MRI as well as infantile epileptic encephalopathy and infantile diabetes, resembling WRS, and EIF2AK3 mutations had been excluded. We have previously described one of these patients as representing a phenocopy of WRS, with unknown cause.16 We then performed linkage analysis and identified overlapping areas of homozygosity by genomic SNP array analysis of the index patients. We hypothesized that these patients are suffering from a distinct genetic, presumably autosomal-recessive, syndrome, and the results in this paper confirm this hypothesis.
Material and Methods
Patient Material and Study Approval
All the family members and patient caretakers provided written informed consent for participation in the study, and the genetic analysis was approved by the Erasmus Medical Centre research ethics committee.
Pathology Study
A complete autopsy was performed by M.J. on the male sibling of patient 2 (index patient 3, individual II:3 in Figure 1A, lower pedigree) shortly after his death at 26 months. The material was fixed in 10% formalin, and samples were analyzed on 5-μm-thick hematoxylin and eosin-stained sections of paraffin-embedded tissue. Immunohistochemistry for insulin was used in the pancreatic histological sections.
Figure 1.
Family Pedigrees and Linkage Data
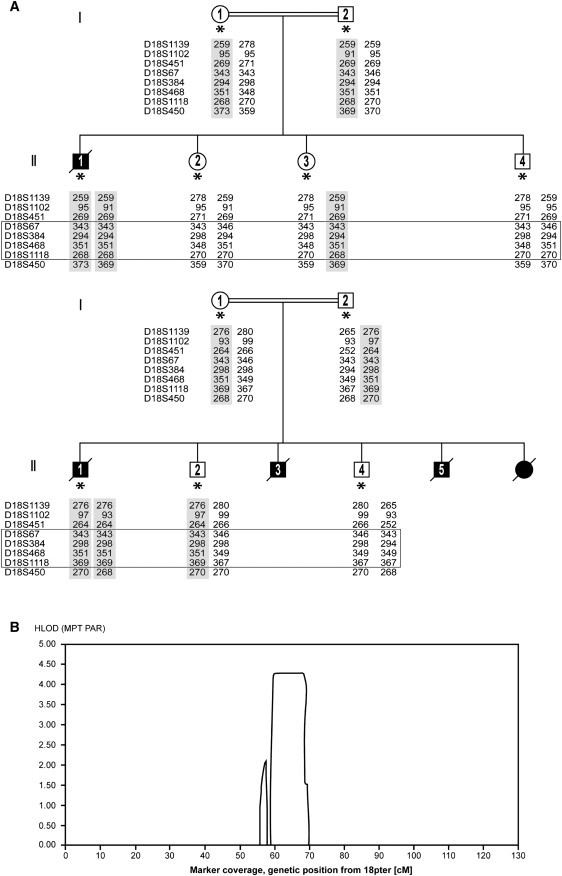
(A) Simplified genealogical trees of two unrelated families with MSG, epilepsy, and PND. Filled symbols represent affected patients. A double line represents consanguinity. An asterisk represents subjects analyzed by SNP arrays and included in the linkage analysis. The results of microsatellite marker analysis confirming homozygosity are also shown. The shaded areas represent the alleles containing the mutation, and the box represents the area found by linkage analysis.
(B) Output from easyLINKAGE showing an HLOD score of 4.3 for the region on chromosome 18q.
The brain was fixed in 10% buffered-formalin and sectioned. Samples from frontal, parietal, temporal, and occipital lobes; deep nuclei; cerebellum; brain stem; and spinal cord were submitted for histological evaluation. This was performed on 5-μm-thick hematoxylin and eosin-stained sections of paraffin-embedded brain tissue. Myelin stain (Luxol Fast Blue) was also used.
SNP Array, Homozygosity Mapping, and Linkage Analysis
DNA samples from the index patients, parents, and unaffected siblings were hybridized to the arrays according to the Affymetrix standard protocol for the GeneChip Mapping 250K NspI Array. Genotype data analysis was performed with Affymetrix GeneChip Genotyping analysis software (GTYPE) using the BRLMM algorithm. The obtained .CEL and .CHP files were used for homozygosity mapping in CNAG version 3.017,18 and linkage analysis with Allegro in easyLINKAGE v2.1.19
Sequencing Analysis
Amplification reactions were performed in a total volume of 20 μl, containing 1× PCR buffer with Mg (Roche), 200 μM of each dNTP, 1 μM forward primer, 1 μM reverse primer, 0.1 units Fast Start Taq DNA polymerase (Roche), and 25 ng genomic DNA. PCR conditions were as follows: 5′ 96°C, 10 cycles of 30″ 96°C, 30″ 68°C (−1°C/cycle), 60″ 72°C, followed by 25 cycles of 30″ 96°C, 30″ 58°C, 60″ 72°C, and a final extension for 5′ 72°C.
PCR reactions were purified with ExoSAP-IT (USB). Direct sequencing of both strands was performed with Big Dye Terminator chemistry (version 3.1; Applied Biosystems). DNA fragment analysis was performed with capillary electrophoresis on an ABI 3130 Genetic Analyzer (Applied Biosystems) with the software package Seqscape (Applied Biosystems, version 2.1).
Microsatelite Markers Analysis
Amplification reactions were performed in a total volume of 20 μl, containing 1× PCR buffer with Mg (Roche), 200 μM of each dNTP, 1 μM forward primer, 1 μM reverse primer, 0.1 units Fast Start Taq DNA polymerase (Roche), and 25 ng genomic DNA. PCR conditions were as follows: 5′ 96°C, 35 cycles of 30″ 96°C, 30″ 58°C, 60″ 72°C, and a final extension for 5′ 72°C.
PCR products were diluted and pooled in panels and loaded on an ABI 3130 genetic analyzer with LIZ 500 Size Standard (Applied Biosystems) in formamide. Data were analyzed with Gene Mapper version 2.1 software (Applied Biosystems).
Cell Culture and Apoptosis
Fibroblast Culture, RNA Isolation, cDNA Synthesis
Fibroblasts, obtained from the certified Cell Repository of the department of Clinical Genetics, ErasmusMC, were routinely tested for mycoplasma and were cultured in 175 cm2 culture flasks in Dulbecco's modified Eagle medium (DMEM, Lonza Biowhittaker) until 80% confluence. Total RNA was extracted with Trizol reagent (GIBCO BRL Life Technologies,) and purified with QIAGEN RNeasy mini columns (QIAGEN) according to the manufacturers' protocols.
Reverse transcriptase was performed on 1 μg RNA in a total volume of 20 μl with the use of the iScript cDNA Synthesis Kit (BioRad) according to the manufacturer's instructions.
Apoptosis Studies
Susceptibility-to-apoptosis studies were performed with the use of cultured skin fibroblasts from the index patient of family 1, a patient with confirmed Wolcott-Rallison syndrome bearing an EIF2AK3 mutation,15 and five healthy control cell lines. Susceptibility to apoptosis of cultured skin fibroblasts was measured by fluorescent staining of active caspases with the use of the Flica (Fluorescent-Labeled Inhibitor of Caspases) Apoptosis Multi-Caspase Detection Kit (Immunochemistry Technologies), which makes use of an inhibitor sequence of active caspases, according to the manufacturer's instructions. Fluorescent cells were scored by two blinded investigators before and after stress induction by 24 hr serum deprivation, then an additional 24 hr exposure to 5 mM dithiothreitol (DTT), as a percentage of apoptotic fibroblasts. The experiment was repeated three times, each time performed in triplicate. Necrosis versus apoptosis was tested by vital staining exclusion with propidium iodide.
Silencing Experiments: RNA Interference
Predesigned siRNA pools targeting human IER3IP1 (L-018948-01) (MIM 609382) and nontarget control pools (D-001810-10-20) were purchased from Dharmacon and used to knock down IER3IP1 in fibroblasts. siRNA was delivered to the fibroblasts via silentFECT Lipid Reagent (BioRad).
Silencing was confirmed at 24, 48, and 72 hr by RT-qPCR (primers listed in Table S2 available online). Apoptosis was induced after 24 hr of serum deprivation, followed by the addition of 1.25 mM DTT for 24 hr; apoptosis was detected and percentages calculated with the use of the Flica Apoptosis Detection Kit as described above.
Quantitative PCR
RT-qPCR was carried out using a KAPA SYBRH FAST qPCR Kit (Kapa Biosystems) in the CFX96 Real-Time system (BioRad). Thermal cycling conditions were as follows: a denaturing step (95°C for 3 min), followed by 35 cycles of denaturing (95°C for 5”), annealing, and extension (60°C for 30”). Fluorescence detection and data analysis were performed by BioRad CFX Manager 2.0. Experiments were performed in triplicate with the use of UBE2D2 (Entrez GeneID 7322 [MIM 602962]) as a reference for gene expression normalization.20
Induction by TNF-α
Fibroblasts were cultured as described above to 80% confluency. To study the induction of IER3 (MIM 602996) and IER3IP1 expression by TNF-α, the cultures were exposed to two different conditions. The first was standard culture medium (no induction with TNF-α); the second was induction with 10 ng/ml TNF-α for 3 hr. After induction, RNA was isolated with the Trizol LS protocol and RT-qPCR was performed for IER3 and IER3IP1 (primers listed in Table S2).
Results
Patient Description
Family 1
The index patient 1 (individual II:1 in Figure 1A, upper panel) was a male infant born to consanguineous parents (fifth-degree relatives; second cousins) of Moroccan origin (Figure 1A, top panel). The parents also have two healthy daughters and a healthy son. The patient was born after a normal pregnancy, and at birth his head circumference measured 2.5 SD below the mean. At 2 months of age he presented with microcephaly greater than 3 SD below the mean, developmental delay, hypotonia, epilepsy, obesity, presumed hypogonadism, and infantile diabetes. At 2 months of age, the seizures were a combination of focal seizures with secondary generalization and generalized seizures. Electroencephalographs (EEG) showed high-voltage asymmetric multifocal activity with abnormal background progressing into burst suppression on sleep EEG at 4 months and hypsarrythmia at 7 months. The MRI showed a simplified gyral pattern of the cerebral cortex and delayed myelination, but no overt cerebellar abnormality (Figures 2A–2C). Additional metabolic and infection screening, including a muscle biopsy, was negative. ARX sequencing was normal. The diabetes and epilepsy were difficult to control despite treatment with clonazepam, vigabatrin, and sodium valproate. Patient 1 died at the age of 18 months of a lower respiratory tract infection complicated by therapy-resistant epilepsy and diabetes. A postmortem exam was declined by the family. His clinical history has been reported by de Wit et al.16
Figure 2.
Patient Brain MRIs
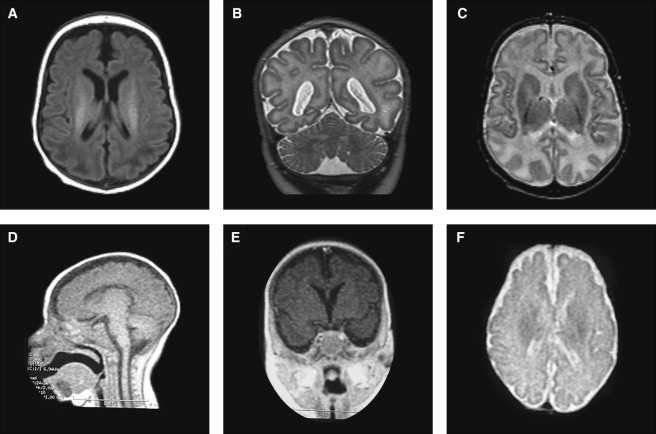
(A–C) MRIs from patient 1 performed at 1 year of age. (A) T1-weighted image showing a simplified gyral pattern and increased intracranial space with near-normal ventricular size. (B and C) T2-weighted coronal and axial view showing equal involvement of parietal lobes, normal cerebellum, and basal ganglia with delayed myelination.
(D–F) Low-resolution MRIs from patient 2 at approximately 7 months of age. (D) Sagittal T1-weighted view showing a thin but present corpus callosum and normal brain stem. (E) T1-weighted coronal view through the hippocampus showing simplified gyration and hippocampal hypoplasia. (F) T2- weighted view, demonstrating the simplified gyral pattern and normal ventricular size.
Family 2
Index patient 2 (individual II:1 in Figure 1A, lower panel) was the fourth affected child (there were also two similarly affected sons and one affected daughter) from a presumedly consanguineous family in Argentina (Figure 1A, lower panel). He was born at term gestation after a normal pregnancy. Infantile diabetes and microcephaly, with a brain size greater then 3 SD below the mean, were noted at birth. MRI performed at 2 months showed microcephaly with a simplified gyral pattern (Figure 2). The seizures were generalized tonic-clonic and myoclonic in type. One EEG was performed at 2 years of age, which showed hypsarrythmia. After multiple hospital admissions with seizures and poor diabetic control, patient 2 died at 27 months from a lower respiratory tract infection complicated by epilepsy and diabetes. In the family, three more siblings died of a similar disorder (reported as West syndrome and infantile diabetes), but medical records are not available.
Pathology Findings
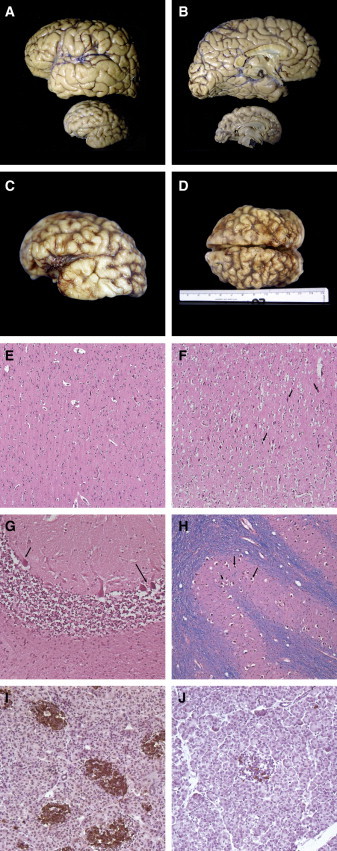
Postmortem macroscopic examination (performed after his death at 26 months) of one similarly affected brother of patient 2 from the Argentinian family (index patient 3, individual II:3 in Figure 1A, lower panel) confirmed extreme microcephaly (weight 175 g) in comparison to an age-matched control (970 g) and a simplified gyral pattern throughout the cortex, with the temporal tips and interhemisperic parietal lobes showing extreme simplification (Figures 3A–3D). The cerebellum, although relatively large compared to the cortex, was also small (weight: 59 g; age-matched control weight: 125 g). Microscopy revealed a reduced number of neurons in the brain cortex, mainly of layers 1 and 4; hypomyelination; and remarkable apoptosis. Many picnotic dead cells were also observed in the inferior olivary nucleus and in the cerebellum, and the pancreas showed few and small islets with few insulin-positive beta cells (Figures 3E–3G).
Figure 3.
Brain Macroscopy and Histopathology
(A and B) Macroscopic view in real proportions of normal age-matched brain (upper specimen) compared with index patient 3 postmortem brain (lower specimen); note the extreme microcephaly and simplified gyration looking almost lissencephalic in its medial surface.
(C and D) Macroscopic photographs of patient 3 brain, showing shallow and insufficient-in-number sulci over the whole brain surface, but more apparent in the temporal and parietal lobes. Note that photos in (C) and (D) are not in scale with those in (A) and (B).
(E–J) Histopathology. (E) Histopathology of normal cerebral frontal cortex (age-matched to patient 3). (F) Patient 3 histopathology of the cerebral cortex showing numerous apoptotic neurons (arrows) and some apoptotic glial cells (H&E × 20). (G) Cerebellar folia: Purkinje neurons are apoptotic (arrows) and internal granule cell layer is diminished (H&E × 20). (H) Nearly all neurons and the inferior olivary nuclei are apoptotic. (I and J) Patient 3 pancreas stained for insulin (J), showing depletion of insulin-producing islet cells in comparison to a normal pancreas (I).
Molecular Analysis
The 250K SNP array data from the index patients (probands), unaffected siblings, and parents were analyzed for loss of heterozygosity (LOH) regions with the use of CNAG, and the pedigrees were subsequently used in easyLINKAGE.19 In both families, multiple areas of apparent LOH larger than 1 Mb were observed in the probands, suggesting homozygosity, which is compatible with the reported consanguinity. We observed one LOH region on chromosome 18 overlapping between patients from the two families. We then performed a linkage analysis on the SNP array data and found a significant LOD score of 4.3 linked to the same region on chromosome 18q, spanning a 10 Mb region and containing 43 genes (NCBI build 36.3). The region was confirmed as homozygous in the affected individuals and heterozygous in the unaffected siblings by microsatellite markers (Figure 1A and Figure S1).
The genes in the linkage area were prioritized for sequencing with the use of available expression data from the GEO profile. In total, 12 genes were found to be expressed in both the brain and the pancreas, and these were all sequenced (Table S1). In both affected individuals from the two pedigrees, a homozygous variation in the immediate early response-3 interacting protein-1 (IER3IP1) was found. In index patient 1, a homozygous missense change, c.62T>G (NM_016097.3), was found in exon 1, causing a change in amino acid at position 21 from valine to glycine (p.Val21Gly). In index patient 2, a homozygous missense change, c.233T>C, was found in exon 3. This causes a change in amino acid at position 78 from leucine to proline (p.Leu78Pro) (Figure 4A). The parents in both families were confirmed to be heterozygous for the changes, whereas the nonaffected siblings were confirmed to be heterozygous or had no changes. Unfortunately, no DNA of index patient 3 was available. Neither of these changes were annotated in dbSNP 132 or the 1000 Genome database, nor were they found in 300 ethnically matched control chromosomes, indicating in each case an allele frequency lower than 0.3%.
Figure 4.
IER3IP1 Sequence and Expression in Developing Brain
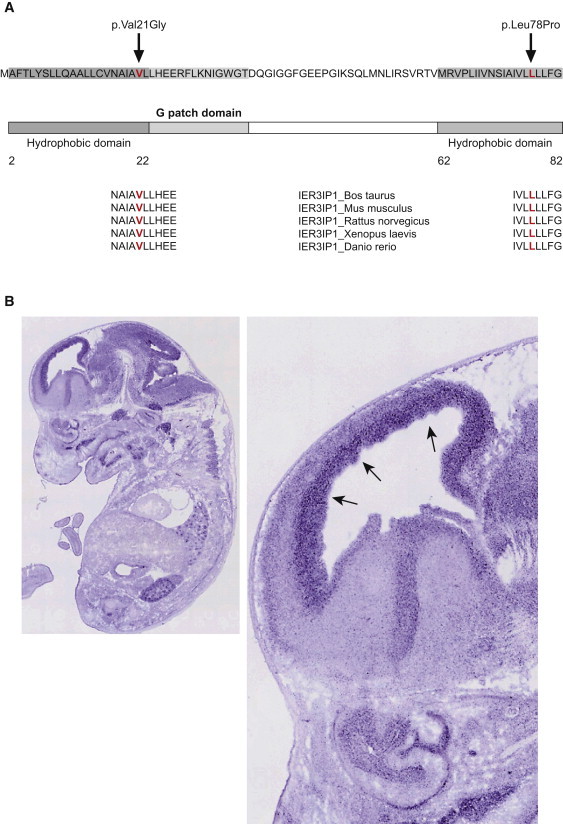
(A) Schematic representation of human IER3IP1 showing the sequence, the predicted protein domains, and the location of the p.Val21Gly and p.Leu78Pro mutations. Cross-species conservation of IER3IP1 in the areas of the mutations is shown at the bottom of the diagram. Both of the predicted amino acid changes are in a highly conserved area of the gene and in the hydrophobic/transmembrane domains, and they are depicted in red.
(B) Expression of Ier3ip1 at E14.5 days in the whole-mouse embryo (left); zoomed in, in the right panel is the mouse brain, with arrows pointing to increased expression in the ventricular and subventricular zone at the site of neurogenesis.24
No change predicted to be pathogenic was observed in any of the other genes in the linkage area in the affected subjects.
In Silico IER3IP1 Function Prediction and Mutation Effect
IER3IP1 encodes a small polypeptide protein of about 10 kDa.21 Protein-localization studies of IER3IP1 and the yeast homolog Yos1p localize the protein to the ER and Golgi and suggest its involvement in the control of COP-II vesicle budding21,22. The protein sequence predicts one N-terminal hydrophobic domain possibly including a signal peptide sequence,23 a hydrophilic glycine-rich domain (G-patch), putatively interacting with RNA, and a C-terminal second hydrophobic transmembrane domain (Figure 4A). The Signal P 3.0 server23 predicts a hydrophobic domain, including a signal peptide that is required for targeting the peptide to the ER. The p.Val21Gly change is located in this first domain and introduces a new glycine just before the G-patch. Signal P 3.0 suggests that this mutation is very close to a putative peptide cleavage site, possibly interfering with the cleavage of the signal sequence.23 Preliminary data show that IER3IP1 is undetectable in fibroblasts from patient 1 (Figure S5). The p.Leu78Pro change is located in the second transmembrane domain. Through the use of Project HOPE and tools for predictions of amino acid changes on protein structure, both mutations are predicted to cause a change in protein structure and to be within a hydrophobic/transmembrane domain.24,25 The p.Leu78Pro change is predicted to be within an alpha helix and to have severe effects on the structure of the protein (Figure S4).24,25 In silico analysis of the p.Val21Gly change by the Grantham Matrix Score,26 Polyphen-2,27 SIFT,28 SNAP,29 and Pmut30 programs predicted a pathogenic/nonneutral effect (see Table S3). The p.Leu78Pro change was predicted to be pathogenic/nonneutral by the Grantham Matrix Score,26 Polyphen-2,27 SNAP,29 and Pmut30 programs (see Table S3). Both mutations are in a highly conserved area among vertebrates (Figure 4A). Although very little has been published about IER3IP1, a search in several in silico expression databases (GEO Profiles, GenePaint, Allen Brain Altlas, MGI, EMBL-EBI) brought additional information about its putative function. The mouse ortholog Ier3ip1 shows a high level of expression during early gestation (embryonic day 9.5 [E9.5] and E11.5, compared to E13.5), which corresponds to the period of proliferation of neural progenitors. In the developing mouse at E14.5, there is high expression of Ier3ip1 in the cortex in the ventricular/subventricular zone at the site of neurogenesis31 (Figure 4B).
Expression in the embryonic pancreas peaks at E12.5 and lowers at E13.5 and E14.5 (GEO Profiles, GenePaint). There also appears to be expression in the lungs and the kidneys. The IER3IP1 mRNA is putatively translated into the endoplasmic reticulum, suggesting that it functions as a membrane-bound protein (EMBL-EBI database). In the adult mouse brain, its expression is low and essentially limited to the cerebellum, hippocampal area, midbrain, and thalamus, with low, albeit detectable, expression in the cortex (Allen Brain Atlas). There is also additional evidence that IER3IP1 is downregulated by miR-34a.32 Once transactivated by p53, this miRNA is known to promote apoptosis.32 These data suggest a putative function for IER3IP1 in protecting neural progenitors in the proliferative zone of the embryonic forebrain from apoptosis.
In Vitro Apoptosis Tests
As a next step, we tested the general tendency of cultured fibroblasts to undergo apoptosis through the use of a test for active caspases after induction of stress by dithiothreitol.33
Fibroblasts from index patient 1 with an IER3IP1 mutation showed a significantly increased tendency to undergo apoptosis after treatment with DTT in comparison to control cells (p ≤ 0.001, unpaired t test, SPSS version 17.0) (Figure 5A). The rate of apoptosis was similar to that of the cells of a patient with confirmed Wolcott-Rallison syndrome.16 However, considering that the p.Val21Gly missense mutation could synthesize an abnormal protein, increased apoptosis could be the result of putative ER stress induced by a less-functional IER3IP1 protein accumulating in the ER and not linked to a specific function of IER3IP1 in protecting the cells from apoptosis. We therefore tested the susceptibility to stress induced by DTT after silencing of IER3IP1 in control fibroblasts by specific siRNA. RT-qPCR of the IER3IP1 transcript showed efficient downregulation; i.e., diminished predicted IER3IP1 synthesis (Figure 5B, left panel) In cells in which IER3IP1 had been knocked down, a significant increase (p ≤ 0.001, unpaired t test, SPSS version 17.0) in apoptosis was observed after stress induced by 1.25 mM DTT, in comparison to the same cell line treated with control siRNA (Figure 5B, right panel). The DTT concentration in these experiments was lower because the siRNA treatment made cells more susceptible to apoptosis (also seen in control experiments). No difference in the level of apoptosis was observed in the absence of stress or when the cells were only exposed to serum deprivation (data not shown).
Figure 5.
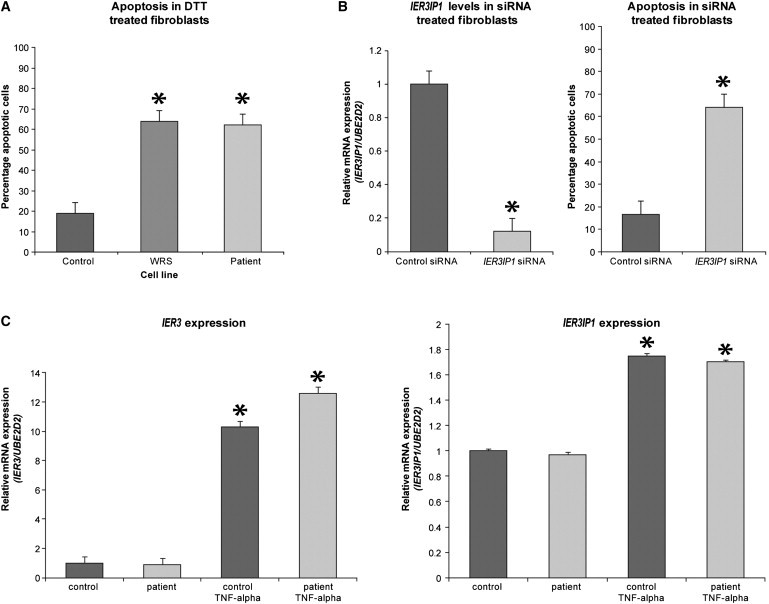
Susceptibility of Cultured Fibroblasts to Apoptosis and TNF-α Stimulation
(A) Patient cells are more susceptible to apoptosis, similar to cells from a known WRS patient, when treated with 5 mM DTT, in comparison to five control cell lines (p ≤ 0.001, unpaired t test, SPSS version 17.0). Values represent a mean of three experiments ± SEM.
(B) IER3IP1 expression levels in control fibroblasts are decreased approximately 10-fold after the addition of IER3IP1 siRNA, as compared to control siRNA (p ≤ 0.001, unpaired t test, SPSS version 17.0) (left panel). Control fibroblasts treated with IER3IP1 siRNA also demonstrate a significantly increased susceptibility to apoptosis (p ≤ 0.001, unpaired t test, SPSS version 17.0) when treated with 1.25 mM DTT in comparison to control fibroblasts (right panel). Values represent a mean of three experiments ± SEM.
(C) IER3 mRNA levels are increased approximately 10-fold in patient and control cells after the addition of TNF-α (left panel) (p < 0.0001, unpaired t test, SPSS version 17.0). IER3IP1 levels are increased approximately 1.5-fold in patient and control fibroblast cell lines after the addition of TNF-α (p < 0.001, unpaired t test, SPSS version 17.0) (right panel). Stars represent a significant p < 0.01 difference.
These results demonstrate that IER3IP1 is needed in vitro to protect cells from the consequences of stress induced by denaturing agents such as DTT.
TNF-α Experiments
In the gene annotation databases, IER3IP1 is considered as a putative interactor of IER3, early immediate response-3, regulating acute stress response and cell death through the TNF-α pathway,34 but any evidence for the human protein is lacking. In control fibroblasts, we found that expression of IER3 mRNA was approximately 10-fold higher after induction with TNF-α in comparison to standard culture conditions (p < 0.0001, unpaired t test, SPSS version 17.0) (Figure 5C). To test whether IER3 and IER3IP1 are similarly regulated, we looked at the expression of IER3IP1 after the addition of TNF-α. There was an approximate 1.5-fold increase in expression of IER3IP1 mRNA after induction with TNF-α in both index patient 1 and control fibroblasts (p < 0.001, unpaired t test, SPSS version 17.0), suggesting that IER3IP1 is under similar control as IER3 (Figure 5C).
Discussion
We have described a syndrome consisting of MSG, PND, severely apoptotic brain, and infantile epileptic encephalopathy, in patients from two separate families, associated with mutations in the IER3IP1.
Collectively, the linkage and IER3IP1 sequence data, together with the expression pattern during brain development and its involvement in regulation of apoptosis in vitro, indicate that the mutations observed in our patients are causally related to their disease.
The congenital microcephaly and insulin-dependent diabetes can be explained by the presence of abnormal levels of neuronal apoptosis in brain and pancreas specimens from the sibling of index patient 2. In this brain, there is additional evidence for insufficient myelination, which suggests either that early common progenitors of both neural and glia lineage are depleted or that maturation of the oligodendrocyte progenitors is blocked. Consistent with the hypothesis of progenitor depletion and block in maturation, the pattern of Ier3ip1 in the mouse brain at E14.5 shows selective expression at the proliferative ventricular and subventricular zone, where the common neuro-glial progenitors are located before differentiation into separate lineages. Although naturally occurring cell death represents a final pathogenic mechanism of many disorders, apoptosis is an essential and impressive feature of cortical brain development. During neurogenesis, about 70% of progenitor cells in the ventricular and subventricular zone undergo apoptosis, this number being similar to that of postmitotic cells, leading to the suggestion that apoptosis controls stem cell population.35 Abnormal increase of apoptosis in the patients with IER3IP1 mutation could be the result of either insufficient regulation of mitosis and differentiation of neural progenitors or insufficient protection from proapoptotic stimuli. Distinction between these two mechanisms might be particularly important for the identification of proapoptotic stimuli extrinsic to the cell metabolism, such as oxidative stress, which might be preventable.36 Fibroblasts from an individual with an IER3IP1 mutation show increased rates of apoptotic cell death when exposed to DTT. Additionally, silencing of IER3IP1 leads to an increase in the apoptosis rate in control fibroblasts after DTT treatment. On the one hand, these results link the effect of the mutation with the onset of apoptosis, but on the other hand, they suggest that IER3IP1 intervenes under “stress” stimuli. IER3IP1 is putatively involved in cell differentiation and cell death processes, under regulation of transcription factors TNF-α and Sp1.34 If IER3IP1 normally protects the cell from stimuli inducing apoptosis, the modest, albeit significant, response to TNF-α places human IER3IP1 in the “death receptors” cascade.37 IER3IP1 also has a reported role in ceramide apoptosis in neurons.38
IER3IP1 is a highly conserved protein that is found in humans, mice, zebrafish (Figure 4A), and yeast (homolog to Yos1p) and is highly expressed in the developing cortex and in the beta cells of the pancreas. IER3IP1 putatively interacts with IER3 and, on the basis of its sequence homology to the yeast protein Yos1p and preliminary experimental evidence, is an ER protein containing at least one transmembrane domain and mediating vesicular transport between Golgi and ER.33 However, it also contains a G-patched domain present in RNA-associated proteins.
IER3IP1 has a similarity in name to and may interact directly with IER3, although there is no available experimental evidence published to prove this. IER3 is a highly conserved protein consisting of 156 amino acids in humans and consists of a putative transmembrane domain and a nuclear localization site. IER3 is described as having both a pro- and an antiapoptotic role.39,40
An elevated expression of IER3 in hepatocytes and pancreatic tumor cell lines triggers apoptosis in response to various apoptotic stimuli. IER3 has also been reported to be part of the DNA damage-induced and p53-mediated apoptosis in rodent and human cells.40
Our experiments showing increased expression of IER3 and IER3IP1 after induction with TNF-α could provide clues that IER3IP1 regulates apoptosis via interaction with IER3, either through cooperation or through interference with IER3 function.
We therefore conclude that IER3IP1 is an important gene, involved in the development of microcephaly and diabetes via dysregulation of apoptosis.
The role of IER3IP1 in cortical development and pathogenesis of epilepsy and diabetes is obscure, but it seems essential from the early stages of development, such as the period of neural progenitor proliferation. It is unknown when diabetes begins in patients because there has been no way to test it prenatally, but the presence of microcephaly with simplified gyration indicates a crucial role already existing during gestation. Severe infantile epileptic encephalopathy is very unusual in primary microcephaly and has been reported only in patients with WDR62 mutations.41 In these patients, however, the structure of the cortex is deeply abnormal and shows both migration and organization defects, both high risk factors for epilepsy. The rare combination of primary microcephaly with severe infantile epilepsy has been observed in PNKP mutations.42 In this disorder, seizures and microcephaly are not related to degenerative changes, but to probable defects in DNA-repair mechanisms of nucleotide excision or single- or double-stranded breaks. Interestingly, mouse neuronal cells show increased apoptosis rates when PNKP is silenced by siRNA.
Apoptosis, or programmed cell death, is also the end point of the unfolded protein response. WRS, which shows phenotypic similarity to our patients' syndrome, is caused by a mutation in EIF2AK3, which encodes a kinase in the ER membrane, one of four that phosphorylates EIF2a (also known as Perk in mice), having an important role in the unfolded protein response.15 When a protein is misfolded, EIF2a is phosphorylated, resulting in lower levels of translation initiation of the protein and eventually prevention from apoptosis. This is proven by the Perk knockout mice, which have an increased rate of apoptosis and destruction of beta cells causing a phenotype similar to WRS in humans.43 It is interesting that both of the IER3IP1 mutations found are in the putative hydrophobic regions, which therefore seem to be very functionally relevant. It is possible that the role of IER3IP1 in protection from apoptosis is also played by regulating and/or preventing nascent protein (mis)folding in the ER membrane at the lumen and thus preventing activation of the UPR response. This and other questions might be addressed by future protein studies on subcellular localization and on identification of interacting partners. These studies will also be instrumental in the understanding of severe infantile epilepsy and infantile diabetes.
Acknowledgments
C.J.P was supported by a short-term EMBO fellowship, the International Pediatric Research Foundation (Young Investigator Exchange Program 2009), and the Leverhulme Trust Abroad Studentships. We thank F.G. Grosveld, at the Department of Cell Biology and A. Kremer at the Department of Bioinformatics, ErasmusMC, for useful discussions and support.
Supplemental Data
Web Resources
The URLs for data presented herein are as follows:
Allen Brain Atlas, http://www.brain-map.org/
easyLINKAGE, http://compbio.charite.de/genetik/hoffmann/easyLINKAGE/
EMBL_EBI, http://www.ebi.ac.uk/embl
Genepaint, http://www.genepaint.org
GEO Profiles, http://www.ncbi.nlm.nih.gov/geoprofiles
Online Mendelian Inheritance in Man (OMIM), http://www.omim.org
Polyphen2, http://genetics.bwh.harvard.edu/pph2/
SIFT, http://sift.jcvi.org/
Signal P 3.0 Server, http://www.cbs.dtu.dk/services/SignalP/
Uniprot, http://www.uniprot.org
References
- 1.Woods C.G., Bond J., Enard W. Autosomal recessive primary microcephaly (MCPH): a review of clinical, molecular, and evolutionary findings. Am. J. Hum. Genet. 2005;76:717–728. doi: 10.1086/429930. [DOI] [PMC free article] [PubMed] [Google Scholar]
- 2.Barkovich A.J., Kuzniecky R.I., Jackson G.D., Guerrini R., Dobyns W.B. A developmental and genetic classification for malformations of cortical development. Neurology. 2005;65:1873–1887. doi: 10.1212/01.wnl.0000183747.05269.2d. [DOI] [PubMed] [Google Scholar]
- 3.Kaindl A.M., Passemard S., Kumar P., Kraemer N., Issa L., Zwirner A., Gerard B., Verloes A., Mani S., Gressens P. Many roads lead to primary autosomal recessive microcephaly. Prog. Neurobiol. 2010;90:363–383. doi: 10.1016/j.pneurobio.2009.11.002. [DOI] [PubMed] [Google Scholar]
- 4.Basel-Vanagaite L., Dobyns W.B. Clinical and brain imaging heterogeneity of severe microcephaly. Pediatr. Neurol. 2010;43:7–16. doi: 10.1016/j.pediatrneurol.2010.02.015. [DOI] [PubMed] [Google Scholar]
- 5.Guerrini R., Dobyns W.B., Barkovich A.J. Abnormal development of the human cerebral cortex: genetics, functional consequences and treatment options. Trends Neurosci. 2008;31:154–162. doi: 10.1016/j.tins.2007.12.004. [DOI] [PubMed] [Google Scholar]
- 6.Darvish H., Esmaeeli-Nieh S., Monajemi G.B., Mohseni M., Ghasemi-Firouzabadi S., Abedini S.S., Bahman I., Jamali P., Azimi S., Mojahedi F. A clinical and molecular genetic study of 112 Iranian families with primary microcephaly. J. Med. Genet. 2010;47:823–828. doi: 10.1136/jmg.2009.076398. [DOI] [PubMed] [Google Scholar]
- 7.Nigg E.A., Raff J.W. Centrioles, centrosomes, and cilia in health and disease. Cell. 2009;139:663–678. doi: 10.1016/j.cell.2009.10.036. [DOI] [PubMed] [Google Scholar]
- 8.Haydar T.F., Kuan C.Y., Flavell R.A., Rakic P. The role of cell death in regulating the size and shape of the mammalian forebrain. Cereb. Cortex. 1999;9:621–626. doi: 10.1093/cercor/9.6.621. [DOI] [PubMed] [Google Scholar]
- 9.Silver D.L., Watkins-Chow D.E., Schreck K.C., Pierfelice T.J., Larson D.M., Burnetti A.J., Liaw H.J., Myung K., Walsh C.A., Gaiano N., Pavan W.J. The exon junction complex component Magoh controls brain size by regulating neural stem cell division. Nat. Neurosci. 2010;13:551–558. doi: 10.1038/nn.2527. [DOI] [PMC free article] [PubMed] [Google Scholar]
- 10.Sanno H., Shen X., Kuru N., Bormuth I., Bobsin K., Gardner H.A., Komljenovic D., Tarabykin V., Erzurumlu R.S., Tucker K.L. Control of postnatal apoptosis in the neocortex by RhoA-subfamily GTPases determines neuronal density. J. Neurosci. 2010;30:4221–4231. doi: 10.1523/JNEUROSCI.3318-09.2010. [DOI] [PMC free article] [PubMed] [Google Scholar]
- 11.Kuida K., Haydar T.F., Kuan C.Y., Gu Y., Taya C., Karasuyama H., Su M.S., Rakic P., Flavell R.A. Reduced apoptosis and cytochrome c-mediated caspase activation in mice lacking caspase 9. Cell. 1998;94:325–337. doi: 10.1016/s0092-8674(00)81476-2. [DOI] [PubMed] [Google Scholar]
- 12.Brunetti-Pierri N., Berg J.S., Scaglia F., Belmont J., Bacino C.A., Sahoo T., Lalani S.R., Graham B., Lee B., Shinawi M. Recurrent reciprocal 1q21.1 deletions and duplications associated with microcephaly or macrocephaly and developmental and behavioral abnormalities. Nat. Genet. 2008;40:1466–1471. doi: 10.1038/ng.279. [DOI] [PMC free article] [PubMed] [Google Scholar]
- 13.Merksamer P.I., Papa F.R. The UPR and cell fate at a glance. J. Cell Sci. 2010;123:1003–1006. doi: 10.1242/jcs.035832. [DOI] [PMC free article] [PubMed] [Google Scholar]
- 14.Slingerland A.S., Shields B.M., Flanagan S.E., Bruining G.J., Noordam K., Gach A., Mlynarski W., Malecki M.T., Hattersley A.T., Ellard S. Referral rates for diagnostic testing support an incidence of permanent neonatal diabetes in three European countries of at least 1 in 260,000 live births. Diabetologia. 2009;52:1683–1685. doi: 10.1007/s00125-009-1416-6. [DOI] [PMC free article] [PubMed] [Google Scholar]
- 15.Rubio-Cabezas O., Patch A.M., Minton J.A.L., Flanagan S.E., Edghill E.L., Hussain K., Balafrej A., Deeb A., Buchanan C.R., Jefferson I.G., Neonatal Diabetes International Collaborative Group Wolcott-Rallison syndrome is the most common genetic cause of permanent neonatal diabetes in consanguineous families. J. Clin. Endocrinol. Metab. 2009;94:4162–4170. doi: 10.1210/jc.2009-1137. [DOI] [PMC free article] [PubMed] [Google Scholar]
- 16.de Wit M.C.Y., de Coo I.F.M., Julier C., Delépine M., Lequin M.H., van de Laar I., Sibbles B.J., Bruining G.J., Mancini G.M. Microcephaly and simplified gyral pattern of the brain associated with early onset insulin-dependent diabetes mellitus. Neurogenetics. 2006;7:259–263. doi: 10.1007/s10048-006-0061-1. [DOI] [PubMed] [Google Scholar]
- 17.Nannya Y., Sanada M., Nakazaki K., Hosoya N., Wang L., Hangaishi A., Kurokawa M., Chiba S., Bailey D.K., Kennedy G.C., Ogawa S. A robust algorithm for copy number detection using high-density oligonucleotide single nucleotide polymorphism genotyping arrays. Cancer Res. 2005;65:6071–6079. doi: 10.1158/0008-5472.CAN-05-0465. [DOI] [PubMed] [Google Scholar]
- 18.Yamamoto G., Nannya Y., Kato M., Sanada M., Levine R.L., Kawamata N., Hangaishi A., Kurokawa M., Chiba S., Gilliland D.G. Highly sensitive method for genomewide detection of allelic composition in nonpaired, primary tumor specimens by use of affymetrix single-nucleotide-polymorphism genotyping microarrays. Am. J. Hum. Genet. 2007;81:114–126. doi: 10.1086/518809. [DOI] [PMC free article] [PubMed] [Google Scholar]
- 19.Hoffmann K., Lindner T.H. easyLINKAGE-Plus—automated linkage analyses using large-scale SNP data. Bioinformatics. 2005;21:3565–3567. doi: 10.1093/bioinformatics/bti571. [DOI] [PubMed] [Google Scholar]
- 20.Bustin S.A., Benes V., Garson J.A., Hellemans J., Huggett J., Kubista M., Mueller R., Nolan T., Pfaffl M.W., Shipley G.L. The MIQE guidelines: minimum information for publication of quantitative real-time PCR experiments. Clin. Chem. 2009;55:611–622. doi: 10.1373/clinchem.2008.112797. [DOI] [PubMed] [Google Scholar]
- 21.Yiu W.H., Poon J.W., Tsui S.K., Fung K.P., Waye M.M. Cloning and characterization of a novel endoplasmic reticulum localized G-batch protein domain protein, IER3IP1. Gene. 2004;377:37–44. doi: 10.1016/j.gene.2004.04.033. [DOI] [PubMed] [Google Scholar]
- 22.Heidtman M., Chen C.Z., Collins R.N., Barlowe C. Yos1p is a novel subunit of the Yip1p-Yif1p complex and is required for transport between the endoplasmic reticulum and the Golgi complex. Mol. Biol. Cell. 2005;16:1673–1683. doi: 10.1091/mbc.E04-10-0873. [DOI] [PMC free article] [PubMed] [Google Scholar]
- 23.Bendtsen J.D., Nielsen H., von Heijne G., Brunako S. Improved prediction of signal peptides: Signal P 3.0. J. Mol. Biol. 2004;34:783–795. doi: 10.1016/j.jmb.2004.05.028. [DOI] [PubMed] [Google Scholar]
- 24.Dunlavy D.M., O'Leary D.P., Klimov D., Thirumalai D. HOPE: a homotopy optimization method for protein structure prediction. J. Comput. Biol. 2005;12:1275–1288. doi: 10.1089/cmb.2005.12.1275. [DOI] [PubMed] [Google Scholar]
- 25.Venselaar H., Te Beek T.A., Kuipers R.K., Hekkelman M.L., Vriend G. Protein structure analysis of mutations causing inheritable diseases. An e-Science approach with life scientist friendly interfaces. BMC Bioinformatics. 2010;11:548. doi: 10.1186/1471-2105-11-548. [DOI] [PMC free article] [PubMed] [Google Scholar]
- 26.Grantham R. Amino acid difference formula to help explain protein evolution. Science. 1974;185:862–864. doi: 10.1126/science.185.4154.862. [DOI] [PubMed] [Google Scholar]
- 27.Adzhubei I.A., Schmidt S., Peshkin L., Ramensky V.E., Gerasimova A., Bork P., Kondrashov A.S., Sunyaev S.R. A method and server for predicting damaging missense mutations. Nat. Methods. 2010;7:248–249. doi: 10.1038/nmeth0410-248. [DOI] [PMC free article] [PubMed] [Google Scholar]
- 28.Ng P.C., Henikoff S. Predicting deleterious amino acid substitutions. Genome Res. 2001;11:863–874. doi: 10.1101/gr.176601. [DOI] [PMC free article] [PubMed] [Google Scholar]
- 29.Bromberg Y., Yachdav G., Rost B. SNAP predicts effect of mutations on protein function. Bioinformatics. 2008;24:2397–2398. doi: 10.1093/bioinformatics/btn435. [DOI] [PMC free article] [PubMed] [Google Scholar]
- 30.Ferrer-Costa C., Gelpí J.L., Zamakola L., Parraga I., de la Cruz X., Orozco M. PMUT: a web-based tool for the annotation of pathological mutations on proteins. Bioinformatics. 2005;21:3176–3178. doi: 10.1093/bioinformatics/bti486. [DOI] [PubMed] [Google Scholar]
- 31.Diez-Roux G., Banfi S., Sultan M., Geffers L., Anand S., Rozado D., Magen A., Canidio E., Pagani M., Peluso I. A high-resolution anatomical atlas of the transcriptome in the mouse embryo. PLoS Biol. 2011;9:e1000582. doi: 10.1371/journal.pbio.1000582. [DOI] [PMC free article] [PubMed] [Google Scholar]
- 32.Chang T.C., Wentzel E.A., Kent O.A., Ramachandran K., Mullendore M., Lee K.H., Feldmann G., Yamakuchi M., Ferlito M., Lowenstein C.J. Transactivation of miR-34a by p53 broadly influences gene expression and promotes apoptosis. Mol. Cell. 2007;26:745–752. doi: 10.1016/j.molcel.2007.05.010. [DOI] [PMC free article] [PubMed] [Google Scholar]
- 33.Boztug K., Appaswamy G., Ashikov A., Schäffer A.A., Salzer U., Diestelhorst J., Germeshausen M., Brandes G., Lee-Gossler J., Noyan F. A syndrome with congenital neutropenia and mutations in G6PC3. N. Engl. J. Med. 2009;360:32–43. doi: 10.1056/NEJMoa0805051. [DOI] [PMC free article] [PubMed] [Google Scholar]
- 34.Yiu W.H., Yeung T.L., Poon J.W.M., Tsui S.K.W., Fung K.P., Waye M.M.Y. Transcriptional regulation of IER3IP1 gene by tumor necrosis factor-alpha and Sp family proteins. Cell Biochem. Funct. 2010;28:31–37. doi: 10.1002/cbf.1613. [DOI] [PubMed] [Google Scholar]
- 35.Sanes D.H., Reh T.A., Harris W.A., editors. Development of the nervous system. Second Edition. Elsevier Academic Press; Oxford: 2006. pp. 173–206. [Google Scholar]
- 36.Kraft A.D., McPherson C.A., Harry G.J. Heterogeneity of microglia and TNF signaling as determinants for neuronal death or survival. Neurotoxicology. 2009;30:785–793. doi: 10.1016/j.neuro.2009.07.001. [DOI] [PMC free article] [PubMed] [Google Scholar]
- 37.Guicciardi M.E., Gores G.J. Life and death by death receptors. FASEB J. 2009;23:1625–1637. doi: 10.1096/fj.08-111005. [DOI] [PMC free article] [PubMed] [Google Scholar]
- 38.Decraene C., Brugg B., Ruberg M., Eveno E., Matingou C., Tahi F., Mariani J., Auffray C., Pietu G. Identification of genes involved in ceramide-dependent neuronal apoptosis using cDNA arrays. Genome Biol. 2002;3:H0042. doi: 10.1186/gb-2002-3-8-research0042. [DOI] [PMC free article] [PubMed] [Google Scholar]
- 39.Zhang Y., Schlossman S.F., Edwards R.A., Ou C.N., Gu J., Wu M.X. Impaired apoptosis, extended duration of immune responses, and a lupus-like autoimmune disease in IEX-1-transgenic mice. Proc. Natl. Acad. Sci. USA. 2002;99:878–883. doi: 10.1073/pnas.022326699. [DOI] [PMC free article] [PubMed] [Google Scholar]
- 40.Arlt A., Schäfer H. Role of the immediate early response 3 (IER3) gene in cellular stress response, inflammation and tumorigenesis. Eur. J. Cell Biol. 2011;90:545–552. doi: 10.1016/j.ejcb.2010.10.002. [DOI] [PubMed] [Google Scholar]
- 41.Yu T.W., Mochida G.H., Tischfield D.J., Sgaier S.K., Flores-Sarnat L., Sergi C.M., Topçu M., McDonald M.T., Barry B.J., Felie J.M. Mutations in WDR62, encoding a centrosome-associated protein, cause microcephaly with simplified gyri and abnormal cortical architecture. Nat. Genet. 2010;42:1015–1020. doi: 10.1038/ng.683. [DOI] [PMC free article] [PubMed] [Google Scholar]
- 42.Shen J., Gilmore E.C., Marshall C.A., Haddadin M., Reynolds J.J., Eyaid W., Bodell A., Barry B., Gleason D., Allen K. Mutations in PNKP cause microcephaly, seizures and defects in DNA repair. Nat. Genet. 2010;42:245–249. doi: 10.1038/ng.526. [DOI] [PMC free article] [PubMed] [Google Scholar]
- 43.Harding H.P., Zeng H., Zhang Y., Jungries R., Chung P., Plesken H., Sabatini D.D., Ron D. Diabetes mellitus and exocrine pancreatic dysfunction in perk-/- mice reveals a role for translational control in secretory cell survival. Mol. Cell. 2001;7:1153–1163. doi: 10.1016/s1097-2765(01)00264-7. [DOI] [PubMed] [Google Scholar]
Associated Data
This section collects any data citations, data availability statements, or supplementary materials included in this article.