

Abstract
This study examined age-related changes in complex executive function (EF) in a large, representative sample (N = 2,036) aged 5 to 17 using the Cognitive Assessment System (CAS; Naglieri & Das, 1997a). Relations between complex EF and academic achievement were examined on a sub-sample (N = 1,395) given the Woodcock-Johnson Tests of Achievement–Revised (Woodcock & Johnson, 1989). Performance on the three complex EF tasks improved until at least age 15, although improvement slowed with increasing age and varied some across tasks. Moreover, the different developmental patterns in the correlations between completion time and accuracy provide clues to developmental processes. Examination of individual achievement subtests clarified the specific aspects of academic performance most related to complex EF. Finally, the correlation between complex EF and academic achievement varied across ages, but the developmental pattern of the strength of these correlations was remarkably similar for overall math and reading achievement, suggesting a domain-general relation between complex EF and academic achievement.
Keywords: Executive function, academic achievement, childhood, adolescence
1. Introduction
A number of studies have focused on the origins of adaptive, goal-directed behavior—commonly referred to as executive function (EF)—in young children (see Garon, Bryson, & Smith, 2008, for a review of early EF development). During early childhood, children develop the ability to ignore distraction (Klenberg, Korkman, & Lahti-Nuuttila, 2001), inhibit prepotent and inappropriate responses (e.g., Carlson & Moses, 2001), shift between different sets of tasks (Zelazo, Müller, Frye & Marcovitch, 2003), and then integrate these abilities to solve more complex problems (Asato, Sweeney, & Luna, 2004; Bull, Espy, & Senn, 2004; Miyake et al., 2000).
Although these early milestones of EF are important to document, fewer studies examine EF development and its correlates in middle childhood and adolescence (Best, Miller, & Jones, 2009). This later development is highly important, too, as EF is associated with school success in middle (Blair & Diamond, 2008; Blair & Razza, 2007) and late childhood (Sikora, Haley, Edwards, & Butler, 2002; van der Sluis, de Jong, & van der Leij, 2007). What is missing in this literature is a comprehensive look at the relations between EF and academic achievement over a wide age range. The specific relations may vary from one age to another, as EF may be more important during some phases of development than others. The present study is more comprehensive than previous studies in that it included a large sample (N=2,036), a wide age range (5 to 17), three EF tasks, nine academic tests (Woodcock-Johnson Tests of Achievement–Revised [WJ-R], Woodcock & Johnson, 1989), and several aspects of performance (accuracy, completion time, and their ratio) on the EF tasks. Moreover, unlike most studies of EF in children, we used an assessment of EF with strong psychometric properties (Cognitive Assessment System [CAS], Naglieri & Das, 1997a). Strong reliability, in particular, is important when examining correlations between tests.
Another reason for using the CAS was that it contains “complex” EF tasks that involve several components of EF and often require the coordination of those components. These three complex EF tasks comprise the CAS Planning scale. “Simple” EF tasks, conversely, attempt to isolate the EF components. (Note: There are strong arguments, however, that the EF components, particularly working memory and inhibition, are interactive by nature and cannot be isolated in a cognitive task [Roberts & Pennington, 1996].) The CAS does contain simple EF tasks within another scale, the Attention scale, and a similar analysis of those tasks can be found in Lehman, Naglieri, and Aquilino (2010). Because reading and math are complex skills, their reported correlations with EF likely reflect complex EF skills such as selecting and coordinating several EF components. Finally, we focus on complex EF based on evidence for protracted development through late adolescence (Romine & Reynolds, 2005).
In addition to examining the relations between EF and academic achievement over a broad age range, we had a second goal, of documenting the form of EF development (e.g., the magnitude of change at different ages), with identical or nearly identical tasks employed across the sample. This examination is important for a) clarifying age differences in EF using a large sample covering a wide age range, and b) identifying aspects of EF development (e.g., accuracy, time to completion) that might underlie age differences in the relations between EF and school performance, which could guide future research on this question.
Based on previous research, we expected EF to improve through the elementary school years and adolescence, though perhaps more gradually during adolescence (Davidson et al., 2006; Huizinga, Dolan, & van der Molen, 2006; Huizinga & van der Molen, 2007; Luciana, Conklin, Hooper, & Yarger, 2005; Somsen, 2007, and see Romine & Reynolds, 2005 for a meta-analysis of EF developmental studies and Best & Miller, 2010, for a review). These behavioral findings align with both structural (e.g., Gogtay et al., 2004) and functional imaging studies (e.g., Casey et al., 1997; Durston et al., 2006) reporting a protracted development of the neural substrate supporting EF.
We examined response time and accuracy separately on the EF tasks in an attempt to provide a more fine-grained analysis of EF development and to seek clues to the developmental processes involved. For example, metacognition—monitoring one’s performance and adjusting behavior as needed—appears to be an important mechanism related to EF during the school years (e.g., Crone Somsen, Zanolie, & van der Molen, 2007; Davidson, Amso, Anderson, & Diamond, 2006; Somsen, 2007). One way to detect the influence of metacognition is to compare age-related changes in accuracy and reaction time on a task. In one study, Davidson and his colleagues (2006) found that both reaction time and accuracy on EF tasks increased from middle childhood to early adulthood, suggesting a speed-accuracy trade-off: Older participants adjusted their reaction times in order to maintain a high level of accuracy, which suggests the influence of metacognition on the development of mature task performance. Note that such developmental patterns suggesting the underlying developmental processes would be less evident when only narrow age ranges are tested.
1.1 The EF Construct
There is ongoing debate about the nature of the EF construct, but one prominent theoretical framework suggests that EF constitutes distinct, yet related, components, with inhibition, updating of working memory, and shifting being foundational components (Friedman et al., 2008; Huizinga et al., 2006; Lehto, Juujärvi, Kooistra, & Pulkkinen, 2003; Miyake et al., 2000; van der Sluis et al., 2007). Based on this multi-componential framework, complex EF tasks, like those used in the present study, likely require some combination of, and coordination of, these EF components (Anderson, 2002; Asato et al., 2006; Bull et al., 2004; Huizinga et al., 2006; Huizinga & van der Molen, 2007; Miyake et al., 2000). The CAS Planning scale contains three such tasks: Matching Numbers, Planned Codes, and Planned Connections. In developing these tasks, EF was operationalized as the ability to prepare multiple steps of action in advance, evaluate those actions (updating of working memory), avoid or suppress non-goal behavior (inhibition), and change course of action if necessary (shifting) (Naglieri, 2005, Naglieri & Das, 2005). On Matching Numbers children must use controlled searches, as opposed to automatic searches (Schneider & Shiffrin, 1997), to find two identical numbers within a row of similar numbers. Since all the numbers within a row contain similar digits and are the same length, the two identical numbers do not “pop out” but must be identified by selecting and employing a controlled search strategy (Das, Naglieri, & Kirby, 1994). Planned Codes is a variation of other substitution coding tasks (also called digit-symbol coding tasks), commonly found in intelligence batteries, which require children to fill in a matrix of incomplete codes based on a decoding key at the top of the page. However, unlike substitution coding tasks that primarily involve children’s perceptual speed (e.g., Laux & Lane, 1985), the Planned Codes task does not contain prespecified instructions on how to code (e.g., left to right, top to bottom). Thus, children must consider the problem, select a coding strategy, and monitor its effectiveness, shifting to another coding strategy if necessary (Naglieri et al., 1989). Finally, Planned Connections resembles the classic neuropsychological assessment of frontal lobe functioning, the Trail Making Test (e.g., Reitan, 1971). It requires children to keep a number or letter in mind to find the next number or letter and to shift between executing number and letter searches (Naglieri et al., 1989). As this description indicates, although “Planning” is the umbrella label given to these three tasks, they assess core EF components in the context of achieving task goals.
1.2 EF and Academic Achievement
Longitudinal research suggests that EF contributes to academic achievement rather than vice versa (e.g., Bull, Espy, & Wiebe, 2008; Georgie & Greenfield, 2005; Hitch, Towse, & Hutton, 2001; Miller & Hinshaw, 2010). Furthermore, EF has been linked to academic achievement in children of various ages with and without specific learning disabilities (see Best, Miller, & Jones, 2009, and Müller, Lieberman, Frye, & Zelazo, 2008, for reviews). Performance on inhibition and working memory tasks, in particular, consistently relates to performance in mathematics and reading (Blair & Razza, 2007; Bull & Scerif, 2001; Protopapas, Archonti, & Skaloumbakas, 2007; St. Clair-Thompson & Gathercole, 2006; van der Schoot, Licht, Horsley, & Sergeant, 2000; van der Sluis et al., 2007). Shifting, on the other hand, does not consistently relate to academic achievement (Espy, McDiarmid, Cwik, Stalets, Hamby, & Senn, 2004; van der Sluis et al., 2007).
As suggested earlier, complex EF tasks that require the coordination of the foundational EFs and the execution and monitoring of a complex sequence of actions should be of particular importance to academic achievement. Only a few studies have examined the link between complex EF and academic achievement, and most of these studies have used the Tower of London (TOL) or Tower of Hanoi (TOH) task. In both tower tasks, children must select and execute a sequence of moves in order to transform an initial pattern of balls located on pegs to a target pattern in a minimum number of moves. In one study (Bull et al., 2008), TOL performance in preschool predicted improvements in both reading and math from age 5 to age 8. The authors reason that early complex EF skills are domain-general rather than domain-specific skills that provide the building blocks for the development of math and reading skills. Another study (Altemeier, Jones, Abbott, & Berninger, 2006) suggests a more nuanced relationship. After controlling for lower-level EF performance, performance on a modified TOH task uniquely predicted the ability to translate previously-taken notes into a report in 3rd graders, but not 5th graders. Tower performance, however, did not uniquely predict the ability to take notes from a written passage in either grade level. The authors suggested that in younger children, report-writing is less automatic and requires more effortful planning and coordination, but it is unclear why complex EF was not a unique contributor to note-taking skills.
In another study (Sikora et al., 2002), children (aged 7 – 18) with arithmetic difficulties exhibited greater TOL impairment than children with reading difficulties or children with no diagnosed academic difficulty. Although Sikora et al. did not offer any explanations as to why TOL performance would be more closely linked to math performance, they did suggest that the cognitive processes needed for math may differ from those needed for reading. Finally, Cohen, Bronson, and Casey (1995) found that two complex EF tasks (the TOH and Trail-Making task) did not predict 3rd graders’ general school performance (as indexed by a composite of reading, language arts, and math grades) but did not examine each school subject separately.
Together, these studies suggest that complex EF is linked to academic performance in some way; however, differences in sample and task characteristics across studies prohibit drawing strong conclusions. Thus, at least two uncertainties remain: (1) Previous research is inconsistent concerning whether EF is domain-general and needed in various academic skills, or domain-specific and related differentially to academic skills. (2) There is some evidence that EF is more closely related to academic achievement in early schooling (Altemeier et al., 2006), although no study has yet to examine this relationship across all of primary and secondary schooling. Thus, an investigation of the link between EF and academic achievement, both reading and math, in a large and representative sample with a broad age span should clarify this topic.
1.3 Cognitive Assessment System (CAS)
In the present study the standardization sample from the CAS was used to examine the development of EF across a broad, continuous age range (5 to 17 years) and relations between EF and academic achievement. This sample is ideal for several reasons. First, the exceptionally wide age range permits a more complete description of EF development than previous studies and thus may a) identify periods of rapid change, and b) clarify the relation between EF and academic performance. Second, the large sample size (N = 2,036) increases the power of detecting subtle changes with age and permits a detailed description of EF development. Third, unlike in most EF studies, the sample matches the U.S. population on important demographic variables, including gender, race, ethnicity, parental education, geographic region, and community setting. Thus, the ability to generalize the results of this sample is maximized. Finally, a subset of the children (N = 1,395) also completed the WJ-R, permitting an investigation of the association between EF and academic achievement—both math and reading—across development.
Beyond the benefits of this sample, the CAS has many characteristics that enrich the study of EF development. In particular, it meets recommendations delineated by Berg and his colleagues (Berg & Byrd, 2002; Berg, Byrd, McNamara, & MacDonald, 2006) for the TOL, a commonly used complex EF task. The two main recommendations are that EF researchers develop standardized versions of EF tasks and that assessments include multiple performance indices, including at least one accuracy measure and one speed measure. Being a standardized task, the CAS allows researchers to make comparisons across age groups and testing sites. The CAS also contains several performance indices, including completion time and accuracy. We thus can examine the convergence of the results and, specifically, determine whether completion time and accuracy show similar developmental trends and whether they are related to each other (e.g., indicating a speed-accuracy tradeoff).
1.4 Current Aims and Hypotheses
Our first aim is to examine the form of complex EF development across middle childhood and adolescence. The complex EF tests on the CAS for younger (5–7) and older (8–17) children are comprised of the same types of items, but in order to avoid floor and ceiling effects, the CAS gives them different time limits and/or different sets of items. This configuration interferes with the direct comparison of development between ages 7 and 8 years but it allows for more precise measurement for the 5–7 and 8–17 year age ranges. Based on previous empirical work (e.g., Romine & Reynolds, 2005), we hypothesize that EF scores will continue to improve across the entire age range, but that the magnitude of those improvements will decrease with age. Also, relations between completion time and accuracy at various ages are of particular interest, especially any evidence for a speed-accuracy tradeoff, as this may reveal the influence of metacognition on task performance.
Our second aim is to examine the relations between EF and academic achievement. Based on the few studies that have examined complex EF and achievement, it is uncertain whether EF is related generally to academic achievement or more specifically to certain academic skills. Naglieri and Das (1997b) reported the correlations between the composite of the three CAS EF tasks and the WJ-R. To extend this work and provide a more fine-grained analysis of relations between EF and academic achievement, we will examine all nine subtests, with a focus on reading and math, and perform detailed analyses to explore age- and task-related differences in correlation strength.
2. Material and methods
2.1 Participants
Participants included children and adolescents (N = 2,036; see Table 1 for N by age) between the ages of 5 and 17 years, 11 months (M = 9.4 years, SD = 3.7), who participated in the standardization of the CAS. Children from 68 sites across the United States were recruited by letters and consent forms sent home to parents from school. This sample was representative of the U.S. population (1990 census data) on the basis of gender (50% female), race (77% White, 13% African American, 10% Other), ethnicity (10% Hispanic), parental education (20% no high school diploma, 29% high school diploma, 29% some college, 22% college graduate), geographic region, and community setting (74% urban-suburban, 26% rural) (see Naglieri & Das, 1997a, for details). Although there has been an increase in the Hispanic population (now roughly 13%) and a decrease in the percentage of Whites (now roughly 75%), this sample is similar to the current U.S. population on these demographic variables (based on 2000 census data; www.census.gov).
Table 1.
Means, Standard Deviations, and Sample Sizes for Completion Time on EF Subtests by Age
| Age | N | Matching Numbers | Planned Codes | Planned Connections | Planning Composite | ||||
|---|---|---|---|---|---|---|---|---|---|
| Mean | SD | Mean | SD | Mean | SD | Mean | SD | ||
| 5.0–5.11 | 250 | 7.7 | 2.6 | 9.8 | 2.1 | 7.7 | 3.7 | 7.5 | 3.1 |
| 6.0–6.11 | 330 | 9.7 | 2.4 | 9.7 | 0.5 | 10.2 | 2.3 | 10.0 | 2.2 |
| 7.0–7.11 | 329 | 12.0 | 2.4 | 10.5 | 4.6 | 11.6 | 1.5 | 12.0 | 1.9 |
| 8.0–9.11 | 356 | 7.5 | 2.1 | 9.8 | 3.4 | 7.7 | 3.1 | 7.3 | 2.4 |
| 10.0–11.11 | 284 | 9.4 | 2.2 | 9.9 | 3.3 | 9.7 | 2.5 | 9.5 | 2.2 |
| 12.0–13.11 | 158 | 11.2 | 2.2 | 10.0 | 2.3 | 11.2 | 1.8 | 11.3 | 1.8 |
| 14.0–15.11 | 163 | 12.5 | 2.2 | 10.2 | 2.2 | 12.2 | 1.4 | 12.6 | 1.7 |
| 16.0–17.11 | 166 | 13.0 | 1.9 | 10.4 | 2.8 | 12.3 | 1.7 | 12.9 | 1.7 |
2.2 Measures
2.2.1 Cognitive Assessment System
The CAS is a standardized test that measures children’s mental abilities as defined by the Planning, Attention, Simultaneous and Successive (PASS) theory of cognitive function (Das et al., 1994). The PASS theory, in turn, is based on the work of Luria, whose work linking brain anatomy and function informed much of neuropsychology (Luria, 1966). The focus of this study is on the complex EF scale, labeled Planning by Naglieri and Rojahn (2001; for a description of the other CAS scales, see Naglieri, 2005 and Naglieri & Das, 1997a). The three EF subtests require the child to create a plan of action, apply that plan, and monitor the plan’s effectiveness as it relates to efficient and accurate task completion. These subtests present the child with novel tasks that encourage strategic behavior. The average internal reliability coefficient across all ages for the Planning Scale is .88. The internal consistency is r = .75, .82, and .82, respectively, for the three subtests (Naglieri & Das, 1997b).
2.2.1.1 Matching Numbers
The first EF subtest, Matching Numbers, contains four pages, each with eight rows of numbers and six numbers per row. Numbers increase in digit length every four rows from one to seven digits. Children are asked to underline the two numbers in each row that are the same. Children are told to work as quickly as possible and to cross out any mistakes made. Each page is timed: Pages 1 through 3 have a 150-second time limit; page 4 has a 180-second time limit. Children aged 5 – 7 complete pages 1 and 2; children aged 8 – 17 completed pages 2 through 4. Scores reflect the ratio of the time to complete the item to the number correct.
2.2.1.2 Planned Codes
The second subtest, Planned Codes, contains two items, each with a matrix of 7 rows and 8 columns of letters with empty boxes. The legend at the top of the page shows a correspondence of letters to specific codes (A to OX, B to XX, C to OO and D to XO). Children are asked to fill in the corresponding codes in the empty boxes just beneath each letter. Children are told to complete as many codes as possible, as quickly as possible, within the time limit. In Item 1, the letters are arranged vertically: All A’s are in column 1, B’s in column 2, etc. In Item 2, letters are arranged diagonally: All A’s are on a diagonal, B’s on a diagonal, etc. Children aged 5 – 7 are given 120 seconds per item; children aged 8 – 17 are given 60 seconds per item. A ratio score is formed based on time to complete each item and number correct.
2.2.1.3 Planned Connections
The third subtest, Planned Connections, contains 8 items. The first six items require the child to connect numbers in sequential order, with an increasing length of numbers to connect. The last two items require the child to connect both numbers and letters in alternating sequential order (i.e., 1-A-2-B-3-C, etc.), again with the total sequence increasing in length from Item 7 to Item 8. Children are told to work as quickly as possible without making a mistake, but are directed back to the previous correct position by the examiner if there is a mistake. Children aged 5 – 7 complete Items 1 – 5; children aged 8 – 17 complete Items 4 – 8. The item score is the total time required to complete that item and the total test score is the time to complete all items.
2.2.1.4 CAS scoring
Following the CAS testing manual, task performance on Matching Numbers and Planned Codes is calculated by taking the ratio score for each page (which is [number of items correct plus 10] squared, divided by the number of seconds it took the child to complete the page), and then summing these ratio scores to make an overall scale score. Task performance on Planned Connections consists only of the time it took to complete the page summed across all pages of that subtest.
2.2.2 Woodcock-Johnson Tests of Achievement—Revised (WJ-R)
The WJ-R contains nine subtests that assess basic reading, writing, mathematics, and knowledge skills. They are Letter-Word Identification (reading isolated letters and words), Passage Comprehension (providing missing word from incomplete sentence), Word Attack (reading nonsense words), Reading Vocabulary (providing synonyms and antonyms, solving analogies), Calculation (solving arithmetic equations), Quantitative Concepts (understanding mathematical symbols and concepts), Applied Problems (solving math word problems), Dictation (writing letters and words), and Proofing (identifying errors in written passage). The WJ-R standard subtest scores (M = 100, SD = 15) were combined to create two broad achievement scores, Reading (the average of Letter-Word Identification, Passage Comprehension, Word Attack, and Reading Vocabulary) and Math (the average of Calculation, Quantitative Concepts, and Applied Problems). This was done to test whether complex EF is more closely related to overall reading or math achievement, given these are two main achievement domains examined in previous research. Dictation and Proofing were excluded from this analysis because neither fit neatly into reading or math achievement.
2.3 Procedure
Participants were individually administered the CAS and WJ-R in a small testing room in the children’s school by trained examiners following the standardized procedures presented in the CAS Administration and Scoring Manual (Naglieri & Das, 1997a). The WJ-R was given following the CAS and during the same testing session. The three Planning subtests take about 15 minutes and the entire CAS Standard Battery takes 60 minutes. Each WJ-R subtest takes 5 minutes. Examiners were highly trained, which included being attuned to each child’s level of fatigue. Short breaks were allowed as needed by the child, especially between the CAS and WJ-R.
2.4 Statistical Analyses
Children’s EF raw scores were converted to a standard score (M = 10, SD = 3) through intermediate z scores calculated on the overall means and SDs for 5–7 and 8–17 year-olds separately because of differences in test versions. All inferential statistical analyses were conducted separately for the two age groups. Multivariate analysis of variance (MANOVA) was performed to determine whether EF performance continued to improve into adolescence on each of the three tasks. Pair-wise comparison determined points of significant improvement between adjacent age groups, using the Bonferroni correction for multiple comparisons.
To examine the magnitude of differences between age groups in task performance, Cohen’s d effect sizes were computed, using the following formula:
These effect sizes estimate the magnitude of the difference between adjacent age groups in standard deviation units. Cohen’s d of .20, .50, and .80 were interpreted as small, medium, and large, respectively (Cohen, 1988).
Finally, Pearson product-moment correlation coefficients were computed: First, between completion time and accuracy; second, between the standard performance indices and WJ-R Achievement subtest standard scores for each age group; and third, between the standard performance indices and the general WJ-R categories of math and reading achievement. Where standard performance scores were not used, correlations were partialled for age to control for age-related differences within each age group. These analyses were performed to determine whether completion time and accuracy were related similarly across age, to determine whether similar processes underlie the three EF tasks, and to investigate the association between EF and academic achievement. When an average of multiple correlations was needed for analysis, individual correlations were converted to z scores using the Fisher transformation:
These relevant z scores then could be averaged and converted back to Pearson correlations. Statistical differences between z scores were also tested with Bonferroni correction for multiple comparisons, using the following formula for the standard error:
3. Results
3.1 What is the Pattern of Improvement in EF with Increasing Age?
Means, standard deviations, and sample sizes for the 3 EF tasks are presented separately for the completion time and accuracy in Tables 1 and 2, respectively. To test EF development, MANOVA was performed on the ratio scores for each task. The omnibus test indicated differences in performance based on age for both the younger age group, Pillai’s F(6,1810) = 94.90, p < .001, η2p = .24, and the older age group, Pillai’s F(12,3201) = 61.16, p < .001, η2p = .19. Follow-up univariate tests determined that there were significant age differences for all 3 tasks (all ps < .001) for both the younger age group (aged 5 – 7) and older group (aged 8 – 18). To determine the precise points of improvement for each task, post hoc comparisons of adjacent age groups were performed (Bonferroni correction, p < .05). Among the younger children, there were significant improvements in performance from age 5 to 6 to 7 for all tasks. For older children, performance improved between all adjacent ages until age 15 on Matching Numbers and Planned Connections, and through age 17 on Planned Codes (Figure 1). Thus, as expected, EF appears to develop until at least middle or late adolescence, with some evidence of less rapid improvement at the older ages.
Table 2.
Means, Standard Deviations, and Sample Sizes for Accuracy on EF Subtests by Age
| Age | N | Matching Numbers | Planned Codes | Planning Composite | |||
|---|---|---|---|---|---|---|---|
| Mean | SD | Mean | SD | Mean | SD | ||
| 5.0–5.11 | 250 | 7.6 | 3.5 | 7.5 | 1.8 | 7.4 | 1.9 |
| 6.0–6.11 | 330 | 10.3 | 2.2 | 9.6 | 2.2 | 9.6 | 2.1 |
| 7.0–7.11 | 329 | 11.7 | 1.7 | 12.3 | 2.7 | 12.3 | 2.6 |
| 8.0–9.11 | 356 | 7.8 | 2.1 | 7.7 | 2.2 | 7.6 | 2.3 |
| 10.0–11.11 | 284 | 10.4 | 2.5 | 9.3 | 2.3 | 9.4 | 2.3 |
| 12.0–13.11 | 158 | 11.1 | 2.1 | 10.9 | 2.4 | 11.0 | 2.3 |
| 14.0–15.11 | 163 | 11.5 | 2.0 | 12.3 | 2.1 | 12.3 | 1.9 |
| 16.0–17.11 | 166 | 11.7 | 1.7 | 13.0 | 2.1 | 13.0 | 2.0 |
Figure 1.

Standard performance means by task and each age group. MN = Matching Numbers; PC = Planned Codes; PCn = Planned Connections.
Given that Matching Numbers and Planned Codes contained completion time and accuracy measures, age differences were tested for each performance measure separately. (Planned Connections had no accuracy component because examiners correct all errors as the child completes the task.) The MANOVA omnibus test indicated age differences in both measures and on both tasks for the younger age range, Pillai’s F(10,1806) = 63.08, p < .001, η2p = .26, and the older age range, Pillai’s F(20,4484) = 42.75, p < .001, η2p = .16. The younger children showed significant improvements (Bonferroni correction, p < .05) in both completion time and accuracy from age 5 to 6 and again from 6 to 7 with one exception: Planned Codes completion time did not improve significantly between age 5 and 6. For older children, completion time decreased significantly until age 15 on Matching Numbers but never improved on Planned Codes. Accuracy, on the other hand, improved until age 11 on Matching Numbers and until age 15 on Planned Codes (see Figures 2 and 3).
Figure 2.
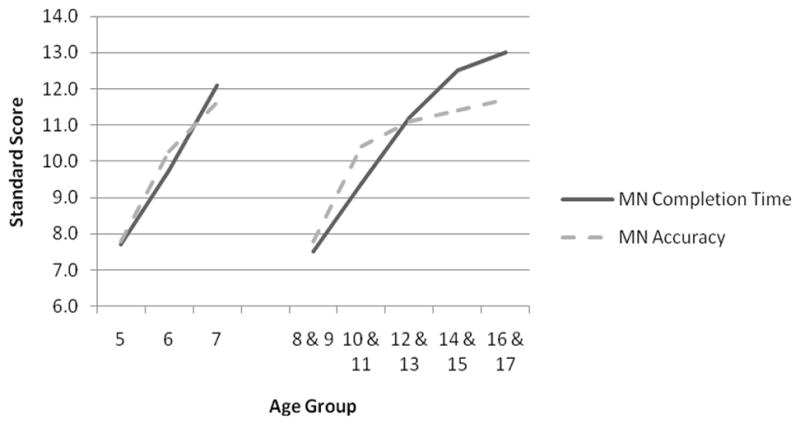
Standard performance scores by age for completion time and accuracy measures on Matching Numbers. MN = Matching Numbers.
Figure 3.
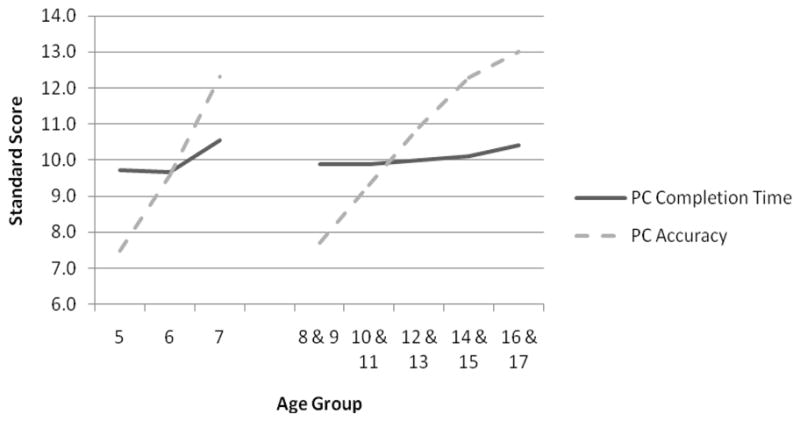
Standard performance scores by age for completion time and accuracy on Planned Codes. PC = Planned Codes.
The magnitude of age-related differences in EF was determined by computing Cohen’s d between adjacent age groups (see Figure 4). From 5- to 7-years of age, the magnitude was large or near large for all three tasks. From age 8 to age 15, the magnitude was moderate, but between the age of 15 and 17, the magnitude dropped for all three tasks—dramatically so for both Matching Numbers and Planned Connections. Thus, as predicted, both accuracy and completion time improved over a wide age range, and improvement generally slowed during adolescence.
Figure 4.

The rate of change between age groups by subtest expressed in d ratios. MN = Matching Numbers; PC = Planned Codes; PCn = Planned Connections.
3.2 How are Completion Time and Accuracy Related at Each Age on Each Task?
The correlations between completion time and accuracy on Matching Numbers and Planned Codes (see Table 3) may suggest what processes underlie performance at each age. There was a moderate negative correlation between completion time and accuracy on Matching Numbers until age 12 that dropped to non-significance thereafter. This negative correlation suggests that during the elementary school years, the more accurate children were, the faster they completed the task. Conversely, on Planned Codes 8- to 11-year-olds showed a small to moderate positive correlation between time and accuracy that became non-significant starting at age 12. This indicates that between the ages of 8 and 12 the more slowly children completed the task, the more accurately they did so, suggesting a speed-accuracy tradeoff. For younger children the correlation varied from near zero at ages 5 and 7 to moderately negative (r = −.26, p < .001) at age 6. Thus, the relation between completion time and accuracy appears to depend on the task and the age of the child.
Table 3.
Correlations between the Raw Time and Accuracy Scores on Matching Numbers and Planned Codes, Controlling for Age *p < .05 **p<.01
| Age | Matching Numbers | Planned Codes |
|---|---|---|
| 5.0–5.11 | −.44** | .04 |
| 6.0–6.11 | −.33** | −.26** |
| 7.0–7.11 | −.26** | −.07 |
| 8.0–9.11 | −.36** | .23** |
| 10.0–11.11 | −.37** | .19** |
| 12.0–13.11 | −.11 | .15 |
| 14.0–15.11 | −.10 | .04 |
| 16.0–17.11 | −.09 | .04 |
3.3 Is EF Related to Academic Achievement?
Previous research (Naglieri & Das, 1997b) reports that standard total scores on the CAS EF (Planning) Scale correlate moderately (r = .49 – .57) with academic achievement. To extend this finding, the current question is whether the relationship with achievement is consistent across achievement subtest, age, and EF task. In these analyses, EF performance reflects the ratio score standardized by age, and academic achievement reflects the WJ-R standard subtest score. Tables 4 and 5 present the correlations for each of the three EF tasks and the WJ-R Achievement subtests.
Table 4.
Correlations between EF Subtests and WJ-R Reading Subtests
| Age | Letter-Word Identification | Passage Comprehension | Word Attack | Reading Vocabulary | ||||||||
|---|---|---|---|---|---|---|---|---|---|---|---|---|
| MN | PC | PCn | MN | PC | PCn | MN | PC | PCn | MN | PC | PCn | |
| 5 (n = 181) | .36** | .32** | .32** | .42** | .39* | .41** | .35** | .27** | .38** | .42* | .39** | .34** |
| 6 (n = 195) | .49** | .48** | .35** | .45** | .47** | .38** | .40** | .44** | .44** | .38** | .44** | .39** |
| 7 (n = 203) | .33** | .41** | .32** | .35** | .38** | .31** | .41** | .42** | .35** | .39** | .41** | .29** |
| 8–9 (n = 243) | .48** | .32** | .55** | .44** | .27** | .47** | .51** | .30** | .59** | .50** | .28** | .53** |
| 10–11 (n =191) | .50** | .32** | .47** | .49** | .31** | .44** | .43** | .30** | .45** | .47** | .26** | .47** |
| 12–13 (n = 118) | .47** | .35** | .35** | .44** | .35** | .34** | .41** | .30** | .48** | .45** | .30** | .41** |
| 14–15 (n = 124) | .31** | .18 | .43** | .30** | .21* | .43** | .32** | .25** | .40** | .42** | .21* | .37** |
| 16–17 (n = 140) | .36** | .34** | .40** | .41** | .33** | .40** | .46** | .41** | .51** | .51** | .40** | .47** |
Note. MN = Matching Numbers; PC = Planned Codes; PCn = Planned Connections
p < .05
p<.01
Table 5.
Correlations between EF Subtests and WJ-R Math and Skill Subtests
| Age | Calculation | Applied Problems | Quantitative Concepts | Dictation | Proofing | ||||||||||
|---|---|---|---|---|---|---|---|---|---|---|---|---|---|---|---|
| MN | PC | PCn | MN | PC | PCn | MN | PC | PCn | MN | PC | PCn | MN | PC | PCn | |
| 5 | .24** | .24** | .12 | .48** | .35** | .43** | .46** | .43** | .45** | .50** | .37** | .44** | .43** | .40** | .43** |
| 6 | .48** | .49** | .34** | .53** | .53** | .44** | .48** | .51** | .44** | .57** | .53** | .45** | .46** | .46** | .35** |
| 7 | .31** | .41** | .27** | .43** | .42** | .34** | .40** | .43** | .36** | .42** | .40** | .33** | .32** | .38** | .32** |
| 8–9 | .47** | .35** | .56** | .57** | .33** | .60** | .52** | .31** | .58** | .57** | .32** | .56** | .47** | .28** | .50** |
| 10–11 | .43** | .28** | .47** | .46** | .36** | .45** | .49** | .30** | .49** | .45** | .32** | .44** | .49** | .32** | .44** |
| 12–13 | .44** | .32** | .44** | .46** | .34** | .47** | .46** | .34** | .41** | .45** | .30** | .41** | .43** | .38** | .31** |
| 14–15 | .30** | .16 | .44** | .39** | .29** | .45** | .38** | .25** | .40** | .44** | .32** | .49** | .29** | .17 | .40** |
| 16–17 | .31** | .30** | .38** | .49** | .47** | .55** | .47** | .42** | .49** | .48** | .46** | .54** | .35** | .34** | .37** |
Note. MN = Matching Numbers; PC = Planned Codes; PCn = Planned Connections
p < .05
p<.01
First, does each EF task relate to some academic skills more than others at younger and older ages? To determine this, age was collapsed within the younger (5–7) and older (8–17) age groups. Table 6 displays the ordering of correlation strength between the complex EF tasks and WJ-R subtests for younger and older children separately. Dictation, Applied Problems, and Quantitative Concepts routinely correlated most strongly with each EF task in both age groups, whereas Calculation often correlated most weakly with complex EF. Second, because overall reading and math achievement were of particular interest in the current study, we asked: When looking across multiple aspects of math and reading, is EF more closely related to one achievement domain or the other, and does this depend on age? Figure 5 provides the correlations of each EF task with the average of the math-related achievement subtests (Calculation, Quantitative Concepts, Applied Problems) and reading-related achievement subtests (Letter-Word Identification, Passage Comprehension, Word Attack, Reading Vocabulary). At all ages, correlation strength fell within the moderate to moderately-large range. Notably, age-related trends for reading and math were remarkably similar. Within the younger age group, correlation strength increased substantially from age 5 to 6. Within the older age group, correlation strength was generally strongest at ages 8–9 and decreased slightly but remained moderate through adolescence. Planned Codes generally was more weakly related to both reading and math achievement, and these correlation differences were significant at ages 8–9 for both math and reading achievement and at ages 10–11 for math achievement (Bonferroni correction, p < .05).
Table 6.
Ordering of Correlation Strength (Correlations in Parentheses) between CAS and WJ-R Subtests from Strongest to Weakest
| Matching Numbers | Planned Codes | Planned Connections | |||
|---|---|---|---|---|---|
| Younger | Older | Younger | Older | Younger | Older |
| Dictation (.55) | Dictation (.48) | Quant Concepts (.49) | App Problems (.36) | Quant Concepts (.45) | App Problems (.50) |
| App Problems (.53) | App Problems (.47) | App Problems (.47) | Dictation (.34) | Dictation (.43) | Dictation (.49) |
| Quant Concepts (.48) | Reading Vocab (.47) | Dictation (.47) | Quant Concepts (.32) | App Problems (.43) | Word Attack (.49) |
| Passage Comp (.43) | Quant Concepts (.46) | Proofing (.44) | Word Attack (.31) | Word Attack (.41) | Quant Concepts (.47) |
| Proofing (.43) | Word Attack (.42) | Reading Vocab (.44) | Letter-Word ID (.30) | Proofing (.39) | Calculation (.46) |
| Reading Vocab (.42) | Letter-Word ID (.42) | Passage Comp (.44) | Proofing (.30) | Passage Comp (.38) | Reading Vocab (.45) |
| Letter-Word ID (.41) | Passage Comp (.41) | Letter-Word ID (.43) | Passage Comp (.29) | Reading Vocab (.35) | Letter-Word ID (.44) |
| Word Attack (.41) | Proofing (.41) | Calculation (.41) | Reading Vocab (.29) | Letter-Word ID (.34) | Passage Comp (.42) |
| Calculation (.36) | Calculation (.39) | Word Attack (.40) | Calculation (.28) | Calculation (.25) | Proofing (.41) |
Note. All correlations are significant, p < .01.
Figure 5.

Pearson correlations between EF subtests and math and reading achievement. All correlations are significant at p < .05. MN = Matching Numbers; PC = Planned Codes; PCn = Planned Connections.
Thus, these more fine-grained analyses of EF task, academic subtest, and age provide a more nuanced picture of the relations between EF and academic achievement than is apparent in previous research. Both academic domain-general relations and intra-domain variability were revealed. On the one hand, the pattern of correlations across age between each EF task and academic subject on the whole was quite similar for math and reading (question #2 and Figure 5). These age-related trends for both reading and math suggest that although the strength of the association between EF and academic performance may change from age to age, it changes similarly for both reading and math. This outcome points to a domain-general contribution of EF to academic performance. On the other hand, intra-domain variability (e.g., within math) is indicated by the findings that each EF subtest correlated more highly with some tasks than others within the same domain (question #2 and Table 6). Most prominently, it appears that complex EF is more closely related to certain aspects of math (i.e., applied problem-solving) than others (i.e., calculation).
4. Discussion
4.1 Age-Related Changes in EF
This study provided a fine-grained analysis of age differences in complex EF by comparing the magnitude of change across adjacent age groups. Generally, the magnitude of EF improvement was large across the youngest groups, became more moderate in late childhood, and diminished further during adolescence. This finding supports, in a single study with a wide age range and three complex EF tasks, the conclusions of a meta-analysis (Romine & Reynolds, 2005), in which complex EF ability increased dramatically between ages 5 and 8 (Cohen’s d = 1.43) but improved more moderately thereafter through early adulthood (Cohen’s d = .45 – .77). It also supports a theory-based review (Anderson, 2002) suggesting that complex EF processing develops rapidly during middle childhood and gradually thereafter through adolescence.
Importantly, separate analyses of completion time and accuracy revealed that the improvements in Matching Numbers scores during adolescence were mainly decreases in completion time whereas the improvements in Planned Codes scores were almost entirely increases in accuracy. This shows the importance of including more than one performance measure and multiple tasks to obtain an accurate and nuanced picture of EF development.
The correlations between completion time and accuracy across development provide insight into this finding. On Matching Numbers, children, but not adolescents, who completed the task more accurately, completed it faster. Starting at age 12, however, completion time and accuracy were unrelated. This finding may reflect the fact that accuracy improved very little in late childhood and adolescence but completion time continued to decrease significantly during this same period. On Planned Codes, children of all ages used most of the allotted time to complete the task, and this limited variation in performance may explain why completion time and accuracy were not strongly or consistently related at most ages. Completion time and accuracy did correlate positively from age 8 to 12, indicating that those children who spent more time on the task completed the task more accurately. During adolescence, like with Matching Numbers, the two performance measures were unrelated; unlike Matching Numbers, the continued improvements to the overall scores were spurred by increasing accuracy rather than shortened completion time.
This discrepancy in what possibly drives the protracted development of EF—decreased completion time on Matching Numbers and increased accuracy on Planned Codes—is an intriguing finding. On Matching Numbers the association between accuracy and completing the task quickly may mean that children who are skilled on the task can complete the task quickly, perhaps because of having good search strategies (i.e., systematic and efficient ways of comparing the numbers). It may be that there was not a fundamental change in the strategies used by older children and adolescents but instead subtle improvements in the efficiency in implementing strategies already in place, leading to faster task completion. In support of this idea, Winsler et al. (2006) report that much of the change in strategy use on Matching Numbers in this same sample occurred between the ages of 5 and 9, and then strategies stabilized from age 10 to 17. In contrast, on Planned Codes, a speed-accuracy trade-off may be in effect; that is, the positive correlation between completion time and accuracy from age 8 to 12 may show that these older children adjust their speed in order to preserve or even increase their accuracy. Through adolescence participants continued to complete the task more accurately while using the entire allotted time, also suggesting that they favored completing the task more accurately at the expense of completing it more quickly. Similarly, Davidson and his colleagues (2006) found evidence of a speed/accuracy trade-off on a measure of cognitive flexibility: adults, but not children, increased their latency to respond on switch trials to maintain high accuracy. Thus, improved monitoring of cognitive processes and use of feedback to adjust performance, often referred to as metacognition, may be an integral mechanism of EF development on some EF tasks.
In sum, the differing developmental patterns for Matching Numbers and Planned Codes suggest that simply looking at improvement, with age, in the number correct provides a very incomplete picture of EF development. Looking at speed and accuracy at each age suggests possible developmental processes such as metacognition, as well as strategy acquisition and efficient utilization, that should be examined more thoroughly in future research. This future work will be important for extending current models of EF development, which primarily focus on early development (e.g., Diamond, 2006; Munakata, 2001; Zelazo, Müller, Frye, & Marcovitch, 2003), to the full range of EF development.
4.2 Relations between EF and Academic Achievement
As operationalized in this study, EF involves the creation and implementation of a plan, self-monitoring, and cognitive flexibility (Naglieri et al., 1989). The literature suggests that such skills are an important component of school success (e.g., Blair & Diamond, 2008). The present study was more comprehensive than these studies in its large sample, wide age range, three complex EF tasks, two academic areas, and multiple measures of performance. Moreover, few studies have used complex EF tasks or an assessment of EF with strong psychometric properties. Previous research on the CAS (Naglieri & Das, 1997b; Naglieri & Rojahn, 2004) reported that the Planning scale (a composite of the three EF tasks) correlates moderately with achievement. The current study expanded on this finding by determining whether this association was consistent across achievement subtest, age, and the three EF tasks. That is, more specific connections were examined than in previous research. First, importantly, the pattern of correlation strength between each EF task and achievement across age was remarkably similar for math and reading when considered on the whole, and complex EF correlated significantly with subtests within each domain. This is noteworthy because of the very different content of these two academic domains. This finding supports a previous finding that EF tasks assess the common cognitive processes (e.g., plan generation, self-monitoring, updating, and impulse control) that are important to aspects of both reading and math (Bull et al., 2008). As support, Matching Numbers, a task that consists solely of finding identical numbers (i.e., no letters) correlated as strongly with reading as with math, suggesting that the ability to generate and apply a plan, monitor its effectiveness, and self-correct as necessary is similarly relevant to both domains.
Second, there was intra-domain variability in correlation strength. Focusing on the WJ-R subtests, there was evidence that complex EF is more closely related to certain skills than others within the same academic domain (e.g., math). The clearest indication of this was that complex EF was a stronger correlate of applied problem-solving (word problems) than calculation. This suggests that math problem-solving relies more on strategy formulation and implementation, and self-monitoring (all critical components of complex EF) than does calculation, which may rely more on retrieval of arithmetic facts from long-term memory or on the individual EF components such as working memory.
Focusing on the EF tasks, Matching Numbers and Planned Connections, on the one hand, showed similar trends with a spike in correlation strength at age 6, a second spike at age 8–9, and fairly consistent correlation strength in late childhood and adolescence. Correlation strength remained moderate across childhood and adolescence. This seemingly contradicts the findings of Altemeier et al. (2006), who posit that EF may be more important earlier in schooling, when academic skills are less automatic and require more effortful planning to execute. However, an important difference between these two studies is that the tests of academic achievement used here (WJ-R) become increasingly difficult with age. Thus, it is possible that the achievement tests for older children rely less on highly practiced academic skills than do those for younger children but instead lend themselves more to strategic completion.
Planned Codes, on the other hand, showed one spike in correlation strength at age 6 but after age 7 was not as closely related to academic achievement compared to either Matching Numbers or Planned Connections within the older age group, except at age 16–17. A hypothesis for future research is that the specific processes underlying Planned Codes performance (e.g., maintaining translation rules in working memory, recognition of systematic arrangement of codes) are less important to academic achievement than those processes underlying Matching Numbers and Planned Connections completion. Alternatively, differences in format may underlie the discrepant findings. Future research also could examine whether the Pearson correlations showing relations between EF and academic achievement still hold after controlling for certain third variables (e.g., processing speed, SES).
The findings about the pattern of EF development also suggest particular directions for future research on the relations between EF and academic achievement. Are the spikes in correlation strength between EF and academic achievement at certain ages due to the better implementation and coordination of EF components, as reflected in improved metacognition, increased use of strategies, etc.? How, if at all, does the slowed improvement in EF at the oldest ages impact the association of EF with school performance in these ages? Finally, given the changes in EF and in the strength of the correlation with academic achievement across ages, is the causal direction constant throughout development? That is, although longitudinal studies suggest that EF contributes to academic achievement (e.g., Bull et al., 2008; Georgie & Greenfield, 2005; Hitch et al., 2001; Miller & Hinshaw, 2010), at some developmental point does the latter contribute to the former as well?
Finally, these findings suggest that EF training could have effects on academic performance beyond the domain targeted in training—specifically, promoting aspects of both math and reading achievement, particularly where strategy creation and implementation is needed. Previous research has shown that EF training, in the form of computerized games, enhances performance on trained and untrained EF tasks in young children (Rueda, Rothbart, McCandliss, Saccomanno, & Posner, 2005; Thorell, Lindqvist, Bergman, Bohlin, & Klingberg, 2008). Research has also shown that curriculum designed to promote EF improves performance on untrained EF tasks in young children (Diamond, Barnett, Thomas, & Munro, 2007). Additionally, increases in academic performance has been found when children have been taught to better utilize EF strategies when doing math computation (Iseman & Naglieri, in press; Naglieri & Gottling, 1995, 1997; Naglieri & Johnson, 2000) and reading comprehension (Haddad, Garcia, Naglieri, Grimditch, McAndrews & Eubanks, 2003). Thus, there is evidence that EF training is effective in young children; however, it is unclear whether EF training is effective in older children.
4.3 Conclusions
The present study goes beyond previous research by providing a specific (to age, task, measure, and academic skill), in-depth account of relations between EF and academic achievement, and identifies possible developmental processes to be examined in future research. EF continues to develop into adolescence, with possibly a focus during adolescence on fine tuning skills acquired during the rapid changes during the elementary-school years. Furthermore, EF appears to incorporate cognitive processes fundamental to several aspects of academic achievement. Importantly, both age and type of EF task qualified these two findings, emphasizing the importance of including multiple tasks and measures, as well as a wide range of ages. Finally, one of the major strengths of the CAS is that it is standardized, which allows confident comparisons across testing sites, age groups, and research studies. Normative data of this kind are rich sources from which researchers can examine age-related changes across large spans of development in a nationally-representative sample (Korkman, 2001).
References
- Altemeier L, Jones J, Abbott RD, Berninger VW. Executive functions in becoming writing readers and reading writers: Note taking and report writing in third and fifth graders. Developmental Neuropsychology. 2006;29:161–173. doi: 10.1207/s15326942dn2901_8. [DOI] [PubMed] [Google Scholar]
- Anderson P. Assessment and development of executive function (EF) during childhood. Child Neuropsychology. 2002;8:71–82. doi: 10.1076/chin.8.2.71.8724. [DOI] [PubMed] [Google Scholar]
- Anderson VA, Anderson P, Northam E, Jacobs R, Catroppa C. Development of executive functions through late childhood and adolescence in an Australian sample. Developmental Neuropsychology. 2001;20(1):385–406. doi: 10.1207/S15326942DN2001_5. [DOI] [PubMed] [Google Scholar]
- Asato MR, Sweeney JA, Luna B. Cognitive processes in the development of TOL performance. Neuropsychologia. 2004;44:2259–2269. doi: 10.1016/j.neuropsychologia.2006.05.010. [DOI] [PubMed] [Google Scholar]
- Bell MA, Wolfe CD, Adkins DR. Frontal lobe development during infancy and childhood. In: Coch DJ, Fischer KW, Dawson G, editors. Human behavior learning, and the developing brain: Typical development. New York: Guilford; 2007. [Google Scholar]
- Berg WK, Byrd DL. The Tower of London spatial problem solving task: Enhancing clinical and research implementation. Journal of Experimental and Clinical Neuropsychology. 2002;25:586–604. doi: 10.1076/jcen.24.5.586.1006. [DOI] [PubMed] [Google Scholar]
- Berg WK, Byrd DL, McNamara JPH, MacDonald CA. New indices of planning abilities using the Tower of London task. In: Poreh AM, editor. The Quantified Process Approach to Neuropsychological Assessment. New York, NY: Taylor & Francis; 2006. [Google Scholar]
- Best JR, Miller PH. A developmental perspective on executive function. Child Development. 2010;81:1641–1660. doi: 10.1111/j.1467-8624.2010.01499.x. [DOI] [PMC free article] [PubMed] [Google Scholar]
- Best JR, Miller PH, Jones LL. Executive functions after age 5: Changes and correlates. Developmental Review. 2009;29:180–200. doi: 10.1016/j.dr.2009.05.002. [DOI] [PMC free article] [PubMed] [Google Scholar]
- Blair C, Diamond A. Biological processes in prevention and intervention: The promotion of self-regulation as a means of preventing school failure. Development and Psychopathology. 2008;20:899–911. doi: 10.1017/S0954579408000436. [DOI] [PMC free article] [PubMed] [Google Scholar]
- Blair C, Razza RP. Relating effortful control, executive function, and false belief understanding to emerging math and literacy ability in Kindergarten. Child Development. 2007;78:647–663. doi: 10.1111/j.1467-8624.2007.01019.x. [DOI] [PubMed] [Google Scholar]
- Bull R, Espy KA, Senn TE. A comparison of performance on the Towers of London and Hanoi in young children. Journal of Child Psychology and Psychiatry. 2004;45:743–754. doi: 10.1111/j.1469-7610.2004.00268.x. [DOI] [PubMed] [Google Scholar]
- Bull R, Espy KA, Wiebe SA. Short-term memory, working memory, and executive functioning in preschoolers: Longitudinal predictors of mathematical achievement at age 7 years. Developmental Neuropsychology. 2008;33:205–228. doi: 10.1080/87565640801982312. [DOI] [PMC free article] [PubMed] [Google Scholar]
- Bull R, Scerif G. Executive functioning as a predictor of children’s mathematics ability: Inhibition, switching, and working memory. Developmental Neuropsychology. 2001;19:273–293. doi: 10.1207/S15326942DN1903_3. [DOI] [PubMed] [Google Scholar]
- Carlson SM, Moses LJ. Individual differences in inhibitory control and children’s theory of mind. Child Development. 2001;72:1032–1053. doi: 10.1111/1467-8624.00333. [DOI] [PubMed] [Google Scholar]
- Casey BJ, Trainor RJ, Orendi JL, Schubert AB, Nystrom LE, Giedd JN, et al. A developmental functional MRI study of prefrontal activation during performance of a go-no-go task. Journal of Cognitive Neuroscience. 1997;9:835–847. doi: 10.1162/jocn.1997.9.6.835. [DOI] [PubMed] [Google Scholar]
- Cepeda NJ, Kramer AF, Gonzales de Sather JCM. Changes in executive control across the life span: Examination of task-switching performance. Developmental Psychology. 2001;37:715–730. [PubMed] [Google Scholar]
- Cohen GN, Bronson MB, Casey MB. Planning as a factor in school achievement. Journal of Applied Developmental Psychology. 1995;16:405–528. [Google Scholar]
- Cohen J. Statistical power analysis for the behavioral sciences. 2. Hillsdale, NJ: Lawrence Erlbaum Associates; 1988. [Google Scholar]
- Crone EA, Somsen RJM, Zanolie K, Molen MWvd. A heart rate analysis of developmental change in feedback processing and rule shifting from childhood to early adulthood. Journal of Experimental Child Psychology. 2006;95:99–116. doi: 10.1016/j.jecp.2006.03.007. [DOI] [PubMed] [Google Scholar]
- Davidson MC, Amso D, Anderson LC, Diamond A. Development of cognitive control and executive functions from 4 to 13 years: Evidence from manipulations of memory, inhibition, and task switching. Neuropsychologia. 2006;44:2037–2078. doi: 10.1016/j.neuropsychologia.2006.02.006. [DOI] [PMC free article] [PubMed] [Google Scholar]
- Das JP, Naglieri JA, Kirby JR. Assessment of cognitive processes: The PASS theory of intelligence. Needham Heights, MA: Allyn & Bacon; 1994. [Google Scholar]
- Diamond A. The early development of executive functions. In: Bialystock E, Craik FIM, editors. The early development of executive functions. Lifespan cognition: Mechanisms of change. Oxford, England: Oxford University Press; 2006. pp. 70–95. [Google Scholar]
- Diamond A, Barnett WS, Thomas J, Munro S. Preschool program improves cognitive control. Science. 2007;318:1387–1388. doi: 10.1126/science.1151148. [DOI] [PMC free article] [PubMed] [Google Scholar]
- Durston S, Davidson MC, Tottenham N, Galvan A, Spicer J, Fossella JA, et al. A shift from diffuse to focal cortical activity with development. Developmental Science. 2006;9:1–20. doi: 10.1111/j.1467-7687.2005.00454.x. [DOI] [PubMed] [Google Scholar]
- Espy KA, McDiarmid MM, Cwik MF, Stalets MM, Hamby A, Senn TE. The contribution of executive functions to emergent mathematic skills in preschool children. Developmental Neuropsychology. 2004;26:465–486. doi: 10.1207/s15326942dn2601_6. [DOI] [PubMed] [Google Scholar]
- Friedman NP, Miyake A, Young SE, DeFries JC, Corley RP, Hewitt JK. Individual differences in executive functions are almost entirely genetic in origin. Journal of Experimental Psychology-General. 2008;137:201–225. doi: 10.1037/0096-3445.137.2.201. [DOI] [PMC free article] [PubMed] [Google Scholar]
- Garon N, Bryson SE, Smith IM. Executive function in preschoolers: A review using an integrative framework. Psychological Bulletin. 2008;134:31–60. doi: 10.1037/0033-2909.134.1.31. [DOI] [PubMed] [Google Scholar]
- George J, Greenfield D. Examination of a structured problem-solving flexibility task for assessing approaches to learning in young children: Relation to teacher ratings and children’s achievement. Journal of Applied Developmental Psychology. 2005;26(1):69–84. [Google Scholar]
- Gogtay N, Giedd JN, Lusk L, Hayashi KM, Greenstein D, Vaituzis AC, et al. Dynamic mapping of human cortical development during childhood through early adulthood. Proceedings of the National Academy of Science (USA) 2004;101:8174–8179. doi: 10.1073/pnas.0402680101. [DOI] [PMC free article] [PubMed] [Google Scholar]
- Haddad FA. Planning versus speed: An experimental examination of what Planned Codes of the Cognitive Assessment System measures. Archives of Clinical Neuropsychology. 2004;19:313–317. doi: 10.1016/S0887-6177(03)00027-1. [DOI] [PubMed] [Google Scholar]
- Haddad FA, Garcia YE, Naglieri JA, Grimditch M, McAndrews A, Eubanks J. Planning Facilitation and Reading Comprehension: Instructional Relevance of the PASS Theory. Journal of Psychoeducational Assessment. 2003;21:282–289. [Google Scholar]
- Hitch G, Towse J, Hutton U. What limits children’s working memory span? Theoretical accounts and applications for scholastic development. Journal of Experimental Psychology: General. 2001;130(2):184–198. doi: 10.1037//0096-3445.130.2.184. [DOI] [PubMed] [Google Scholar]
- Hooper SR, Swartz CW, Wakely MB, de Kruif REL, Montgomery JW. Executive functions in elementary school children with and without problems in written expression. Journal of Learning Disabilities. 2002;36:57–68. doi: 10.1177/002221940203500105. [DOI] [PubMed] [Google Scholar]
- Huizinga M, Dolan C, van der Molen MW. Age-related change in executive function: Developmental trends and a latent variable analysis. Neuropsychologia. 2006;44:2017–2036. doi: 10.1016/j.neuropsychologia.2006.01.010. [DOI] [PubMed] [Google Scholar]
- Huizinga M, van der Molen MW. Age-group differences in set-switching and set-maintenance on the Wisconsin Card Sorting Task. Developmental Neuropsychology. 2007;31:193–215. doi: 10.1080/87565640701190817. [DOI] [PubMed] [Google Scholar]
- Iseman J, Naglieri JA. A Cognitive Strategy Instruction to Improve Math Calculation for Children with ADHD: A Randomized Controlled Study. Journal of Learning Disabilities. doi: 10.1177/0022219410391190. (in press) [DOI] [PubMed] [Google Scholar]
- Klenberg L, Korkman M, Lahti-Nuuttila P. Differential development of attention and executive functions in 3- to 12-year-old Finnish children. Developmental Neuropsychology. 2001;20:407–428. doi: 10.1207/S15326942DN2001_6. [DOI] [PubMed] [Google Scholar]
- Kops C, Belmont I. Planning and organizing skills of poor school achievers. Journal of Learning Disabilities. 1985;18:8–14. doi: 10.1177/002221948501800102. [DOI] [PubMed] [Google Scholar]
- Korkman M. Introduction to the special issue on normal neuropsychological development in the school-age years. Developmental Neuropsychology. 2001;20:325–330. doi: 10.1207/S15326942DN2001_1. [DOI] [PubMed] [Google Scholar]
- Laux LF, Lane DM. Information processing components of substitution test performance. Intelligence. 1985;9:111–136. [Google Scholar]
- Lehman E, Naglieri J, Aquilino S. A national study on the development of visual attention using the Cognitive Assessment System. Journal of Attention Disorders. 2010;14(1):15–24. doi: 10.1177/1087054709332473. [DOI] [PubMed] [Google Scholar]
- Lehto JE, Juujärvi P, Kooistra L, Pulkkinen L. Dimensions of executive functioning: Evidence from children. British Journal of Developmental Psychology. 2003;21:59–80. [Google Scholar]
- Luciana M, Conklin HM, Hooper CJ, Yarger RS. The development of nonverbal working memory and executive control processes in adolescents. Child Development. 2005;76:697–712. doi: 10.1111/j.1467-8624.2005.00872.x. [DOI] [PubMed] [Google Scholar]
- Luna B, Garver KE, Urban TA, Lazar NA, Sweeney JA. Maturation of cognitive processes from late childhood to adulthood. Child Development. 2004;75:1357–1372. doi: 10.1111/j.1467-8624.2004.00745.x. [DOI] [PubMed] [Google Scholar]
- Luria AR. Higher cortical functions in man. NY: Basic Books; 1966. [Google Scholar]
- Marcovitch S, Lewkowicz DJ. U-shaped functions: Artifact or hallmark of development? Journal of Cognition and Development. 2004;5:113–118. [Google Scholar]
- Miller M, Hinshaw S. Does childhood executive function predict adolescent functional outcomes in girls with ADHD? Journal of Abnormal Child Psychology: An official publication of the International Society for Research in Child and Adolescent Psychopathology. 2010;38(3):315–326. doi: 10.1007/s10802-009-9369-2. [DOI] [PMC free article] [PubMed] [Google Scholar]
- Miyake A, Friedman NP, Emerson MJ, Witzki AH, Howerter A, Wager TD. The unity and diversity of executive functions and their contributions to complex “frontal lobe” tasks: A latent variable analysis. Cognitive Psychology. 2000;41:49–100. doi: 10.1006/cogp.1999.0734. [DOI] [PubMed] [Google Scholar]
- Müller U, Lieberman D, Frye D, Zelazo PD. Executive function, school readiness, and school achievement. In: Thurman SK, Fiorello CA, editors. Applied Cognitive Research in K-3 Classrooms. New York: Routledge; 2008. pp. 41–84. [Google Scholar]
- Munakata Y. Graded representations in behavioral dissociations. Trends in Cognitive Sciences. 2001;5:309–315. doi: 10.1016/s1364-6613(00)01682-x. [DOI] [PubMed] [Google Scholar]
- Naglieri JA. The Cognitive Assessment System. In: Flanagan DP, Harrison PL, editors. Contemporary Intellectual Assessment. 2. New York: Guilford; 2005. pp. 441–460. [Google Scholar]
- Naglieri JA, Das JP. Planning-Arousal-Simultaneous-Successive (PASS): A model for assessment. Journal of School Psychology. 1988;26:35–48. [Google Scholar]
- Naglieri JA, Das JP. Cognitive Assessment System. Austin, TX: ProEd; 1997a. [Google Scholar]
- Naglieri JA, Das JP. Cognitive Assessment System Interpretive Handbook. Austin, TX: ProEd; 1997b. [Google Scholar]
- Naglieri JA, Das JP. Planning, Attention, Simultaneous, Successive (PASS) theory: A Revision of the Concept of Intelligence. In: Flanagan DP, Harrison PL, editors. Contemporary Intellectual Assessment. 2. New York: Guilford; 2005. pp. 136–182. [Google Scholar]
- Naglieri JA, Gottling SH. A cognitive education approach to math instruction for the learning disabled: An individual study. Psychological Reports. 1995;76:1343–1354. doi: 10.2466/pr0.1995.76.3c.1343. [DOI] [PubMed] [Google Scholar]
- Naglieri JA, Gottling SH. Mathematics instruction and PASS cognitive processes: An intervention study. Journal of Learning Disabilities. 1997;30:513–520. doi: 10.1177/002221949703000507. [DOI] [PubMed] [Google Scholar]
- Naglieri JA, Johnson D. Effectiveness of a cognitive strategy intervention to improve math calculation based on the PASS theory. Journal of Learning Disabilities. 2000;33:591–597. doi: 10.1177/002221940003300607. [DOI] [PubMed] [Google Scholar]
- Naglieri JA, Prewett PN, Bardos AN. An exploratory study of planning, attention, simultaneous, and successive cognitive processes. Journal of School Psychology. 1989;27:347–364. [Google Scholar]
- Naglieri JA, Rojahn J. Gender differences in Planning, Attention, Simultaneous, and Successive (PASS) cognitive processes and achievement. Journal of Educational Psychology. 2001;93:430–437. [Google Scholar]
- Naglieri JA, Rojahn J. Construct validity of the PASS theory and CAS: Correlations with achievement. Journal of Educational Psychology. 2004;96:174–181. [Google Scholar]
- Olson EA, Luciana M. The development of prefrontal cortex functions in adolescence: Theorectical models and a possible dissociation of dorsal versus ventral subregions. In: Nelson CA, Luciana M, editors. Handbook of Developmental Cognitive Neuroscience. 2. Cambridge, MA: MIT Press; 2008. pp. 575–590. [Google Scholar]
- Protopapas A, Archonti A, Skaloumbakas C. Reading ability is negatively related to Stroop interference. Cognitive Psychology. 2007;54:251–282. doi: 10.1016/j.cogpsych.2006.07.003. [DOI] [PubMed] [Google Scholar]
- Reitan RM. Trail making test results for normal and brain-damaged children. Perceptual and Motor Skills. 1971;33:575–581. doi: 10.2466/pms.1971.33.2.575. [DOI] [PubMed] [Google Scholar]
- Reitan RM, Wolfson D. The Trail Making Test as an initial screening procedure for neuropsychological impairment in older children. Archives of Clinical Neuropyschology. 2004;19:281–288. doi: 10.1016/S0887-6177(03)00042-8. [DOI] [PubMed] [Google Scholar]
- Roberts RJ, Pennington BF. An interactive framework for examining prefrontal cognitive processes. Developmental Neuropsychology. 1996;12:105–126. [Google Scholar]
- Romine CB, Reynolds CR. A model of the development of frontal lobe function: Findings from a meta-analysis. Applied Neuropsychology. 2005;12:190–201. doi: 10.1207/s15324826an1204_2. [DOI] [PubMed] [Google Scholar]
- Rueda MR, Rothbart MK, McCandliss BD, Saccomanno L, Posner MI. Training, maturation, and genetic influences on the development of executive attention. Proceedings of the National Academy of Science USA. 2005;102:14931–14936. doi: 10.1073/pnas.0506897102. [DOI] [PMC free article] [PubMed] [Google Scholar]
- Schneider W, Shiffrin R. Controlled and automatic human information processing: I. Detection, search and attention. Psychological Review. 1977;84:1–66. [Google Scholar]
- Sikora DM, Haley P, Edwards J, Butler RW. Tower of London test performance in children with poor arithmetic skills. Developmental Neuropsychology. 2002;21:243–254. doi: 10.1207/S15326942DN2103_2. [DOI] [PubMed] [Google Scholar]
- Somsen RJM. The development of attention regulation in the Wisconsin Card Sorting Task. Developmental Science. 2007;10:664–680. doi: 10.1111/j.1467-7687.2007.00613.x. [DOI] [PubMed] [Google Scholar]
- St Clair-Thompson HL, Gathercole SE. Executive functions and achievements in school: Shifting, updating, inhibition, and working memory. The Quarterly Journal of Experimental Psychology. 2006;59:745–759. doi: 10.1080/17470210500162854. [DOI] [PubMed] [Google Scholar]
- Thorell LB, Lindqvist S, Bergman S, Bohlin G, Klingberg T. Training and transfer effects of executive functions in preschool children. Developmental Science. 2008;11:969–976. doi: 10.1111/j.1467-7687.2008.00745.x. [DOI] [PubMed] [Google Scholar]
- United States Department of Commerce. Profiles of general demographic characteristics. 2000 Retrieved from http://www2.census.gov/census_2000/datasets/demographic_profile/0_United_States/2kh00.pdf.
- van der Schoot M, Licht R, Horsley TM, Sergeant JA. Inhibitory deficits in reading disability depend on subtype: Guessers but not spellers. Child Neuropsychology. 2000;6:297–312. doi: 10.1076/chin.6.4.297.3139. [DOI] [PubMed] [Google Scholar]
- van der Sluis S, de Jong PF, van der Leij A. Executive functioning in children, and its relations with reasoning, reading, and arithmetic. Intelligence. 2007;35:427–449. [Google Scholar]
- Welsh MC, Pennington BF, Groisser DB. A normative-developmental study of executive function: A window on prefrontal function in children. Developmental Neuropsychology. 1991;7:131–149. [Google Scholar]
- Winsler A, Naglieri JA. Overt and Covert Verbal Problem-Solving Strategies: Developmental Trends in Use, Awareness, and Relations with Task Performance in Children Age 5 to 17. Child Development. 2003;74:659–678. doi: 10.1111/1467-8624.00561. [DOI] [PubMed] [Google Scholar]
- Zelazo PD, Muller U, Frye D, Marcovitch S. The development of executive function in early childhood. Monographs of the Society for Research in Child Development. 2003;68 doi: 10.1111/j.0037-976x.2003.00260.x. Serial No. 274. [DOI] [PubMed] [Google Scholar]
- Winsler A, Naglieri JA, Manfra L. Children’s search strategies and accompanying verbal and motor strategic behavior: Developmental trends and relations with task performance among children age 5 to 17. Cognitive Development. 2006;21:232–248. [Google Scholar]
- Woodcock RW, Johnson MB. Woodcock-Johnson Revised tests of cognitive ability: Standard and supplemental batteries. Itasca, IL: Riverside Publishing; 1989. [Google Scholar]
- Zelazo PD, Müller U, Frye D, Marcovitch S. The development of executive function. Monographs of the Society for Research in Child Development. 2003;68:11–27. doi: 10.1111/j.0037-976x.2003.00260.x. [DOI] [PubMed] [Google Scholar]