

Abstract
Age-dependent metabolic syndrome (MetS) is a well established risk factor for cardiovascular disease, but it also confers major risk for impaired cognition in normal aging or Alzheimer's disease (AD). However, little is known about the specific pathways mediating MetS–brain interactions. Here, we performed the first studies quantitatively linking MetS variables to aging changes in brain genome-wide expression and mitochondrial function. In six young adult and six aging female rhesus monkeys, we analyzed gene expression in two major hippocampal subdivisions critical for memory/cognitive function [hippocampus proper, or cornu ammonis (CA), and dentate gyrus (DG)]. Genes that changed with aging [aging-related genes (ARGs)] were identified in each region. Serum variables reflecting insulin resistance and dyslipidemia were used to construct a quantitative MetS index (MSI). This MSI increased with age and correlated negatively with hippocampal mitochondrial function (state III oxidation). More than 2000 ARGs were identified in CA and/or DG, in approximately equal numbers, but substantially more ARGs in CA than in DG were correlated selectively with the MSI. Pathways represented by MSI-correlated ARGs were determined from the Gene Ontology Database and literature. In particular, upregulated CA ARGs representing glucocorticoid receptor (GR), chromatin assembly/histone acetyltransferase, and inflammatory/immune pathways were closely associated with the MSI. These results suggest a novel model in which MetS is associated with upregulation of hippocampal GR-dependent transcription and epigenetic coactivators, contributing to decreased mitochondrial function and brain energetic dysregulation. In turn, these MSI-associated neuroenergetic changes may promote inflammation, neuronal vulnerability, and risk of cognitive impairment/AD.
Introduction
Metabolic syndrome (MetS), also termed insulin resistance syndrome, comprises a constellation of age-dependent symptoms (insulin resistance and compensatory hyperinsulinemia, atherogenic dyslipidemia, hypertension, and central obesity) that contributes to cardiovascular disease and is reaching epidemic proportions (Reaven, 2005). In addition, MetS is increasingly recognized to be a major risk factor for aging-related cognitive dysfunction or Alzheimer's disease (AD) (Yaffe et al., 2004; Fishel et al., 2005; Rivera et al., 2005; Gustafson, 2006; Craft, 2007; Whitmer et al., 2007). In the periphery, mitochondrial dysfunction accompanies MetS (Bugger and Abel, 2008), but it is unclear whether MetS is also associated with energetic dysregulation in the brain. Several MetS-related variables have been linked to altered brain functions. Hyperinsulinemia, for example, can induce brain inflammatory responses, as well as stimulate some apparently beneficial effects, such as β-amyloid clearance or improved cognitive performance (Fishel et al., 2005; Craft, 2006, 2007). Moreover, diabetes and insulin resistance are associated with neuronal Ca2+ dysregulation (Biessels et al., 2002; Verkhratsky and Fernyhough, 2008) or impaired brain synaptic plasticity (Zhao and Alkon, 2001; Stranahan et al., 2008a). Furthermore, glucocorticoids (GCs), which likely contribute to peripheral insulin resistance (Seckl and Walker, 2004; Pedersen et al., 2006), also play a role in brain aging and cognitive impairment (Landfield et al., 1981; Issa et al., 1990; Lupien et al., 1998; McEwen et al., 1999; Sapolsky, 1999; Seckl and Walker, 2004; Landfield et al., 2007; Piroli et al., 2007; Stranahan et al., 2008b; Bizon et al., 2009).
Nevertheless, the complex interactions of peripheral MetS with brain aging and memory are still poorly understood. One approach to analyzing complex systems is microarray expression profiling, a powerful technology that allows simultaneous assessment of thousands of genes and identification of multiple processes/pathways (Dennis et al., 2003; Mirnics and Pevsner, 2004; Blalock et al., 2005). In neuroscience, genome-wide profiling has been used effectively to elucidate brain processes affected in normal aging (Lee et al., 2000; Blalock et al., 2003; Lu et al., 2004; Verbitsky et al., 2004; Fraser et al., 2005; Burger et al., 2007; Rowe et al., 2007; Xu et al., 2007; Berchtold et al., 2008; Duce et al., 2008; Loerch et al., 2008; Kadish et al., 2009; Bishop et al., 2010) and AD (Dickey et al., 2003; Blalock et al., 2004; Ginsberg et al., 2006).
Here, we performed the first study of aging-dependent associations between brain expression profiles, brain mitochondrial function, and peripheral MetS variables. Rhesus monkeys were used for this study because aging rhesus monkeys develop multiple MetS-like symptoms and frequently MetS or type 2 diabetes (Tigno et al., 2004), as well as age-related cognitive decline similar to that in humans (Rapp and Amaral, 1991; Cai and Arnsten, 1997; Moss et al., 1997; Lacreuse et al., 2005). Gene expression was analyzed in the hippocampus proper [cornu ammonis (CA)× and the dentate gyrus (DG), two regions critical for spatial memory and plasticity functions in multiple species (Moser and Moser, 1998; Hampson et al., 1999; Burke and Barnes, 2006; Lynch et al., 2006; Disterhoft and Oh, 2007), including rhesus monkey (Porrino et al., 2005; Deadwyler et al., 2007; Skaggs et al., 2007; Hampson et al., 2009). The results reveal intriguing new candidates for roles in MetS-associated brain dysfunction and perhaps in selective CA vulnerability.
Materials and Methods
Subjects
Six young (7.0 ± 0.3 years old) and six aged (23.5 ± 0.7 years old) female rhesus monkeys (Macaca mulatta) were used in this study. The monkeys were obtained from a breeding colony (Covance) at least 8 months before tissue collection and housed in individual primate cages at the University of Kentucky primate facility, which is fully accredited by the Association for Assessment and Accreditation of Laboratory Animal Care. Animals were selected for this study on the basis of age, and peripheral MetS variables were not assessed at the start or used to determine subject inclusion. Animals were provided toys and other devices for enrichment and had individual access to an exercise module adjacent to their housing module, several hours per week. All procedures were approved by the University of Kentucky Animal Care and Use Committee, and veterinarians trained in nonhuman primate care supervised animal health. Animals were maintained on a 12 h light/dark cycle in temperature-controlled rooms. They were fed certified nonhuman primate chow given in the morning and supplemented in the afternoon with fresh fruit or vegetables. Water was available ad libitum. Based on previous work considering age at puberty, brain volume, and longevity (Tigges et al., 1988; Gore and Terasawa, 1991; Andersen et al., 1999), it is estimated that 1 year of rhesus life is approximately equivalent to 3 years of human life. Therefore, the young animals here corresponded to ∼21-year-old humans, whereas the aged cohort corresponded to ∼70-year-old humans.
Behavioral training
Beginning 6 weeks before tissue collection, the 12 animals were trained and evaluated on behavioral tasks, first for 2 weeks on a hand retrieval/motor coordination task (Zhang et al., 2000) and, subsequently, on an aging-sensitive cognitive memory task, the variable delay response (VDR) (Cai and Arnsten, 1997). This latter phase was staggered and timed such that the fourth and last test session was performed just before killing the animal. A significant age-related decline in motor performance was found on the initial task, but those data are beyond the scope of the present study and will be presented in a subsequent publication on motor functions in these animals. In addition, a significant age-related decline in performance was also seen on the VDR task. However, this decline did not show the established age-dependent specificity for longer delay intervals (Rapp and Amaral, 1991; Cai and Arnsten, 1997; Lacreuse et al., 2005; Hampson et al., 2009) and instead was found across all delays tested (data not shown). Furthermore, VDR data did not significantly correlate with mitochondrial function (p > 0.6) or the metabolic syndrome index (MSI) (p > 0.5), and the microarray–behavioral correlations showed high false discovery rates (FDR) (>1.5 in both CA and DG regions). Consequently, aging effects on cognition might have been partially obscured by one or more factors, potentially including motor deficits (Cai and Arnsten, 1997), practice effects [“overtraining” (Lacreuse et al., 2005; Walton et al., 2008)], or low cognitive load (Deadwyler et al., 2007; Hampson et al., 2009), and are not presented here (data available on request).
Tissue harvesting
All animals appeared healthy and alert before they were killed. Animals were sedated (50–100 mg of ketamine HCl, i.m.) and venous blood was collected for additional analysis as described below. Animals were then fatally overdosed (250–300 mg of sodium pentobarbital, i.v). There was no difference in time to death, nor was there an apparent agonal state in any subject. There also was no significant age difference in lethal dosage (young, 54.8 ± 5.3 mg/kg; aged, 46.1 ± 6.3 mg/kg; p = 0.33, Student's t test). After pentobarbital injection, brains were quickly removed (5–10 min), placed ventral side up in an adult rhesus brain mold (Ted Pella), and sectioned into 4-mm-thick coronal tissue slabs. The brains were sectioned both rostrally and caudally starting at the level of the optic chiasm in all animals. The left side of each slab was notched to maintain orientation, and the slabs were removed from the mold in the rostral to caudal direction. Slabs were then placed in Petri dishes containing ice-cold mitochondrial isolation buffer composed of 215 mm mannitol, 75 mm sucrose, 0.1% BSA, 20 mm HEPES, and 1 mm EGTA, pH 7.2. The right hippocampus was dissected for mitochondrial assays and the left for gene expression microarray analysis as described below.
These anesthetic procedures raise a caveat regarding the data on aging-related mitochondrial function reported below, which is that the results could in part reflect an interaction of age with the anesthetic. It has been shown that inhalational anesthetic agents can directly impair mitochondrial activity (Yang et al., 2008; Wei and Xie, 2009). However, that effect has not been associated with intravenous pentobarbital (Short and Young, 2003), and additional studies will be needed to clarify this issue.
Peripheral metabolic markers
Two aliquots of venous blood were collected (5 cc each; BD vacutainer #367820; BD Biosciences) from each animal after ketamine-induced anesthesia and before fatal dosing with pentobarbital. Collected blood was chilled on ice for 30 min and centrifuged (10 min at 1000 × g at 4°C) to isolate serum. Serum from each subject was divided for subsequent analysis (Antech Diagnostics) as follows: 1 ml for SuperChem (catalog #SA010; standard electrolyte, protein, glucose, insulin, and cholesterol assay; stored at −20°C); 0.2 ml for lipoprotein electrophoresis (catalog #85552; stored at 4°C); and 0.3 ml for insulin/glucose (catalog #T470; stored at −20°C). Serum pH was not measured here but is another variable potentially linked to MetS (Maalouf et al., 2007).
Composition of the peripheral MSI
The MSI used here comprised three equally weighted components that are symptomatic of MetS (Reaven, 2005). For each animal, insulin/glucose ratios were calculated from the measures of insulin divided by glucose. Because a higher ratio indicates increased insulin resistance, these ratios were ranked across animals from lowest to highest, and this ranking contributed one-third of the total peripheral metabolic syndrome index. The second component was based on the ratio of triglyceride (TG) concentration from the SuperChem analysis to the high density lipoprotein (HDL) concentration (types 1 and 2 summed) from the lipoprotein electrophoresis determinations. Increased triglyceride/HDL ratios are characteristic symptoms of metabolic syndrome, and these ratios were ranked and used as the second component of the MSI. The final component was chylomicron concentration from the lipoprotein electrophoresis panel. Elevated chylomicrons are highly atherogenic and also indicative of metabolic syndrome (Reaven, 2005) and were ranked and incorporated as the third and final component. The MSI was calculated as the overall sum of ranks of the three components. However, it should be emphasized that a high score on the MSI does not alone constitute a diagnosis of MetS, because the latter generally also requires evidence of impaired fasting glucose and insulin resistance, as well as elevated blood pressure and obesity (for review, see Ding et al., 2007). Thus, although monkeys in the present study varied from high to low on an index of key MetS-related variables and those with the highest values likely had MetS, their MetS status was not diagnosed formally.
Mitochondrial functional assay
Isolation.
Mitochondria enriched preparations from right hippocampus were made according to standard procedures (Jin et al., 2004; Sullivan et al., 2004, 2007). Briefly, hippocampal tissue was homogenized in 2 ml of ice-cold isolation buffer (215 mm mannitol, 75 mm sucrose, 0.1% BSA, 20 mm HEPES, and 1 mm EGTA, pH adjusted to 7.2 with KOH) and centrifuged twice at 1300 × g for 3 min at 4°C in an Eppendorf microcentrifuge. Each supernatant fraction was then topped off with isolation buffer and centrifuged at 13,000 × g for 10 min. The resultant pellet was then resuspended in 500 μl of isolation buffer and burst in a nitrogen cell disruption bomb (model 4639; Parr Instruments), at 4°C for 10 min at 1200 psi. The obtained crude mitochondrial fraction was then placed on a top of discontinuous Ficoll gradient (layered 2 ml of 7.5% Ficoll solution on top of 2 ml of 10% Ficoll solution) and centrifuged at 100,000 × g for 30 min using an ultracentrifuge (Beckman Coulter) as described previously (Lai and Clark, 1979; Sullivan et al., 2004). The mitochondrial pellet was suspended in isolation buffer (without EGTA), centrifuged for 10 min at 10,000 × g, and stored on ice until additional use for mitochondrial respiration assessment. The protein concentration was determined using the BCA protein assay kit by measuring absorbance at 560 nm with a Biotek Synergy HT plate reader.
Respiration measurement.
Mitochondrial respiration was assessed using a miniature Clark-type oxygen electrode (Hansatech Instruments) in a sealed, thermostatically controlled (at 37°C) and continuously stirred chamber as described previously (Sullivan et al., 2003). Approximately 75–100 μg of mitochondrial protein were added into the chamber containing 250 μl of KCl-based respiration buffer (125 mm KCl, 2 mm MgCl2,2.5 mm KH2PO4, 0.1% BSA, and 20 mm HEPES, pH 7.2) as described previously. State II respiration was initiated by the addition of oxidative substrates pyruvate (5 mm) and malate (2.5 mm). State III respiration was initiated by the addition of 150 μm ADP, followed by the addition of oligomycin (1 μm) to induce state intravenous respiration. The mitochondrial uncoupler carbonyl cyanide 4-(trifluoromethoxy) phenylhydrazone (1 μm) was added to the chamber to allow for quantification of complex I driven, maximum electron transport (state V). The complex I inhibitor rotenone (0.8 μm) was then added to the chamber, followed by the addition of succinate (10 mm) to allow for quantification of complex II driven maximum electron transport. The respiratory control ratio (RCR) was calculated by dividing state III respiration (presence of ADP) by state IV respiration (presence of 1 μm oligomycin and absence of ADP). The RCR is a very sensitive measure of “coupling” between electron transport (oxygen consumption during state III; in the presence of ADP) to proton leakage (indicated by state IV) across the inner mitochondrial membrane. Amount of protein extracted, state IIII mitochondrial respiration, and RCR are reported in this work, and other data are available on request.
Microarrays
The left hippocampal region was dissected from each subject and placed in cooled (0°C), 95% O2/5% CO2 (carbogen) gas-charged artificial CSF (aCSF) (in mm: 114 NaCl, 2 KCl, 8 MgCl2, 30 NaHCO3, 10 glucose, and 2 CaCl2) and transferred to a subdissection station. Here, the hippocampal region was placed in a chilled glass Petri dish and immersed in chilled (0°C) aCSF, and CA and DG regions were subdissected with a scalpel, stored separately in 1.5 ml of Eppendorf tubes, flash frozen on dry ice, and transferred to a −80°C freezer until additional. For each animal (n = 12), one hippocampal CA region and one hippocampal DG region were collected. Each tissue sample underwent RNA extraction, purification, and cDNA labeling separately, as described previously (Blalock et al., 2003, 2004; Rowe et al., 2007; Kadish et al., 2009), according to standard Affymetrix procedures. Labeled cDNA for each region from each subject was individually hybridized to recently developed rhesus Affymetrix microarray chips (Duan et al., 2007). Thus, for 12 animals in this study, there were 24 microarrays. Based on quality control assessments, including standard Affymetrix measures and residual sign analysis [Affy PLM (Bolstad et al., 2005)], one aged animal DG microarray (animal 669) was removed from the study for poor hybridization characteristics (scaling factor of 4.06, 47.57% present). Among the remaining 23 arrays, there were no significant differences in quality control parameters across age: scaling factor (young, 2.20 ± 0.10; aged, 2.23 ± 0.11); percentage present (young, 54.14 ± 0.47; aged, 53.98 ± 0.42).
Prestatistical filtering
The MAS5 probe level algorithm was applied using Gene Expression Console (version 1.1; Affymetrix), to generate signal intensity values and presence/absence calls for each probe set on each chip. Signal intensities >2 SD from the mean for each group were treated as missing values, and only probe sets/genes with “A”-grade annotation and more than three presence calls (gene expressed in more than three subjects) were retained for additional analysis (see Fig. 2). Values were transferred to Excel (2003; Microsoft), Bioconductor (Gentleman et al., 2004), and MultiExperiment Viewer (Saeed et al., 2003) for subsequent analysis. The Affymetrix rhesus GeneChip contains 52,865 probe sets. These were annotated using Affymetrix information, with 13,287 probe sets rated A-grade annotation (confirmed gene). Of these, 7623 were rated present (more than three presence calls) in our study and tested statistically. The complete dataset, including signal intensity, presence/absence calls, and .CEL files, is available for download from the Gene Expression Omnibus (accession number GSE11697).
Figure 2.
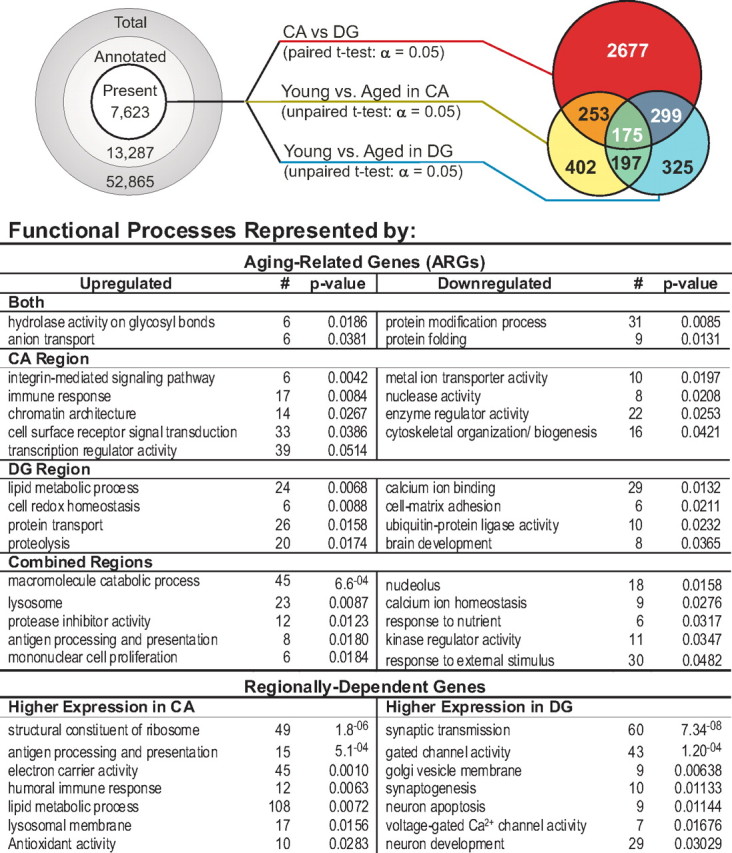
Transcriptional profiling of aging and regional effects. Filtering and statistical results. Left, Prestatistical filtering steps, based on annotation grade and presence/absence call status (see Materials and Methods), reduced the total number of probe sets to be tested statistically from >50,000 to 7623. Middle, A total of 7623 probe sets were tested as follows: paired t test contrasting CA with DG regions and combining young and aged subjects (red line); unpaired t tests contrasting young versus aged subjects in the CA (gold) or DG (blue) regions. Right, Venn diagram describing overlap among significant genes (α = 0.05) on each test. Bottom, Functional processes associated with identified genes were determined using DAVID overrepresentation analysis (see Materials and Methods). Functional processes are separated by region and direction of change with age, and the number of genes populating that process in DAVID and the probability of that number being found by chance are shown.
Statistics
Aging effects in CA and DG were assessed separately with nonpaired heteroschedastic two-tailed t tests between young and aged subjects. Age-group means, SEMs, direction of change, and p values are reported alphabetically for each gene found to differ significantly (α = 0.05) with age (supplemental Table 1, available at www.jneurosci.org as supplemental material). Because CA and DG brain regions were isolated from the same subjects, a paired, two-tailed t test was used to detect regional differences in expression (omitting CA tissue microarray for aged animal 669 because its paired partner DG microarray was removed because of poor quality; see above) (supplemental Table 2, available at www.jneurosci.org as supplemental material). Results for each t test analysis are interpreted in the context of multiple testing error by reporting the median FDR (Benjamini et al., 2001) for the overall test. Multiple testing error was assessed at the t test level, and other statistical procedures were performed post hoc. Similarity between aging transcriptional profiles in this nonhuman primate study and previous rodent aging studies (Blalock et al., 2003; Rowe et al., 2007; Kadish et al., 2009) was assessed using a binomial analysis procedure (Blalock et al., 2005; Norris et al., 2005) given by the following:
where n is the number of genes tested (all genes rated present in the four studies), x is the number of genes found to be significantly changed with age in both rodent and nonhuman primate studies (supplemental Table 3, available at www.jneurosci.org as supplemental material), and p is the probability of any gene being assigned to the overlap by chance was used. Using this procedure, a p value was calculated reflecting the probability that the number of genes found in the overlap could have arisen by chance. In addition, the MSI was tested for a significant correlation (α = 0.05, Pearson's test) with all genes identified as age related in the statistical aging comparisons (supplemental Table 4, available at www.jneurosci.org as supplemental material).
Functional process/pathway analysis
Gene lists were analyzed for significant overrepresentation of functional processes/pathways, as described previously (Blalock et al., 2004; Rowe et al., 2007; Kadish et al., 2009). Functional categorization was assessed using the DAVID (Database for Annotation, Visualization, and Integrated Discovery) overrepresentation clustering analysis tool (Dennis et al., 2003; Huang da et al., 2009) on the Gene Ontology Databases of Biological Process, Cellular Component, and Molecular Function (Ashburner et al., 2000). To reduce redundancy, only a single significant (α = 0.05) process/component/function populated by between 3 and 50 genes is reported for each cluster of similar overrepresented processes.
Results
Peripheral metabolic measures
Blood chemistry panels in young and aged monkeys were used to assess metabolic status (see Materials and Methods). Each blood panel variable was assessed individually for aging effects and extent of correlation with brain global gene expression. Of the serum measures, insulin and TGs showed significant aging effects in the rhesus monkeys, whereas HDL and chylomicrons showed near-significant effects, and glucose (p = 0.83) did not differ with age (Table 1). Somewhat surprisingly, triglyceride rather than insulin concentration exhibited the most robust serum effect of age (p = 0.00019) and was correlated with the most aging-related genes (ARGs) of any MSI component variable (data not shown). The actions of insulin in the liver can stimulate synthesis of TGs (Adeli et al., 2001), which have a longer half-life than insulin. Therefore, TG measures may provide a more accurate index of integrated cumulative insulin action over extended periods than single-point measures of insulin.
Table 1.
Measurements taken from blood (see Materials and Methods)
| Identification number | Insulin (μIU/ml) | Glucose (mg/dl) | HDL (mg/dl) | TG (mg/dl) | Chylomicron (mg/dl) |
|---|---|---|---|---|---|
| Young | |||||
| Y01 | 96.4 | 77 | 58.17 | 46 | 0.01 |
| Y04 | 116.0 | 95 | 54.64 | 86 | 0.09 |
| Y05 | 119.4 | 131 | 51.55 | 60 | 0.94 |
| Y08 | 48.6 | 62 | 52.67 | 82 | 0.22 |
| Y09 | 22.4 | 91 | 40.55 | 62 | 0.7 |
| Y12 | 25.0 | 86 | 55.45 | 46 | 0.83 |
| Aged | |||||
| A02 | 133.4 | 99 | 49.06 | 154 | 3.36 |
| A03 | 87.8 | 93 | 48.04 | 100 | 4.14 |
| A06 | 175.4 | 78 | 42.33 | 158 | 2.31 |
| A07 | 160.8 | 97 | 41.46 | 188 | 0.02 |
| A10 | 113.4 | 89 | 50.46 | 158 | 0.07 |
| A11 | 308.4 | 99 | 30.24 | 174 | 4.69 |
| Young | |||||
| Mean | 71.3 | 90 | 52.17 | 64 | 0.47 |
| ±SEM | ± 18.3 | ± 9 | ± 2.51 | ± 7 | ± 0.17 |
| Aged | |||||
| Mean | 163.2 | 93 | 43.60 | 155 | 2.43 |
| ±SEM | ± 31.8 | ± 3 | ± 3.06 | ± 12.24 | ± 0.82 |
| p values | 0.0366 | 0.8355 | 0.0565 | 0.0002 | 0.0622 |
Identification numbers are followed by raw measures for insulin, glucose, HDL (the sum of HDL1 and HDL2 measures), TG levels, and chylomicron levels. Below each set of measures, mean ± SEM and t test p values (unpaired heteroschedastic two-tailed) are reported.
Metabolic syndrome index
Because it is not known which MetS components are most closely associated with altered neural gene expression levels and other brain processes in humans, in the present study, we used an MSI comprising ranked and equally weighted contributions of three measures: triglyceride/HDL ratio, insulin/glucose ratio, and chylomicron concentration (Fig. 1a). Elevation of these measures reflects insulin resistance or atherogenic dyslipidemia associated with MetS, and related markers are widely used to evaluate onset of metabolic syndrome/diabetes (Reaven, 2005). Moreover, rhesus monkeys show an age-related elevation of similar metabolic markers (Tigno et al., 2004). There was a significant increase with age in insulin/glucose ratio, triglyceride/HDL ratio, and a trend for chylomicron density to increase with age, resulting in a highly significant aging-related increase in the consolidated MSI (Fig. 1a, far right) (p = 0.002). The consolidated MSI values were used for subsequent correlation analyses with microarray and mitochondrial functional variables. As noted, the variables comprising the MSI were selected to measure varying degrees of MetS development (and subsequent diabetes) in rhesus monkeys rather than to diagnose full-blown MetS.
Figure 1.
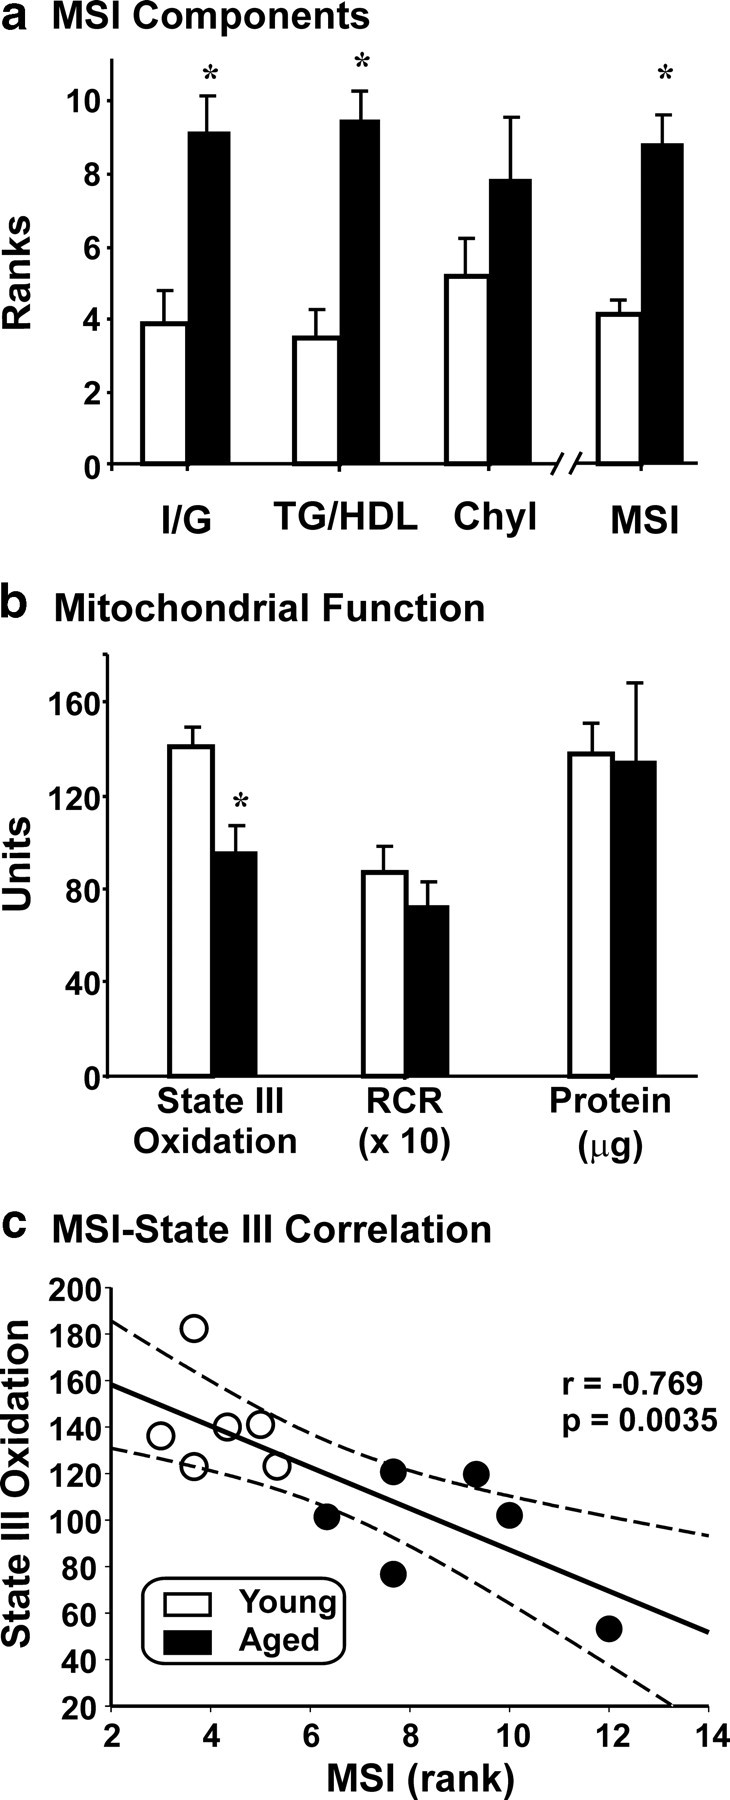
Age-dependent metabolic and mitochondrial measurements. a, Age-related changes in peripheral metabolic measures. Ranked averages are plotted on the y-axis and separated for each metabolic measure and by age along the x-axis. Insulin/glucose ratio significantly increased with age (p = 0.009), as did triglyceride/HDL ratio (p = 0.002), whereas chylomicrons (Chyl) did not (p = 0.24). The combined peripheral MSI (see Materials and Methods) was highly significantly increased with age (p = 0.002; Mann–Whitney rank sum tests). b, Decreased hippocampal mitochondrial function with age. Protein extracted, RCR (see Materials and Methods), and mitochondrial state III oxidation (nanomoles of [O] consumed per milligrams of mitochondrial protein) are plotted as a function of age. No significant differences in protein or RCR (10× values for illustration) were found. The age-related reduction in state III oxidation (37%) was highly significant (*p = 0.009, Student's t test). c, Correlation between MSI and hippocampal mitochondrial state III oxidation. MSI (x-axis) is plotted against state III oxidation (y-axis) for each subject. Pearson's test revealed a strong, significant negative correlation between the blood measures and the central measures of mitochondrial activity (p = 0.0035; dotted gray lines, 95% confidence intervals).
Hippocampal mitochondrial function
The right hippocampus was used to assess mitochondrial function (state III oxidation, protein, and RCR), according to previous protocols (see Materials and Methods) (Sullivan et al., 2007) (Fig. 1b). State III oxidation levels assess the oxidative capacity of mitochondrial extract by measuring production of ATP per unit extracted protein, whereas RCR is a sensitive measure of the coupling between electron transport and proton leakage. There was a significant, 37% age-related decrease in state III oxidation and no significant difference in RCR or protein yield. This suggests that the number (or activity) of functional mitochondria is decreased with age but that those remaining aged mitochondria maintain normal proton–electron coupling behavior.
Relationship between metabolic syndrome and hippocampal mitochondrial function
In the present work, hippocampal mitochondrial activity (Fig. 1b) and peripheral blood components reflecting MetS (Fig. 1a) both showed significant alteration with age. To determine whether an elevated MSI specifically predicted brain bioenergetic function, a correlation analysis was performed between the two variables. This demonstrated a highly significant negative correlation between magnitude of the MSI and mitochondrial oxidative function (Fig. 1c), suggesting close association of peripheral and brain functional variables.
Transcriptional profiling
The left CA and DG regions from each subject were subdissected apart (see Materials and Methods), and each region was processed separately on an individual microarray (two microarrays per subject, 12 subjects = 24 arrays). The newly developed Affymetrix rhesus gene expression microarray was used to quantitatively interrogate thousands of genes in parallel. To reduce multiple statistical testing of the >50,000 probe sets on the rhesus array and to focus on probes/genes with biological information and exclude redundant probes, we filtered data before statistical analysis (Fig. 2, top, left). Similar to previous studies (Blalock et al., 2003, 2004; Norris et al., 2005; Rowe et al., 2007; Kadish et al., 2009), only unique, A-grade annotated probe sets rated present were retained for statistical analysis (see Materials and Methods). To evaluate intrasubject variability, interquartile ranges and SEMs for each microarray were calculated. Overall, there was no significant difference in interquartile signal intensity range (1262.4 in young vs 1262.1 in aged) or SEM (30.24 in young vs 30.19 in aged) with age.
Three separate t tests were performed on the overall dataset. Young and aged subjects were collapsed for a paired t test across CA and DG regions, whereas two nonpaired t tests were used to test for aging effects separately within the CA and DG regions. The FDR, used to correct for the error of multiple testing and/or gauge the relative strength of findings (Benjamini et al., 2001; Reiner et al., 2003), was estimated for each of these tests, using a single type I error cutoff (α = 0.05). All tests appeared to provide good statistical confidence (FDRs of 0.02, 0.29, and 0.27, respectively) for a microarray analysis, in which added confidence derives from coregulation of related genes (Mirnics and Pevsner, 2004; Blalock et al., 2005). In the present work, it is clear that the regional test (CA vs DG) found many more genes than either the CA or DG aging tests (Fig. 2, top, right). However, it should be noted that the three tests were not equivalently powered. The regional test used the generally more powerful paired statistical design and used 22 arrays as opposed to the 11 used in the DG analysis and 12 in the CA analysis (see Materials and Methods). Nonetheless, test structure alone appears unlikely to explain the large differences in numbers of genes discovered.
Aging-related genes in CA and DG
Although several studies in rodents have examined aging-related gene expression changes in whole hippocampus (Verbitsky et al., 2004), dorsal hippocampus (Rowe et al., 2007), the CA1 region (Blalock et al., 2003; Burger et al., 2007; Kadish et al., 2009), and the DG region (Burger et al., 2008), none has quantitatively contrasted CA and DG in the same animals (Fig. 2). Here, genes whose expression differed significantly (α = 0.05) with age in either the CA or DG regions were defined as ARGs. These were categorized into the following three subsets: significantly different with age in (1) both regions (“both”), (2) selectively in the CA region (“CA”), and (3) selectively in DG (“DG”). Each subset of identified genes was separated into upregulated and downregulated categories. From a total of 7623 filtered gene candidates, the CA region showed 1027 (13.5%) significant ARGs, whereas the DG region showed 996 (13.1%). To determine whether the two regions showed alterations in a common subset of genes, we performed an “overlap” analysis between the ARG lists for the regions. In this analysis, if the genes altered with age in CA changed independently of those in DG, then the probability of common (overlapping) genes is given by the product of their independent probabilities (13.1% × 13.5% = 1.8%). Thus, by chance, 1.8% of the total candidate list (7623 × 1.8% = 135 genes) would be expected in the overlap. In fact, 372 genes were found to change with aging in both regions, nearly threefold more than expected by chance (p = 3.6−8, binomial test), indicating a strong common regulation of many genes in CA and DG. Bolstering this conclusion was the observation that all but 2 of the 372 overlapping genes (Rpl7 and Srcap) agreed in direction of change between the two regions. Furthermore, an overlap analysis of this type requires low p values in each list, resulting in substantial false negatives and likely underestimates actual overlap. All aging-related genes, regardless of region, are listed alphabetically by gene symbol and protein name in supplemental Table 1 (available at www.jneurosci.org as supplemental material), with mean expression values for age and region and other statistical data.
Functional pathways/processes represented by ARGs
Functional grouping analysis (DAVID; see Materials and Methods) was used to identify significantly overrepresented (α = 0.05) functional processes within CA and DG regional subsets of ARGs. Identified processes are shown in Figure 2 and, for the both-regions subset of ARGs, included increased hydrolase activity and anion transport and decreased protein modification and folding processes. Processes selectively overrepresented by ARGs identified in CA included a large immune response category. This confirms that, in the nonhuman primate, inflammatory/immune changes occur in the hippocampus with aging that are similar to those seen in white matter of monkeys (Duce et al., 2008) and the neocortex/hippocampus of aging humans (Lu et al., 2004; McGeer and McGeer, 2004; Parachikova et al., 2007) and aging rodents (Lee et al., 2000; Wyss-Coray and Mucke, 2002; Blalock et al., 2003; Mrak and Griffin, 2005; Burger et al., 2007; Gemma and Bickford, 2007; Rowe et al., 2007; Kadish et al., 2009). Other CA upregulated processes included the integrin pathway and cell surface receptor signaling, altered chromatin architecture (suggestive of long-term epigenetic modulation), and transcriptional regulation. Downregulated functional processes in CA included transporter, nuclease, and enzyme regulator activity, as well as an age-related decrease in components of the cytoskeletal system. In the DG region of the rhesus hippocampus, upregulated genes were significantly associated with pathways for lipolysis, proteolysis, redox reactions, and protein transport, whereas downregulated genes were associated with calcium homeostasis, extracellular matrix, ubiquitination, and brain development.
Regional differences in expression
Several studies have found that transcriptional profiles are highly discriminant among different brain regions (Lein et al., 2004; Xu et al., 2007; Zahn et al., 2007), and our results here support these observations for the CA and DG regions of the hippocampus (Lein et al., 2004; Greene et al., 2009). In fact, nearly half of all genes tested were found to be differentially expressed between the two regions at α = 0.05. To further elucidate regional differences in expression patterns, we also performed pathway analysis, identifying processes overrepresented by genes expressed more in CA or in DG (Fig. 2, bottom). Notably, the CA region showed greater expression than DG for genes associated with inflammatory responses and mitochondrial activity, mRNA translational capacity, lipid metabolism, and lysosomal degradation pathways, whereas the DG region exhibited greater expression of genes associated with synaptic activity, neuronal development, and apoptosis. These results suggest that the DG region may contain a more homogeneous population of cells that is predominately neuronal, whereas the CA region is more heterogeneous, containing a greater proportion of astrocytes, oligodendrocytes, and microglia. However, it is also highly likely that the regional signatures reflect processes associated with some of the unique properties of resident neuronal types, for example, the capacity of the DG granule neurons for adult neurogenesis and their unusually large mossy fiber terminals. The full list of regionally differentially expressed genes is given in supplemental Table 2 (available at www.jneurosci.org as supplemental material).
Agreement with previous rat aging studies
To test the possibility that transcriptional profiles associated with hippocampal aging in a long-lived nonhuman primate share some common patterns with those in a rat model of aging, we performed an overlap analysis of genes that changed with aging in both species (Fig. 3) (supplemental Table 3, available at www.jneurosci.org as supplemental material), comparing the present rhesus data with previous rat data that had been obtained in our laboratory using similar methods. Our three previous rat hippocampal aging studies (Blalock et al., 2003; Rowe et al., 2007; and Kadish et al., 2009) were combined for this comparison. Despite considerable differences in annotation, a list of 1541 unique, present, annotated probe sets common to the Affymetrix Rat RG-U34A, Rat RAE 230A, and rhesus microarrays was identified. Of these, 555 of the 1541 genes were found to have changed significantly in at least one of the rat studies, establishing a probability of 555 of 1541 (36%) for ARGs among genes expressed in the F344 rat hippocampus. In addition, 404 of the 1541 common genes were found to change with aging in at least one region in the present rhesus study, yielding an ARG probability of 404 of 1541 (26%). The probability that genes would be found to be similarly regulated in both species by chance is the product of their independent probabilities (36% for rat aging and 26% for rhesus aging, divided by two to account for directional agreement; 36% × 26% × 0.5 = 0.047). Thus, by chance, we would expect 72 genes (0.047 × 1541) to agree in direction between the two studies. However, the observed 101 commonly regulated genes (Fig. 3) are significantly greater than expected by chance (p = 3.8−4, binomial test), indicating that aging induces at least some common hippocampal transcriptional signatures across mammalian species.
Figure 3.

Overlap of rhesus and rat hippocampal aging transcriptional signatures. Results of three rat hippocampal aging studies were consolidated and contrasted with results from the present rhesus microarray analyses (see Materials and Methods). Top, A total of 555 of 1541 genes changed significantly with age (p ≤ 0.05) in at least one of the three rat aging studies, whereas 404 of 1541 genes were significant (p ≤ 0.05) in the rhesus study. *p = 3.8−4, the number of genes that were significant and agreed in direction of change in both the consolidated rat and the rhesus studies was significant (binomial test). Right, Representative upregulated and downregulated genes from the overlap illustrate examples of genes altered by age consistently across studies. Bottom, Number of genes found divided by number of genes expected (e.g., at a p value cutoff of 0.05, 101 were found and 72 were expected; see Results) among 1541 genes present across all studies is plotted (y-axis) as a function of varying α (p value cutoffs; x-axis). Note the sharp increase in found/expected at α = 0.05 (shaded).
Nevertheless, the overlap number (101 genes), although greater than chance, represented only a small proportion of the age-related genes and was weaker compared with the regional overlap analysis described above. As noted, the overlap number is likely a substantial underestimate. That is, the analysis sets a high criterion of confidence that genes must fulfill to be identified as overlapping (α = 0.05 in both species) and is therefore subject to high false-negative rates (Blalock et al., 2005). Consequently, we tested whether relaxing the p value criterion improved the overlap. However, although the number of overlapping genes inevitably increases with relaxed p values, the ratio of number of genes found in the overlap versus the number of genes expected in the overlap by chance showed a strong deflection toward chance values at p value cutoffs above 0.05. Therefore, reliability worsens rapidly at p values above 0.05 (Fig. 3, top), reducing confidence in the overlap list.
Apart from statistical considerations, a number of other factors could account for the relatively low overlap between ARGs in monkeys and rats, including the possibility that, in different species, aging changes in different molecular isoforms or slightly different pathways might have similar consequences. Another possibility is that different proportions of cellular components (e.g., neurons-to-glia) might obscure some cell-type-specific changes. Alternatively, aging changes in rat brain may not be a good model for changes in primate brain. However, the first possibility above gains support from the observation that there is substantial functional similarity between the hippocampal pathways that are upregulated and downregulated in the rhesus (Fig. 2, middle) and those upregulated and downregulated in the rat (Kadish et al., 2009, their Table 3). The analogous pathways in the different species are frequently populated by ARGs that are isoforms (e.g., Pdk3 in monkey, Pdk2 in rat) or that modulate related functions. Conversely, not all aging-related pathways in the rat show similar changes in the rhesus. For example, astrocyte reactivity and cholesterol transport genes, identified in rat hippocampus as ARGs (Blalock et al., 2003; Rowe et al., 2007), were not widely detected in the present study. Nevertheless, additional studies will be required to determine the extent of similarity in aging-related expression profiles across species.
Because the list of 101 overlapping genes is somewhat small for pathway analysis, examples of upregulated and downregulated overlapping genes that are representative of larger pathways are presented in Figure 3. The complete list of 101 common overlapping aging-related genes, as well as lists of genes changing exclusively in rat or rhesus aging, with expression data and statistical values is provided in supplemental Table 3 (available at www.jneurosci.org as supplemental material).
MSI correlations with hippocampal ARG expression
To identify age-related changes in gene expression associated with the peripheral metabolic index, we performed Pearson's correlation tests between the MSI and each ARG (Fig. 4). MSI-correlated ARGs were then grouped according to whether they changed with age within CA only, within DG only, or within both regions and were subdivided based on direction of correlation (positive or negative). The number of genes selectively regulated with age in each region category, followed by the percentage of the those genes also correlated with MSI in parentheses, was as follows: upregulated in both CA and DG regions, 90 (44.5%); downregulated in both CA and DG regions, 66 (39.2%); upregulated in CA region only, 255 (63.6%); downregulated in CA region, 199 (66.8%); upregulated in DG region only, 149 (47.5%); and downregulated in DG, 138 (39.4%). Among genes not identified as ARGs (5748), only 164 (3% of the total list) were significantly correlated with MSI, well below the 5% (p = 0.05) expected from the error of multiple testing. Therefore, MSI-correlated non-ARGs appear to be present primarily because of error from multiple testing and are not shown here. Complete lists of MSI-correlated ARGs organized by region are given in supplemental Table 4 (available at www.jneurosci.org as supplemental material).
Figure 4.
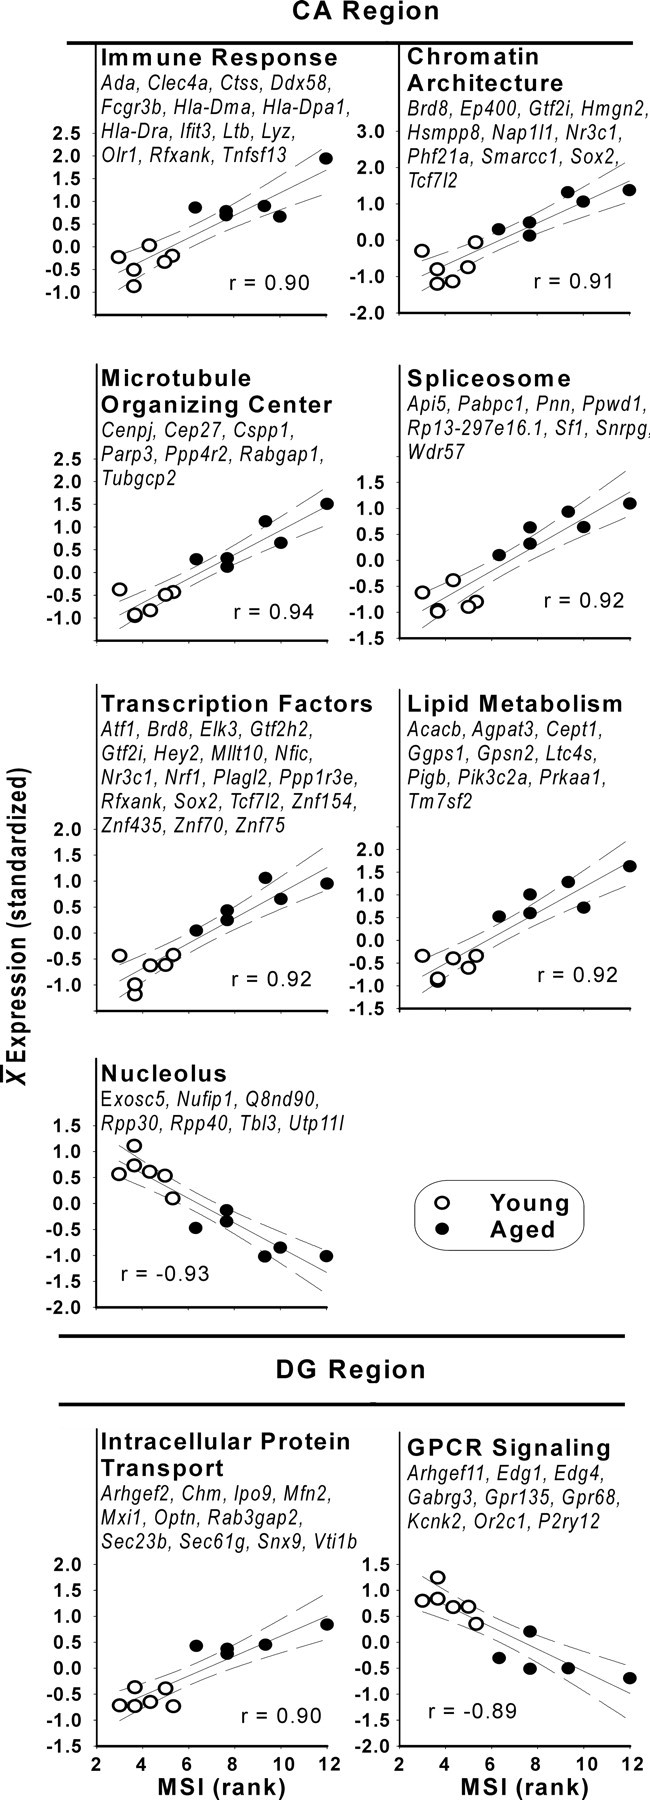
Functional processes overrepresented by MSI-correlated aging-related genes. Functional processes (with populating genes and p value for Fisher's exact test for overrepresentation) were identified from the list of MSI-correlated genes using DAVID overrepresentation analysis (see Materials and Methods) in both CA (top) and DG (bottom). To calculate an expression value for a functional process in a subject, each gene populating the process was individually standardized, and the average for all genes in that process was calculated for the subject. The standardized mean was plotted against the subject's MSI. Pearson's correlation value, linear fit (solid line), and 95% confidence intervals (dashed) are shown.
Because the MSI changed significantly with age, the two variables are not independent, and ARGs might be associated primarily with age, MSI, or some combination of the two. To clarify which genes were more closely linked to MSI, we have separately listed the MSI-correlated and MSI-noncorrelated ARGs (supplemental Table 4, available at www.jneurosci.org as supplemental material). MSI-noncorrelated ARGs are more likely to represent aging changes independent of MSI associations, whereas MSI-correlated ARGs are more likely to be linked to MetS variables. In addition, to further assess the degree to which aging affected ARGs independently of the MSI, we compared the young animal with the highest MSI score (Y4, MSI of 16) with the aged animal with the lowest MSI score (A10, MSI of 19). This two-animal comparison minimized MSI but not age differences. Consequently, if age played a major role apart from MSI in determining age changes, the direction of change from Y4 (young) to A10 (aged) should strongly agree with the group-level ARG direction of change (directional agreement). Conversely, if ARGs were more widely related to MSI, then the directional agreement should be weak. For the 1027 significant ARGs in the CA region (in which the most MSI correlations were found), the two-animal contrast strongly agreed with group-level data (86.5%; p = 1.24−133, binomial test). As a control comparison, directional agreement between the two-animal contrast and the 1027 least significant genes was at chance levels (52.2%; p > 0.05, binomial test). This comparison indicates that many ARGs are associated with aging independently of associations with MSI, although some ARGs have a more specific relationship to MetS variables.
Functional pathways/processes overrepresented by MSI-correlated ARGs
All categories of MSI-correlated ARGs were then subjected to functional process overrepresentation analysis, as was done for total ARGs. Figure 4 graphically displays the correlations of the MSI with the functional processes that met DAVID statistical criteria for overrepresentation (α = 0.05; see Materials and Methods) and lists the ARGs populating each identified process. To illustrate the patterns of correlation with functional processes, values of all MSI-correlated ARGs populating each identified functional process were standardized and averaged, and the correlations of averaged ARGs with the MSI are plotted in Figure 4.
MSI-correlated functional processes: CA region
The CA region contained numerically and proportionally more MSI-correlated ARGs than either the DG region or the both category (see above). Moreover, DAVID analysis identified many more pathways/processes in CA than DG that were MSI correlated, the preponderance of which were upregulated (Fig. 4). Of these, the immune response was identified prominently, consistent with its association with hyperinsulinemia (Craft, 2006). Also, a chromatin architecture category was prominently identified that contained multiple genes associated with epigenetic modification and histone acetyltransferase activity (Brd8, Ep400, Gtf2i, Hmgn2, Nap1l1, Nr3c1, and Phf21a), some responsive to blood hormones/constituents (Brd8, Gtf2i, and Nr3c1). This chromatin pathway category included Phf21a, a repressor of neuron-specific gene transcription that is upregulated in proliferating non-neuronal cells. Overall, the populating ARGs suggest that the source of these increases in epigenetic modification ARGs may be at least partly non-neuronal in origin. Furthermore, the spliceosome pathway (involved in removing introns from nascent mRNA) and transcriptional factor ARGs were also overrepresented (Fig. 4), both suggesting that increased biosynthesis/mRNA processing in hippocampus may be associated with MetS. The overrepresentations of microtubule organization and lipid synthesis pathways may reflect changes in cytoskeletal structure and plasma membrane organization/metabolism linked to the transcriptional alterations, whereas the downregulation of some nucleolar ARGs associated with tRNA and ribosomal RNA production (Exosc5, Q8nd90, Rpp30, Rpp40, Utp11) could represent adaptation of translational processes.
MSI-correlated glucocorticoid receptor/insulin signaling pathways: CA region
The observation that Nr3c1, the gene encoding the glucocorticoid receptor (GR), was upregulated with aging in CA (an ARG) and correlated with the MSI in CA prompted inspection of the gene lists for similarly regulated GR and insulin pathway ARGs. These two pathways exert opposing effects on many aspects of metabolism, and their efficacy ratio has been proposed to be important in brain aging (Landfield et al., 2007). Because the Gene Ontology and other functional grouping databases are works in progress, their gene-to-function associations are often incomplete in DAVID. Therefore, through literature search, we manually curated a separate cohort of MSI-correlated ARGs identified in CA that play important roles in the GR/insulin pathways. Along with Nr3c1 (alias GR), two downstream effectors known to be driven by GC signaling, Sgk (serum GC-regulated kinase) and Prkaa1/Ampk1 (5′-AMP-activated protein kinase catalytic subunit α-1), were also increased with age in CA and positively correlated with MSI. Furthermore, Grlf1 (GR DNA binding factor 1), a negative modulator of GR activity, was downregulated with age, suggesting the loss of a GR-suppressing mechanism. Concomitant downregulation of the insulin pathway is suggested by the increased expression of the insulin pathway negative regulator Igfbp5 (insulin-like growth factor binding protein 5), as well as the decreased expression of Akt3 (alias protein kinase B), which is a major downstream effector of the insulin pathway. For process correlation, these six CA ARGs were standardized and directions of change coordinated (values inverted for the two downregulated ARGs Grif1 and Akt3) such that they could be combined into a pathway that, when upregulated, reflected increased GC/insulin efficacy. Figure 5 graphically illustrates the substantial extent to which this GC/insulin ratio pathway correlated with MSI.
Figure 5.
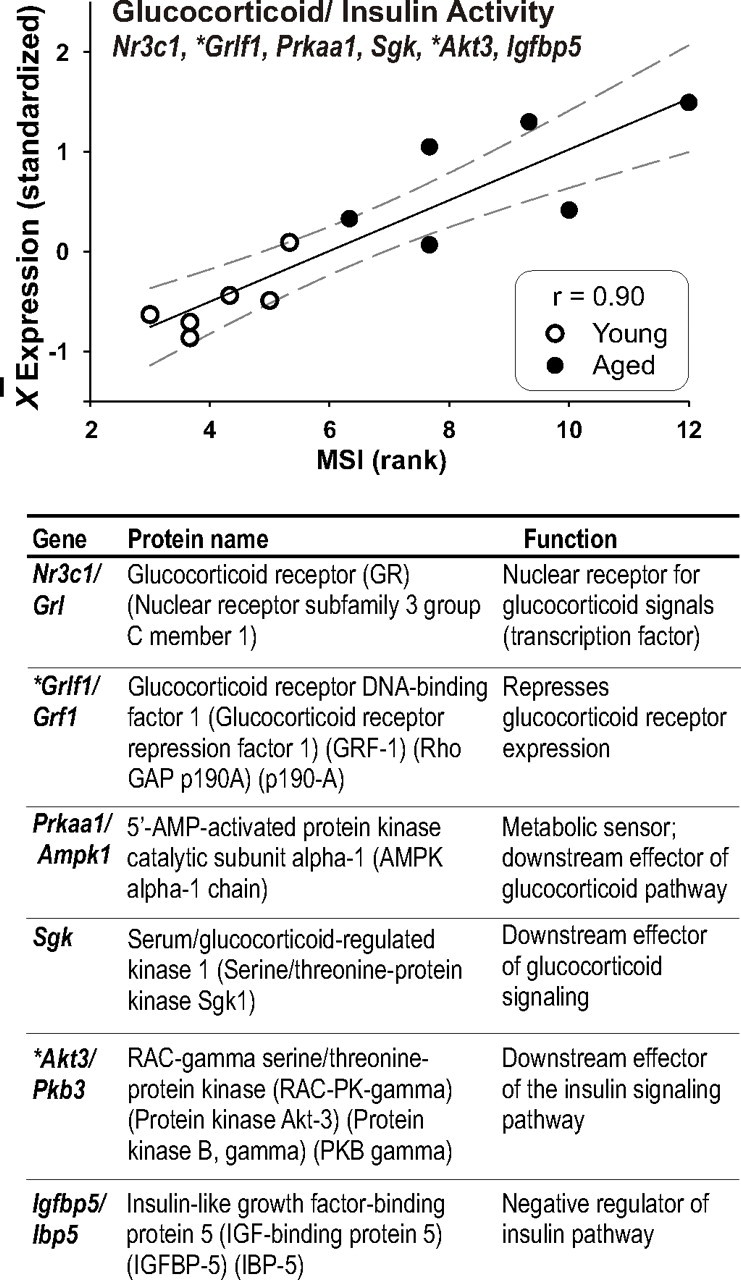
GC/insulin signaling strongly correlates with MSI in the CA region. Six aging-related genes associated with GC/stress and/or insulin/IGF1 signaling were used to construct a GC/insulin ratio that increases with elevated GC function and/or decreased insulin signaling. Top, Expression values for the six genes were averaged by subject [note that Grif, a downregulated repressor in the glucocorticoid pathway, and Akt3, a downregulated effector of the insulin pathway (*) were inverted before averaging]. The resulting GC/insulin ratio values correlated strongly (r = 0.9, Pearson's test) with the MSI. Bottom, Names and aliases of populating genes, as well as protein names and basic functions are listed.
MSI-correlated functional processes: DG region
Upregulated MSI-correlated pathways involved in protein transport (including Chm, Ipo9, Optn, Sec23b, Sec61 g, Snx9, and Vti1b) could reflect increased endoplasmic reticulum stress related to misfolded proteins transported through the endosomal pathway for degradation (Yoshida, 2007) or increased glial activation, among other possibilities. Furthermore, downregulated G-protein-coupled receptor signaling is consistent with patterns found previously in multiple studies of hippocampal aging in rats (Blalock et al., 2003; Kadish et al., 2009) but is also shown here to be pronounced in DG and to correlate with MetS.
MSI-correlated mitochondrial-related ARGs
Consistent with MSI-correlated mitochondrial dysfunction (Fig. 1b, bottom), multiple ARGs encoding mitochondrial proteins were correlated in CA with the MSI (Table 2). As was done for the GR pathway described above, this functional category was compiled manually. Genes were tagged as “mitochondrial” via three approaches: (1) association with mitochondria in the Cell Component section of the Gene Ontology Database; (2) classification in the recently published mammalian mitochondrial index of genes “MitoCarta” (Pagliarini et al., 2008); and (3) identification in PubMed searches. Compared with the DG, the CA region in general showed many more genes associated with mitochondrial function (Fig. 2) and correlated with MSI (Table 2). A number of downregulated mitochondrial genes, including Cmkt1b, Idh3b, Ndufa1, and Ogdh, suggest decreased tricarboxylic acid cycle activity and oxidation of carbohydrates. Furthermore, Pink1, which has been shown to protect mitochondria against oxidative stress (Pridgeon et al., 2007), was correlated with MSI and downregulated with age in both CA and DG (Table 2) (supplemental Table 1, available at www.jneurosci.org as supplemental material). Consistent with this were selective DG increases (supplemental Table 1, available at www.jneurosci.org as supplemental material) in the expression of mitochondrial-related genes associated with control of the fusion/fission ratio (Mfn2, Timm17a, Sels, Rab32, and Acp6) (Hiroyama and Takenawa, 1999).
Table 2.
Mitochondrial genes significantly (α = 0.05) correlated with MSI in the hippocampal CA region
| Upregulated with age in CA region | |
| Acaa2 | Acetyl-coenzyme A acyltransferase 2 |
| Bzrp | Benzodiazapine receptor (peripheral) |
| Chchd3 | Coiled-coil-helix-coiled-coil-helix domain containing 3 |
| Iars2 | Isoleucine-tRNA synthetase 2, mitochondrial |
| Mccc1 | Methylcrotonoyl-coenzyme A carboxylase 1 (alpha) |
| Rps15a | Ribosomal protein S15a |
| Sfxn5 | Sideroflexin 5 |
| Downregulated with age in CA region | |
| Ckmt1b | Creatine kinase, mitochondrial 1B |
| Gfm2 | G elongation factor, mitochondrial 2 |
| Hax1 | HCLS1 associated protein X-1 |
| Hspe1 | Heat shock 10 kDa protein 1 (chaperonin 10) |
| Idh3b | Isocitrate dehydrogenase 3 (NAD+) beta |
| Lrpprc | Leucine-rich PPR-motif containing |
| Mrp63 | Mitochondrial ribosomal protein 63 |
| Mtg1 | Mitochondrial GTPase 1 homolog (Saccharomyces cerevisiae) |
| Ndufa1 | NADH dehydrogenase (ubiquinone) 1 alpha subcomplex, 1, 7.5 kDa |
| Ndufb10 | NADH dehydrogenase (ubiquinone) 1 beta subcomplex, 10, 22 kDa |
| Ogdh | Oxoglutarate (α -ketoglutarate) dehydrogenase (lipoamide) |
| Pink1 | PTEN induced putative kinase 1 |
| Prdx5 | Peroxiredoxin 5 |
| Rexo1 | REX1, RNA exonuclease 1 homolog (S. cerevisiae) |
| Sfxn1 | Sideroflexin 1 |
| Shmt2 | Serine hydroxymethyltransferase 2 (mitochondrial) |
| Timm10 | Translocase of inner mitochondrial membrane 10 homolog (yeast) |
| Timm17b | Translocase of inner mitochondrial membrane 17 homolog B (yeast) |
| Tomm40l | Translocase of outer mitochondrial membrane 40 homolog-like (yeast) |
| Trak1 | Trafficking protein, kinesin binding 1 |
Discussion
This is the first study to identify quantitative associations between genome-wide brain expression profiles and peripheral MetS symptom variables. Given the wide-angle resolving power of microarray analysis, the data provide a uniquely comprehensive perspective on hippocampal pathways that may well be linked functionally to the progression of MetS components. Furthermore, the present work may complement other recent studies relating peripheral measures (diabetes and obesity) with central measures (brain imaging) (Raji et al., 2010). The results also reveal associations between brain gene expression and metabolic status that may reflect differential aging and vulnerability in specific regions of the hippocampal formation.
Hippocampal mitochondrial function and MetS variables with aging
Many studies have found neuronal mitochondrial dysfunction with aging or neurodegenerative conditions, often linked to oxidative stress/inflammatory responses (Gibson et al., 2000; Smith et al., 2000; Blalock et al., 2003; Sullivan et al., 2003; Brown et al., 2004; Toescu and Verkhratsky, 2004; Gemma and Bickford, 2007; Brinton, 2008; Simpkins et al., 2008), and a few have found neuronal mitochondrial alterations related to diabetes (Verkhratsky and Fernyhough, 2008). In addition, the present study showed that decreased mitochondrial function in hippocampus was correlated quantitatively with an index of MetS variables (Fig. 1c), indicating that peripheral MetS-related variables are associated with brain energy dyshomeostasis (with the caveat that anesthetic agents used here might interact with age or metabolic status to influence mitochondrial measures; see Materials and Methods). Furthermore, changes in numerous aging-related genes in CA or DG encoding mitochondrial proteins were correlated with MSI (Table 2). These mitochondrial ARGs included Pink1, which plays an important role in protecting cells against oxidative stress and apoptosis (Pridgeon et al., 2007). Clearly, however, additional research will be needed to clarify interactions of peripheral MetS variables with mitochondrial function in hippocampus.
Comparisons across brain regions and species
Independently of aging (i.e., combining age groups), nearly 40% of annotated genes showed significantly different expression in CA versus DG, and the pathways represented by regional expression profiles also differed (Fig. 2, bottom). Similar CA versus DG microarray comparisons have been performed in rodents (Lein et al., 2004; Xu et al., 2007; Greene et al., 2009). However, it is unclear whether these regional differences reflect cell packing density, different proportions of glial versus neuronal components, or unique properties of predominant cell types (e.g., capacity for neurogenesis and large mossy fiber terminals of granule cells), among other possibilities. Additional analyses will be needed to separate these contributions, as well as to determine the influence of several other relevant factors, including localization along the dorsoventral axis (Moser and Moser, 1998; Leonardo et al., 2006) and hemispheric lateralization (Shen et al., 2005).
The present study is also the first to analyze aging-related changes in global gene expression in the hippocampal formation of a nonhuman primate, complementing recent genome-wide studies assessing aging changes in neocortex (Fraser, et al., 2005; Duce et al., 2008; Loerch et al., 2008; Bishop et al., 2010). There were pronounced differences in aging changes between the CA and the DG regions of rhesus monkeys (Fig. 2, middle). A similar number of ARGs were identified in both regions, but the functional pathways represented by ARGs in each region differed considerably (see Results) (Fig. 2, middle). Notably, we also found that substantially more ARGs in CA than in DG were correlated with MSI (Fig. 4). The CA pyramidal neurons and the DG granule neurons show somewhat distinct patterns of electrophysiological and cellular/molecular changes with aging (deToledo-Morrell et al., 1988; Burke and Barnes, 2006; Disterhoft and Oh, 2007; Foster, 2007; Thibault et al., 2007). Moreover, the CA is substantially more vulnerable to age-dependent neurodegeneration in Alzheimer's disease or ischemic insult (Arriagada et al., 1992; Braak et al., 1998; Mattson et al., 1999; McEwen, 2000), whereas the DG more prominently manifests some imaging/vascular changes with age (Small et al., 2004). Based on findings here, it appears possible that some of the selective age-dependent vulnerability of CA neurons may arise from metabolic alterations associated with MetS-related variables (Figs. 4, 5), as discussed below.
To determine whether hippocampal aging changes in rhesus are similar to those in rodents, we compared present results with our previous work in rats (see also Bishop et al., 2010). Although aging changes in genome-wide expression have been characterized in several studies of rodent brain (Prolla, 2002; Burger et al., 2007, 2008; Zahn et al., 2007; Haberman et al., 2009), methodological, design, or platform differences make it difficult to compare those results against the present study. However, we compared the rhesus data against three rat hippocampal microarray studies from our group using similar approaches (Blalock et al., 2003; Rowe et al., 2007; Kadish et al., 2009). An overlap analysis showed more of the same specific genes changed with aging in both rat and nonhuman primate hippocampus than expected by chance (see Results) (Fig. 3), but the degree of overlap, although significant, was relatively small, as also seen previously in rodent-primate comparisons (Loerch et al., 2008; Bishop et al., 2010). Apart from statistical factors resulting in false negatives, several other reasons might account for this low overlap of specific ARGs, including that different molecular isoforms participating in similar pathways may be affected by aging in different species (e.g., Pdk3 in rhesus, Pdk2 in rats) (Kadish et al., 2009). This appears consistent with the observation that many analogous pathways appear to be altered with aging in rhesus monkeys (Fig. 2) and rats (Kadish et al., 2009, their Table 3). Another possibility is that different proportions of neuronal and glial components between species might result in dilution and nondetection of some cell-type-specific signals. This might account for the weak astrocyte reactivity signals in rhesus hippocampus (Fig. 2) compared with the rat studies. Alternatively, the rat may not be a good model for some important aspects of primate brain aging. Additional studies will clearly be needed to resolve these complex questions.
MSI-associated pathways in CA: immune/inflammation
Upregulation of inflammatory/immune responses has been seen in multiple studies of brain aging/AD (see the references above), but its link to metabolic status is poorly understood. However, elevated insulin can induce immune molecules in brain (Fishel et al., 2005; Craft, 2006, 2007), and the data here show that the hippocampal immune response is correlated with MetS variables, including hyperinsulinemia, in aging monkeys. Notably, the MSI-correlated immune response in monkey CA was characterized by a predominance of class II antigen presenting molecules (Fig. 4, top), generally associated with microglial activation in the brain (Sloane et al., 1999; Benveniste et al., 2001; Nakanishi, 2003). A similar upregulation of antigen-presenting molecules is seen in rat hippocampus during a midlife period associated with cognitive impairment (Kadish et al., 2009). Thus, upregulation of antigen presenting molecules may play an important part in normal brain aging.
MSI-associated pathways in CA: GR signaling and chromatin modification
GC actions on the brain have long been suspected of a role in brain aging, cognitive dysfunction, and AD. However, except under conditions of chronic stress (Eldridge et al., 1989), aging-related upregulation of brain GR has not been observed previously. Most studies of GR in brain aging have been conducted in rodents (De Kloet et al., 1998; McEwen et al., 1999; Sapolsky, 1999), but the present data suggest that, in some primates, MetS variables during aging may be associated with elevated hippocampal GR. Results here show that the GR gene (Nr3c1) and several of its target genes (Prkaa1, Sgk) were upregulated in CA with aging and were associated with MSI, whereas the GR repressor Grlf1 and the major insulin pathway effector Akt3 were downregulated with aging (Fig. 5). Interestingly, the GR target Prkaa1/Ampk encodes the AMP-activated kinase (AMPK) that acts as a fuel sensor. When ATP is low, AMPK activity and expression are upregulated, decreasing glucose oxidation and increasing lipolysis and fatty acid oxidation (Lage et al., 2008), thus contributing to mitochondrial dysfunction (Leverve et al., 2003; Rossmeisl et al., 2004; Kiens, 2006; Reznick and Shulman, 2006). Given that the metabolic actions of GCs and insulin are frequently antagonistic, these findings raise the striking possibility that upregulated GR signaling (perhaps coupled with decreased insulin signaling) plays an important role in MetS-associated changes in brain metabolic function.
Our data also show that MSI was closely correlated with several eukaryotic homologs (e.g., Brd8 and Ep400) of key molecules of the yeast NuA4 histone acetyltransferase (HAT) complex, which functions as an epigenetic coactivator for nuclear receptors (Doyon et al., 2004). The MSI also was associated with other genes encoding chromatin-modifying enzymes that favor transcription (Hmgn2, Nap1l1, and Smarcc1) and with a glial-specific repressor of neuronal genes (Phf21) (Fig. 4). The GR is among the nuclear receptors that recruit NuA4 as a coactivator (Wallberg et al., 1999), and stress exposure can induce long-lasting epigenetic regulation of brain GR (Meaney et al., 2007). Therefore, the upregulation of HAT complex molecules seen here might provide epigenetic support of GR-mediated transcription.
Together, the data suggest a new model of MetS component interactions with brain aging processes, in which MetS-related variables induce upregulated GR transcription/signaling in hippocampus, triggering metabolic alterations that lead to mitochondrial dysfunction, inflammatory responses, enhanced vulnerability, and impaired cognition, as outlined in Figure 6. Although other models may of course fit the data, the present results provide a comprehensive framework that should facilitate generating and testing complex models on the mechanisms and treatment of unhealthy cognitive aging.
Figure 6.
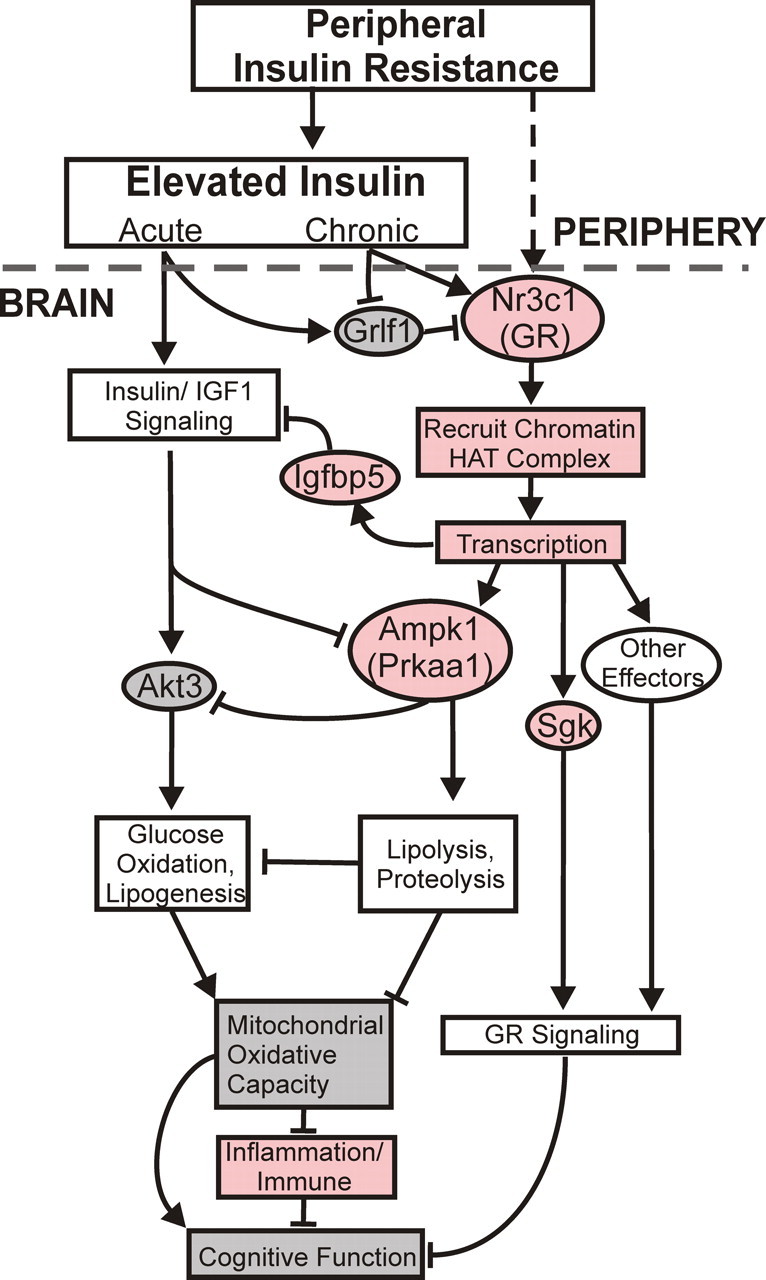
Schematic model of putative MetS-induced alterations in glucocorticoid receptor/insulin signaling in the brain. Left, Acutely elevated peripheral insulin activates brain insulin signaling pathways mediated in part by AKT3, which increases glucose uptake and oxidation via mitochondrial oxidative processes, in turn enhancing cognitive function. Right, Abnormal peripheral metabolism (e.g., chronic hyperinsulinemia) associated with peripheral insulin resistance induces upregulation of the GR gene (Nr3c1) in hippocampus, which then recruits histone acetyltransferase complexes to chromatin to facilitate transcription of multiple GR targets, including Ampk1 and Sgk. Increased hippocampal expression of Ampk favors lipolysis and free fatty acid oxidation and blocks AKT-mediated glucose utilization. This results in decreased mitochondrial function, thereby activating inflammatory/immune pathways. Inflammation and reduced mitochondrial function combine with other GR-activated pathways to impair cognition and elevate risk of AD. Genes and processes found correlated with MSI in the present study are coded in light red if upregulated or gray if downregulated. Decreased cognitive function is inferred from the literature.
Footnotes
This work was supported by National Institutes of Health Grants AG010836, AG013494, AG020251, NS048191, and AG029268. We thank Dr. Don Gash for generous support and discussion and Jelena Popovic for bioinformatics assistance and data handling.
References
- Adeli K, Taghibiglou C, Van Iderstine SC, Lewis GF. Mechanisms of hepatic very low-density lipoprotein overproduction in insulin resistance. Trends Cardiovasc Med. 2001;11:170–176. doi: 10.1016/s1050-1738(01)00084-6. [DOI] [PubMed] [Google Scholar]
- Andersen AH, Zhang Z, Zhang M, Gash DM, Avison MJ. Age-associated changes in rhesus CNS composition identified by MRI. Brain Res. 1999;829:90–98. doi: 10.1016/s0006-8993(99)01343-8. [DOI] [PubMed] [Google Scholar]
- Arriagada PV, Growdon JH, Hedley-Whyte ET, Hyman BT. Neurofibrillary tangles but not senile plaques parallel duration and severity of Alzheimer's disease. Neurology. 1992;42:631–639. doi: 10.1212/wnl.42.3.631. [DOI] [PubMed] [Google Scholar]
- Ashburner M, Ball CA, Blake JA, Botstein D, Butler H, Cherry JM, Davis AP, Dolinski K, Dwight SS, Eppig JT, Harris MA, Hill DP, Issel-Tarver L, Kasarskis A, Lewis S, Matese JC, Richardson JE, Ringwald M, Rubin GM, Sherlock G. Gene ontology: tool for the unification of biology. The Gene Ontology Consortium. Nat Genet. 2000;25:25–29. doi: 10.1038/75556. [DOI] [PMC free article] [PubMed] [Google Scholar]
- Benjamini Y, Drai D, Elmer G, Kafkafi N, Golani I. Controlling the false discovery rate in behavior genetics research. Behav Brain Res. 2001;125:279–284. doi: 10.1016/s0166-4328(01)00297-2. [DOI] [PubMed] [Google Scholar]
- Benveniste EN, Nguyen VT, O'Keefe GM. Immunological aspects of microglia: relevance to Alzheimer's disease. Neurochem Int. 2001;39:381–391. doi: 10.1016/s0197-0186(01)00045-6. [DOI] [PubMed] [Google Scholar]
- Berchtold NC, Cribbs DH, Coleman PD, Rogers J, Head E, Kim R, Beach T, Miller C, Troncoso J, Trojanowski JQ, Zielke HR, Cotman CW. Gene expression changes in the course of normal brain aging are sexually dimorphic. Proc Natl Acad Sci U S A. 2008;105:15605–15610. doi: 10.1073/pnas.0806883105. [DOI] [PMC free article] [PubMed] [Google Scholar]
- Biessels GJ, ter Laak MP, Hamers FP, Gispen WH. Neuronal Ca2+ disregulation in diabetes mellitus. Eur J Pharmacol. 2002;447:201–209. doi: 10.1016/s0014-2999(02)01844-7. [DOI] [PubMed] [Google Scholar]
- Bishop NA, Lu T, Yankner BA. Neural mechanisms of ageing and cognitive decline. Nature. 2010;464:529–535. doi: 10.1038/nature08983. [DOI] [PMC free article] [PubMed] [Google Scholar]
- Bizon JL, LaSarge CL, Montgomery KS, McDermott AN, Setlow B, Griffith WH. Spatial reference and working memory across the lifespan of male Fischer 344 rats. Neurobiol Aging. 2009;30:646–655. doi: 10.1016/j.neurobiolaging.2007.08.004. [DOI] [PMC free article] [PubMed] [Google Scholar]
- Blalock EM, Chen KC, Sharrow K, Herman JP, Porter NM, Foster TC, Landfield PW. Gene microarrays in hippocampal aging: statistical profiling identifies novel processes correlated with cognitive impairment. J Neurosci. 2003;23:3807–3819. doi: 10.1523/JNEUROSCI.23-09-03807.2003. [DOI] [PMC free article] [PubMed] [Google Scholar]
- Blalock EM, Geddes JW, Chen KC, Porter NM, Markesbery WR, Landfield PW. Incipient Alzheimer's disease: microarray correlation analyses reveal major transcriptional and tumor suppressor responses. Proc Natl Acad Sci U S A. 2004;101:2173–2178. doi: 10.1073/pnas.0308512100. [DOI] [PMC free article] [PubMed] [Google Scholar]
- Blalock EM, Chen KC, Stromberg AJ, Norris CM, Kadish I, Kraner SD, Porter NM, Landfield PW. Harnessing the power of gene microarrays for the study of brain aging and Alzheimer's disease: statistical reliability and functional correlation. Ageing Res Rev. 2005;4:481–512. doi: 10.1016/j.arr.2005.06.006. [DOI] [PubMed] [Google Scholar]
- Bolstad BM, Collin F, Brettschneider J, Simpson K, Cope L, Irizarry R, Speed TP. Quality assessment of Affymetrix GeneChip data. In: Gentleman R, Carey V, Huber W, Irizarry R, Dudoit S, editors. Bioinformatics and computational biology solutions using R and Bioconductor. New York: Springer; 2005. [Google Scholar]
- Braak H, Braak E, Bohl J, Bratzke H. Evolution of Alzheimer's disease related cortical lesions. J Neural Transm Suppl. 1998;54:S97–S106. doi: 10.1007/978-3-7091-7508-8_9. [DOI] [PubMed] [Google Scholar]
- Brinton RD. The healthy cell bias of estrogen action: mitochondrial bioenergetics and neurological implications. Trends Neurosci. 2008;31:529–537. doi: 10.1016/j.tins.2008.07.003. [DOI] [PMC free article] [PubMed] [Google Scholar]
- Brown MR, Geddes JW, Sullivan PG. Brain region-specific, age-related, alterations in mitochondrial responses to elevated calcium. J Bioenerg Biomembr. 2004;36:401–406. doi: 10.1023/B:JOBB.0000041775.10388.23. [DOI] [PubMed] [Google Scholar]
- Bugger H, Abel ED. Molecular mechanisms for myocardial mitochondrial dysfunction in the metabolic syndrome. Clin Sci (Lond) 2008;114:195–210. doi: 10.1042/CS20070166. [DOI] [PubMed] [Google Scholar]
- Burger C, López MC, Feller JA, Baker HV, Muzyczka N, Mandel RJ. Changes in transcription within the CA1 field of the hippocampus are associated with age-related spatial learning impairments. Neurobiol Learn Mem. 2007;87:21–41. doi: 10.1016/j.nlm.2006.05.003. [DOI] [PubMed] [Google Scholar]
- Burger C, Lopez MC, Baker HV, Mandel RJ, Muzyczka N. Genome-wide analysis of aging and learning-related genes in the hippocampal dentate gyrus. Neurobiol Learn Mem. 2008;89:379–396. doi: 10.1016/j.nlm.2007.11.006. [DOI] [PMC free article] [PubMed] [Google Scholar]
- Burke SN, Barnes CA. Neural plasticity in the ageing brain. Nat Rev Neurosci. 2006;7:30–40. doi: 10.1038/nrn1809. [DOI] [PubMed] [Google Scholar]
- Cai JX, Arnsten AF. Dose-dependent effects of the dopamine D1 receptor agonists A77636 or SKF81297 on spatial working memory in aged monkeys. J Pharmacol Exp Ther. 1997;283:183–189. [PubMed] [Google Scholar]
- Craft S. Insulin resistance syndrome and Alzheimer disease: pathophysiologic mechanisms and therapeutic implications. Alzheimer Dis Assoc Disord. 2006;20:298–301. doi: 10.1097/01.wad.0000213866.86934.7e. [DOI] [PubMed] [Google Scholar]
- Craft S. Insulin resistance and Alzheimer's disease pathogenesis: potential mechanisms and implications for treatment. Curr Alzheimer Res. 2007;4:147–152. doi: 10.2174/156720507780362137. [DOI] [PubMed] [Google Scholar]
- Deadwyler SA, Porrino L, Siegel JM, Hampson RE. Systemic and nasal delivery of orexin-A (Hypocretin-1) reduces the effects of sleep deprivation on cognitive performance in nonhuman primates. J Neurosci. 2007;27:14239–14247. doi: 10.1523/JNEUROSCI.3878-07.2007. [DOI] [PMC free article] [PubMed] [Google Scholar]
- De Kloet ER, Vreugdenhil E, Oitzl MS, Joëls M. Brain corticosteroid receptor balance in health and disease. Endocr Rev. 1998;19:269–301. doi: 10.1210/edrv.19.3.0331. [DOI] [PubMed] [Google Scholar]
- Dennis G, Jr, Sherman BT, Hosack DA, Yang J, Gao W, Lane HC, Lempicki RA. DAVID: database for annotation, visualization, and integrated discovery. Genome Biol. 2003;4:P3. [PubMed] [Google Scholar]
- deToledo-Morrell L, Geinisman Y, Morrell F. Age-dependent alterations in hippocampal synaptic plasticity: relation to memory disorders. Neurobiol Aging. 1988;9:581–590. doi: 10.1016/s0197-4580(88)80117-9. [DOI] [PubMed] [Google Scholar]
- Dickey CA, Loring JF, Montgomery J, Gordon MN, Eastman PS, Morgan D. Selectively reduced expression of synaptic plasticity-related genes in amyloid precursor protein + presenilin-1 transgenic mice. J Neurosci. 2003;23:5219–5226. doi: 10.1523/JNEUROSCI.23-12-05219.2003. [DOI] [PMC free article] [PubMed] [Google Scholar]
- Ding SY, Tigno XT, Hansen BC. Nuclear magnetic resonance-determined lipoprotein abnormalities in nonhuman primates with the metabolic syndrome and type 2 diabetes mellitus. Metabolism. 2007;56:838–846. doi: 10.1016/j.metabol.2007.01.015. [DOI] [PubMed] [Google Scholar]
- Disterhoft JF, Oh MM. Alterations in intrinsic neuronal excitability during normal aging. Aging Cell. 2007;6:327–336. doi: 10.1111/j.1474-9726.2007.00297.x. [DOI] [PubMed] [Google Scholar]
- Doyon Y, Selleck W, Lane WS, Tan S, Côté J. Structural and functional conservation of the NuA4 histone acetyltransferase complex from yeast to humans. Mol Cell Biol. 2004;24:1884–1896. doi: 10.1128/MCB.24.5.1884-1896.2004. [DOI] [PMC free article] [PubMed] [Google Scholar]
- Duan F, Spindel ER, Li YH, Norgren RB., Jr Intercenter reliability and validity of the rhesus macaque GeneChip. BMC Genomics. 2007;8:61. doi: 10.1186/1471-2164-8-61. [DOI] [PMC free article] [PubMed] [Google Scholar]
- Duce JA, Podvin S, Hollander W, Kipling D, Rosene DL, Abraham CR. Gene profile analysis implicates Klotho as an important contributor to aging changes in brain white matter of the rhesus monkey. Glia. 2008;56:106–117. doi: 10.1002/glia.20593. [DOI] [PubMed] [Google Scholar]
- Eldridge JC, Brodish A, Kute TE, Landfield PW. Apparent age-related resistance of type II hippocampal corticosteroid receptors to down-regulation during chronic escape training. J Neurosci. 1989;9:3237–3242. doi: 10.1523/JNEUROSCI.09-09-03237.1989. [DOI] [PMC free article] [PubMed] [Google Scholar]
- Fishel MA, Watson GS, Montine TJ, Wang Q, Green PS, Kulstad JJ, Cook DG, Peskind ER, Baker LD, Goldgaber D, Nie W, Asthana S, Plymate SR, Schwartz MW, Craft S. Hyperinsulinemia provokes synchronous increases in central inflammation and beta-amyloid in normal adults. Arch Neurol. 2005;62:1539–1544. doi: 10.1001/archneur.62.10.noc50112. [DOI] [PubMed] [Google Scholar]
- Foster TC. Calcium homeostasis and modulation of synaptic plasticity in the aged brain. Aging Cell. 2007;6:319–325. doi: 10.1111/j.1474-9726.2007.00283.x. [DOI] [PubMed] [Google Scholar]
- Fraser HB, Khaitovich P, Plotkin JB, Pääbo S, Eisen MB. Aging and gene expression in the primate brain. PLoS Biol. 2005;3:e274. doi: 10.1371/journal.pbio.0030274. [DOI] [PMC free article] [PubMed] [Google Scholar]
- Gemma C, Bickford PC. Interleukin-1beta and caspase-1: players in the regulation of age-related cognitive dysfunction. Rev Neurosci. 2007;18:137–148. doi: 10.1515/revneuro.2007.18.2.137. [DOI] [PubMed] [Google Scholar]
- Gentleman RC, Carey VJ, Bates DM, Bolstad B, Dettling M, Dudoit S, Ellis B, Gautier L, Ge Y, Gentry J, Hornik K, Hothorn T, Huber W, Iacus S, Irizarry R, Leisch F, Li C, Maechler M, Rossini AJ, Sawitzki G, Smith C, Smyth G, Tierney L, Yang JY, Zhang J. Bioconductor: open software development for computational biology and bioinformatics. Genome Biol. 2004;5:R80. doi: 10.1186/gb-2004-5-10-r80. [DOI] [PMC free article] [PubMed] [Google Scholar]
- Gibson GE, Haroutunian V, Zhang H, Park LC, Shi Q, Lesser M, Mohs RC, Sheu RK, Blass JP. Mitochondrial damage in Alzheimer's disease varies with apolipoprotein E genotype. Ann Neurol. 2000;48:297–303. [PubMed] [Google Scholar]
- Ginsberg SD, Che S, Counts SE, Mufson EJ. Single cell gene expression profiling in Alzheimer's disease. NeuroRx. 2006;3:302–318. doi: 10.1016/j.nurx.2006.05.007. [DOI] [PMC free article] [PubMed] [Google Scholar]
- Gore AC, Terasawa E. A role for norepinephrine in the control of puberty in the female rhesus monkey, Macaca mulatta. Endocrinology. 1991;129:3009–3017. doi: 10.1210/endo-129-6-3009. [DOI] [PubMed] [Google Scholar]
- Greene JG, Borges K, Dingledine R. Quantitative transcriptional neuroanatomy of the rat hippocampus: evidence for wide-ranging, pathway-specific heterogeneity among three principal cell layers. Hippocampus. 2009;19:253–264. doi: 10.1002/hipo.20502. [DOI] [PMC free article] [PubMed] [Google Scholar]
- Gustafson D. Adiposity indices and dementia. Lancet Neurol. 2006;5:713–720. doi: 10.1016/S1474-4422(06)70526-9. [DOI] [PubMed] [Google Scholar]
- Haberman RP, Colantuoni C, Stocker AM, Schmidt AC, Pedersen JT, Gallagher M Advance online publication. Prominent hippocampal CA3 gene expression profile in neurocognitive aging. Neurobiol Aging. 2009 doi: 10.1016/j.neurobiolaging.2009.10.005. [DOI] [PMC free article] [PubMed] [Google Scholar]
- Hampson RE, Simeral JD, Deadwyler SA. Distribution of spatial and nonspatial information in dorsal hippocampus. Nature. 1999;402:610–614. doi: 10.1038/45154. [DOI] [PubMed] [Google Scholar]
- Hampson RE, Espana RA, Rogers GA, Porrino LJ, Deadwyler SA. Mechanisms underlying cognitive enhancement and reversal of cognitive deficits in nonhuman primates by the ampakine CX717. Psychopharmacology (Berl) 2009;202:355–369. doi: 10.1007/s00213-008-1360-z. [DOI] [PMC free article] [PubMed] [Google Scholar]
- Hiroyama M, Takenawa T. Isolation of a cDNA encoding human lysophosphatidic acid phosphatase that is involved in the regulation of mitochondrial lipid biosynthesis. J Biol Chem. 1999;274:29172–29180. doi: 10.1074/jbc.274.41.29172. [DOI] [PubMed] [Google Scholar]
- Huang da W, Sherman BT, Lempicki RA. Systematic and integrative analysis of large gene lists using DAVID bioinformatics resources. Nat Protoc. 2009;4:44–57. doi: 10.1038/nprot.2008.211. [DOI] [PubMed] [Google Scholar]
- Issa AM, Rowe W, Gauthier S, Meaney MJ. Hypothalamic-pituitary-adrenal activity in aged, cognitively impaired and cognitively unimpaired rats. J Neurosci. 1990;10:3247–3254. doi: 10.1523/JNEUROSCI.10-10-03247.1990. [DOI] [PMC free article] [PubMed] [Google Scholar]
- Jin Y, McEwen ML, Nottingham SA, Maragos WF, Dragicevic NB, Sullivan PG, Springer JE. The mitochondrial uncoupling agent 2,4-dinitrophenol improves mitochondrial function, attenuates oxidative damage, and increases white matter sparing in the contused spinal cord. J Neurotrauma. 2004;21:1396–1404. doi: 10.1089/neu.2004.21.1396. [DOI] [PubMed] [Google Scholar]
- Kadish I, Thibault O, Blalock EM, Chen KC, Gant JC, Porter NM, Landfield PW. Hippocampal and cognitive aging across the lifespan: a bioenergetic shift precedes and increased cholesterol trafficking parallels memory impairment. J Neurosci. 2009;29:1805–1816. doi: 10.1523/JNEUROSCI.4599-08.2009. [DOI] [PMC free article] [PubMed] [Google Scholar]
- Kiens B. Skeletal muscle lipid metabolism in exercise and insulin resistance. Physiol Rev. 2006;86:205–243. doi: 10.1152/physrev.00023.2004. [DOI] [PubMed] [Google Scholar]
- Lacreuse A, Kim CB, Rosene DL, Killiany RJ, Moss MB, Moore TL, Chennareddi L, Herndon JG. Sex, age, and training modulate spatial memory in the rhesus monkey (Macaca mulatta) Behav Neurosci. 2005;119:118–126. doi: 10.1037/0735-7044.119.1.118. [DOI] [PubMed] [Google Scholar]
- Lage R, Diéguez C, Vidal-Puig A, López M. AMPK: a metabolic gauge regulating whole-body energy homeostasis. Trends Mol Med. 2008;14:539–549. doi: 10.1016/j.molmed.2008.09.007. [DOI] [PubMed] [Google Scholar]
- Lai JC, Clark JB. Preparation of synaptic and nonsynaptic mitochondria from mammalian brain. Methods Enzymol. 1979;55:51–60. doi: 10.1016/0076-6879(79)55008-3. [DOI] [PubMed] [Google Scholar]
- Landfield PW, Baskin RK, Pitler TA. Brain aging correlates: retardation by hormonal-pharmacological treatments. Science. 1981;214:581–584. doi: 10.1126/science.6270791. [DOI] [PubMed] [Google Scholar]
- Landfield PW, Blalock EM, Chen KC, Porter NM. A new glucocorticoid hypothesis of brain aging: implications for Alzheimer's disease. Curr Alzheimer Res. 2007;4:205–212. doi: 10.2174/156720507780362083. [DOI] [PMC free article] [PubMed] [Google Scholar]
- Lee CK, Weindruch R, Prolla TA. Gene-expression profile of the ageing brain in mice. Nat Genet. 2000;25:294–297. doi: 10.1038/77046. [DOI] [PubMed] [Google Scholar]
- Lein ES, Zhao X, Gage FH. Defining a molecular atlas of the hippocampus using DNA microarrays and high-throughput in situ hybridization. J Neurosci. 2004;24:3879–3889. doi: 10.1523/JNEUROSCI.4710-03.2004. [DOI] [PMC free article] [PubMed] [Google Scholar]
- Leonardo ED, Richardson-Jones JW, Sibille E, Kottman A, Hen R. Molecular heterogeneity along the dorsal-ventral axis of the murine hippocampal CA1 field: a microarray analysis of gene expression. Neuroscience. 2006;137:177–186. doi: 10.1016/j.neuroscience.2005.08.082. [DOI] [PubMed] [Google Scholar]
- Leverve XM, Guigas B, Detaille D, Batandier C, Koceir EA, Chauvin C, Fontaine E, Wiernsperger NF. Mitochondrial metabolism and type-2 diabetes: a specific target of metformin. Diabetes Metab. 2003;29:6S88–6S94. doi: 10.1016/s1262-3636(03)72792-x. [DOI] [PubMed] [Google Scholar]
- Loerch PM, Lu T, Dakin KA, Vann JM, Isaacs A, Geula C, Wang J, Pan Y, Gabuzda DH, Li C, Prolla TA, Yankner BA. Evolution of the aging brain transcriptome and synaptic regulation. PLoS One. 2008;3:e3329. doi: 10.1371/journal.pone.0003329. [DOI] [PMC free article] [PubMed] [Google Scholar]
- Lu T, Pan Y, Kao SY, Li C, Kohane I, Chan J, Yankner BA. Gene regulation and DNA damage in the ageing human brain. Nature. 2004;429:883–891. doi: 10.1038/nature02661. [DOI] [PubMed] [Google Scholar]
- Lupien SJ, de Leon M, de Santi S, Convit A, Tarshish C, Nair NP, Thakur M, McEwen BS, Hauger RL, Meaney MJ. Cortisol levels during human aging predict hippocampal atrophy and memory deficits. Nat Neurosci. 1998;1:69–73. doi: 10.1038/271. [DOI] [PubMed] [Google Scholar]
- Lynch G, Rex CS, Gall CM. Synaptic plasticity in early aging. Ageing Res Rev. 2006;5:255–280. doi: 10.1016/j.arr.2006.03.008. [DOI] [PubMed] [Google Scholar]
- Maalouf NM, Cameron MA, Moe OW, Adams-Huet B, Sakhaee K. Low urine pH: a novel feature of the metabolic syndrome. Clin J Am Soc Nephrol. 2007;2:883–888. doi: 10.2215/CJN.00670207. [DOI] [PubMed] [Google Scholar]
- Mattson MP, Pedersen WA, Duan W, Culmsee C, Camandola S. Cellular and molecular mechanisms underlying perturbed energy metabolism and neuronal degeneration in Alzheimer's and Parkinson's diseases. Ann NY Acad Sci. 1999;893:154–175. doi: 10.1111/j.1749-6632.1999.tb07824.x. [DOI] [PubMed] [Google Scholar]
- McEwen BS. Allostasis, allostatic load, and the aging nervous system: role of excitatory amino acids and excitotoxicity. Neurochem Res. 2000;25:1219–1231. doi: 10.1023/a:1007687911139. [DOI] [PubMed] [Google Scholar]
- McEwen BS, de Leon MJ, Lupien SJ, Meaney MJ. Corticosteroids, the aging brain and cognition. Trends Endocrinol Metab. 1999;10:92–96. doi: 10.1016/s1043-2760(98)00122-2. [DOI] [PubMed] [Google Scholar]
- McGeer PL, McGeer EG. Inflammation and the degenerative diseases of aging. Ann NY Acad Sci. 2004;1035:104–116. doi: 10.1196/annals.1332.007. [DOI] [PubMed] [Google Scholar]
- Meaney MJ, Szyf M, Seckl JR. Epigenetic mechanisms of perinatal programming of hypothalamic-pituitary-adrenal function and health. Trends Mol Med. 2007;13:269–277. doi: 10.1016/j.molmed.2007.05.003. [DOI] [PubMed] [Google Scholar]
- Mirnics K, Pevsner J. Progress in the use of microarray technology to study the neurobiology of disease. Nat Neurosci. 2004;7:434–439. doi: 10.1038/nn1230. [DOI] [PubMed] [Google Scholar]
- Moser MB, Moser EI. Functional differentiation in the hippocampus. Hippocampus. 1998;8:608–619. doi: 10.1002/(SICI)1098-1063(1998)8:6<608::AID-HIPO3>3.0.CO;2-7. [DOI] [PubMed] [Google Scholar]
- Moss MB, Killiany RJ, Lai ZC, Rosene DL, Herndon JG. Recognition memory span in rhesus monkeys of advanced age. Neurobiol Aging. 1997;18:13–19. doi: 10.1016/s0197-4580(96)00211-4. [DOI] [PubMed] [Google Scholar]
- Mrak RE, Griffin WS. Potential inflammatory biomarkers in Alzheimer's disease. J Alzheimers Dis. 2005;8:369–375. doi: 10.3233/jad-2005-8406. [DOI] [PubMed] [Google Scholar]
- Nakanishi H. Microglial functions and proteases. Mol Neurobiol. 2003;27:163–176. doi: 10.1385/MN:27:2:163. [DOI] [PubMed] [Google Scholar]
- Norris CM, Kadish I, Blalock EM, Chen KC, Thibault V, Porter NM, Landfield PW, Kraner SD. Calcineurin triggers reactive/inflammatory processes in astrocytes and is upregulated in aging and Alzheimer's models. J Neurosci. 2005;25:4649–4658. doi: 10.1523/JNEUROSCI.0365-05.2005. [DOI] [PMC free article] [PubMed] [Google Scholar]
- Pagliarini DJ, Calvo SE, Chang B, Sheth SA, Vafai SB, Ong SE, Walford GA, Sugiana C, Boneh A, Chen WK, Hill DE, Vidal M, Evans JG, Thorburn DR, Carr SA, Mootha VK. A mitochondrial protein compendium elucidates complex I disease biology. Cell. 2008;134:112–123. doi: 10.1016/j.cell.2008.06.016. [DOI] [PMC free article] [PubMed] [Google Scholar]
- Parachikova A, Agadjanyan MG, Cribbs DH, Blurton-Jones M, Perreau V, Rogers J, Beach TG, Cotman CW. Inflammatory changes parallel the early stages of Alzheimer disease. Neurobiol Aging. 2007;28:1821–1833. doi: 10.1016/j.neurobiolaging.2006.08.014. [DOI] [PMC free article] [PubMed] [Google Scholar]
- Pedersen WA, McMillan PJ, Kulstad JJ, Leverenz JB, Craft S, Haynatzki GR. Rosiglitazone attenuates learning and memory deficits in Tg2576 Alzheimer mice. Exp Neurol. 2006;199:265–273. doi: 10.1016/j.expneurol.2006.01.018. [DOI] [PubMed] [Google Scholar]
- Piroli GG, Grillo CA, Reznikov LR, Adams S, McEwen BS, Charron MJ, Reagan LP. Corticosterone impairs insulin-stimulated translocation of GLUT4 in the rat hippocampus. Neuroendocrinology. 2007;85:71–80. doi: 10.1159/000101694. [DOI] [PubMed] [Google Scholar]
- Porrino LJ, Daunais JB, Rogers GA, Hampson RE, Deadwyler SA. Facilitation of task performance and removal of the effects of sleep deprivation by an ampakine (CX717) in nonhuman primates. PLoS Biol. 2005;3:e299. doi: 10.1371/journal.pbio.0030299. [DOI] [PMC free article] [PubMed] [Google Scholar]
- Pridgeon JW, Olzmann JA, Chin LS, Li L. PINK1 protects against oxidative stress by phosphorylating mitochondrial chaperone TRAP1. PLoS Biol. 2007;5:e172. doi: 10.1371/journal.pbio.0050172. [DOI] [PMC free article] [PubMed] [Google Scholar]
- Prolla TA. DNA microarray analysis of the aging brain. Chem Senses. 2002;27:299–306. doi: 10.1093/chemse/27.3.299. [DOI] [PubMed] [Google Scholar]
- Raji CA, Ho AJ, Parikshak NN, Becker JT, Lopez OL, Kuller LH, Hua X, Leow AD, Toga AW, Thompson PM. Brain structure and obesity. Hum Brain Mapp. 2010;31:353–364. doi: 10.1002/hbm.20870. [DOI] [PMC free article] [PubMed] [Google Scholar]
- Rapp PR, Amaral DG. Recognition memory deficits in a subpopulation of aged monkeys resemble the effects of medial temporal lobe damage. Neurobiol Aging. 1991;12:481–486. doi: 10.1016/0197-4580(91)90077-w. [DOI] [PubMed] [Google Scholar]
- Reaven GM. The insulin resistance syndrome: definition and dietary approaches to treatment. Annu Rev Nutr. 2005;25:391–406. doi: 10.1146/annurev.nutr.24.012003.132155. [DOI] [PubMed] [Google Scholar]
- Reiner A, Yekutieli D, Benjamini Y. Identifying differentially expressed genes using false discovery rate controlling procedures. Bioinformatics. 2003;19:368–375. doi: 10.1093/bioinformatics/btf877. [DOI] [PubMed] [Google Scholar]
- Reznick RM, Shulman GI. The role of AMP-activated protein kinase in mitochondrial biogenesis. J Physiol. 2006;574:33–39. doi: 10.1113/jphysiol.2006.109512. [DOI] [PMC free article] [PubMed] [Google Scholar]
- Rivera EJ, Goldin A, Fulmer N, Tavares R, Wands JR, de la Monte SM. Insulin and insulin-like growth factor expression and function deteriorate with progression of Alzheimer's disease: link to brain reductions in acetylcholine. J Alzheimers Dis. 2005;8:247–268. doi: 10.3233/jad-2005-8304. [DOI] [PubMed] [Google Scholar]
- Rossmeisl M, Flachs P, Brauner P, Sponarova J, Matejkova O, Prazak T, Ruzickova J, Bardova K, Kuda O, Kopecky J. Role of energy charge and AMP-activated protein kinase in adipocytes in the control of body fat stores. Int J Obes Relat Metab Disord. 2004;28(Suppl 4):S38–S44. doi: 10.1038/sj.ijo.0802855. [DOI] [PubMed] [Google Scholar]
- Rowe WB, Blalock EM, Chen KC, Kadish I, Wang D, Barrett JE, Thibault O, Porter NM, Rose GM, Landfield PW. Hippocampal expression analyses reveal selective association of immediate-early, neuroenergetic, and myelinogenic pathways with cognitive impairment in aged rats. J Neurosci. 2007;27:3098–3110. doi: 10.1523/JNEUROSCI.4163-06.2007. [DOI] [PMC free article] [PubMed] [Google Scholar]
- Saeed AI, Sharov V, White J, Li J, Liang W, Bhagabati N, Braisted J, Klapa M, Currier T, Thiagarajan M, Sturn A, Snuffin M, Rezantsev A, Popov D, Ryltsov A, Kostukovich E, Borisovsky I, Liu Z, Vinsavich A, Trush V, Quackenbush J. TM4: a free, open-source system for microarray data management and analysis. Biotechniques. 2003;34:374–378. doi: 10.2144/03342mt01. [DOI] [PubMed] [Google Scholar]
- Sapolsky RM. Glucocorticoids, stress, and their adverse neurological effects: relevance to aging. Exp Gerontol. 1999;34:721–732. doi: 10.1016/s0531-5565(99)00047-9. [DOI] [PubMed] [Google Scholar]
- Seckl JR, Walker BR. 11beta-hydroxysteroid dehydrogenase type 1 as a modulator of glucocorticoid action: from metabolism to memory. Trends Endocrinol Metab. 2004;15:418–424. doi: 10.1016/j.tem.2004.09.007. [DOI] [PubMed] [Google Scholar]
- Shen YQ, Hebert G, Lin LY, Luo YL, Moze E, Li KS, Neveu PJ. Interleukine-1beta and interleukine-6 levels in striatum and other brain structures after MPTP treatment: influence of behavioral lateralization. J Neuroimmunol. 2005;158:14–25. doi: 10.1016/j.jneuroim.2004.06.011. [DOI] [PubMed] [Google Scholar]
- Short TG, Young Y. Toxicity of intravenous anaesthetics. Best Pract Res Clin Anaesthesiol. 2003;17:77–89. doi: 10.1053/bean.2002.0266. [DOI] [PubMed] [Google Scholar]
- Simpkins JW, Yang SH, Sarkar SN, Pearce V. Estrogen actions on mitochondria: physiological and pathological implications. Mol Cell Endocrinol. 2008;290:51–59. doi: 10.1016/j.mce.2008.04.013. [DOI] [PMC free article] [PubMed] [Google Scholar]
- Skaggs WE, McNaughton BL, Permenter M, Archibeque M, Vogt J, Amaral DG, Barnes CA. EEG sharp waves and sparse ensemble unit activity in the macaque hippocampus. J Neurophysiol. 2007;98:898–910. doi: 10.1152/jn.00401.2007. [DOI] [PubMed] [Google Scholar]
- Sloane JA, Hollander W, Moss MB, Rosene DL, Abraham CR. Increased microglial activation and protein nitration in white matter of the aging monkey. Neurobiol Aging. 1999;20:395–405. doi: 10.1016/s0197-4580(99)00066-4. [DOI] [PubMed] [Google Scholar]
- Small SA, Chawla MK, Buonocore M, Rapp PR, Barnes CA. Imaging correlates of brain function in monkeys and rats isolates a hippocampal subregion differentially vulnerable to aging. Proc Natl Acad Sci U S A. 2004;101:7181–7186. doi: 10.1073/pnas.0400285101. [DOI] [PMC free article] [PubMed] [Google Scholar]
- Smith MA, Nunomura A, Zhu X, Takeda A, Perry G. Metabolic, metallic, and mitotic sources of oxidative stress in Alzheimer disease. Antioxid Redox Signal. 2000;2:413–420. doi: 10.1089/15230860050192198. [DOI] [PubMed] [Google Scholar]
- Stranahan AM, Norman ED, Lee K, Cutler RG, Telljohann RS, Egan JM, Mattson MP. Diet-induced insulin resistance impairs hippocampal synaptic plasticity and cognition in middle-aged rats. Hippocampus. 2008a;18:1085–1088. doi: 10.1002/hipo.20470. [DOI] [PMC free article] [PubMed] [Google Scholar]
- Stranahan AM, Lee K, Pistell PJ, Nelson CM, Readal N, Miller MG, Spangler EL, Ingram DK, Mattson MP. Accelerated cognitive aging in diabetic rats is prevented by lowering corticosterone levels. Neurobiol Learn Mem. 2008b;90:479–483. doi: 10.1016/j.nlm.2008.05.005. [DOI] [PMC free article] [PubMed] [Google Scholar]
- Sullivan PG, Dubé C, Dorenbos K, Steward O, Baram TZ. Mitochondrial uncoupling protein-2 protects the immature brain from excitotoxic neuronal death. Ann Neurol. 2003;53:711–717. doi: 10.1002/ana.10543. [DOI] [PMC free article] [PubMed] [Google Scholar]
- Sullivan PG, Rabchevsky AG, Keller JN, Lovell M, Sodhi A, Hart RP, Scheff SW. Intrinsic differences in brain and spinal cord mitochondria: Implication for therapeutic interventions. J Comp Neurol. 2004;474:524–534. doi: 10.1002/cne.20130. [DOI] [PubMed] [Google Scholar]
- Sullivan PG, Krishnamurthy S, Patel SP, Pandya JD, Rabchevsky AG. Temporal characterization of mitochondrial bioenergetics after spinal cord injury. J Neurotrauma. 2007;24:991–999. doi: 10.1089/neu.2006.0242. [DOI] [PubMed] [Google Scholar]
- Thibault O, Gant JC, Landfield PW. Expansion of the calcium hypothesis of brain aging and Alzheimer's disease: minding the store. Aging Cell. 2007;6:307–317. doi: 10.1111/j.1474-9726.2007.00295.x. [DOI] [PMC free article] [PubMed] [Google Scholar]
- Tigges J, Gordon TP, McClure HM, Hall EC, Peters A. Survival rate and life span of rhesus monkeys at the Yerkes regional primate research center. Am J Primatol. 1988;15:263–273. doi: 10.1002/ajp.1350150308. [DOI] [PubMed] [Google Scholar]
- Tigno XT, Gerzanich G, Hansen BC. Age-related changes in metabolic parameters of nonhuman primates. J Gerontol A Biol Sci Med Sci. 2004;59:1081–1088. doi: 10.1093/gerona/59.11.1081. [DOI] [PubMed] [Google Scholar]
- Toescu EC, Verkhratsky A. Ca2+ and mitochondria as substrates for deficits in synaptic plasticity in normal brain ageing. J Cell Mol Med. 2004;8:181–190. doi: 10.1111/j.1582-4934.2004.tb00273.x. [DOI] [PMC free article] [PubMed] [Google Scholar]
- Verbitsky M, Yonan AL, Malleret G, Kandel ER, Gilliam TC, Pavlidis P. Altered hippocampal transcript profile accompanies an age-related spatial memory deficit in mice. Learn Mem. 2004;11:253–260. doi: 10.1101/lm.68204. [DOI] [PMC free article] [PubMed] [Google Scholar]
- Verkhratsky A, Fernyhough P. Mitochondrial malfunction and Ca2+ dyshomeostasis drive neuronal pathology in diabetes. Cell Calcium. 2008;44:112–122. doi: 10.1016/j.ceca.2007.11.010. [DOI] [PubMed] [Google Scholar]
- Wallberg AE, Neely KE, Gustafsson JA, Workman JL, Wright AP, Grant PA. Histone acetyltransferase complexes can mediate transcriptional activation by the major glucocorticoid receptor activation domain. Mol Cell Biol. 1999;19:5952–5959. doi: 10.1128/mcb.19.9.5952. [DOI] [PMC free article] [PubMed] [Google Scholar]
- Walton A, Scheib JL, McLean S, Zhang Z, Grondin R. Motor memory preservation in aged monkeys mirrors that of aged humans on a similar task. Neurobiol Aging. 2008;29:1556–1562. doi: 10.1016/j.neurobiolaging.2007.03.016. [DOI] [PubMed] [Google Scholar]
- Wei H, Xie Z. Anesthesia, calcium homeostasis and Alzheimer's disease. Curr Alzheimer Res. 2009;6:30–35. doi: 10.2174/156720509787313934. [DOI] [PMC free article] [PubMed] [Google Scholar]
- Whitmer RA, Gunderson EP, Quesenberry CP, Jr, Zhou J, Yaffe K. Body mass index in midlife and risk of Alzheimer disease and vascular dementia. Curr Alzheimer Res. 2007;4:103–109. doi: 10.2174/156720507780362047. [DOI] [PubMed] [Google Scholar]
- Wyss-Coray T, Mucke L. Inflammation in neurodegenerative disease: a double-edged sword. Neuron. 2002;35:419–432. doi: 10.1016/s0896-6273(02)00794-8. [DOI] [PubMed] [Google Scholar]
- Xu X, Zhan M, Duan W, Prabhu V, Brenneman R, Wood W, Firman J, Li H, Zhang P, Ibe C, Zonderman AB, Longo DL, Poosala S, Becker KG, Mattson MP. Gene expression atlas of the mouse central nervous system: impact and interactions of age, energy intake and gender. Genome Biol. 2007;8:R234. doi: 10.1186/gb-2007-8-11-r234. [DOI] [PMC free article] [PubMed] [Google Scholar]
- Yaffe K, Blackwell T, Kanaya AM, Davidowitz N, Barrett-Connor E, Krueger K. Diabetes, impaired fasting glucose, and development of cognitive impairment in older women. Neurology. 2004;63:658–663. doi: 10.1212/01.wnl.0000134666.64593.ba. [DOI] [PubMed] [Google Scholar]
- Yang H, Liang G, Hawkins BJ, Madesh M, Pierwola A, Wei H. Inhalational anesthetics induce cell damage by disruption of intracellular calcium homeostasis with different potencies. Anesthesiology. 2008;109:243–250. doi: 10.1097/ALN.0b013e31817f5c47. [DOI] [PMC free article] [PubMed] [Google Scholar]
- Yoshida H. ER stress and diseases. FEBS J. 2007;274:630–658. doi: 10.1111/j.1742-4658.2007.05639.x. [DOI] [PubMed] [Google Scholar]
- Zahn JM, Poosala S, Owen AB, Ingram DK, Lustig A, Carter A, Weeraratna AT, Taub DD, Gorospe M, Mazan-Mamczarz K, Lakatta EG, Boheler KR, Xu X, Mattson MP, Falco G, Ko MS, Schlessinger D, Firman J, Kummerfeld SK, Wood WH, 3rd, Zonderman AB, Kim SK, Becker KG. AGEMAP: a gene expression database for aging in mice. PLoS Genet. 2007;3:e201. doi: 10.1371/journal.pgen.0030201. [DOI] [PMC free article] [PubMed] [Google Scholar]
- Zhang Z, Andersen A, Smith C, Grondin R, Gerhardt G, Gash D. Motor slowing and parkinsonian signs in aging rhesus monkeys mirror human aging. J Gerontol A Biol Sci Med Sci. 2000;55:B473–B480. doi: 10.1093/gerona/55.10.b473. [DOI] [PubMed] [Google Scholar]
- Zhao WQ, Alkon DL. Role of insulin and insulin receptor in learning and memory. Mol Cell Endocrinol. 2001;177:125–134. doi: 10.1016/s0303-7207(01)00455-5. [DOI] [PubMed] [Google Scholar]