Abstract
Objective:
To compare measurements obtained by Goldmann applanation tonometry (GAT) and Pascal dynamic contour tonometry (DCT), and to study their relationship to corneal thickness and biomechanical properties in nonglaucomatous eyes.
Methods:
This is a prospective and randomized study of 200 eyes from 200 non-glaucomatous subjects who underwent intraocular pressure (IOP) measurements by GAT and DCT. The two methods were compared and assessed for agreement by means of the Bland–Altman plot. Central corneal thickness (CCT) and corneal hysteresis (CH) were obtained by ultrasound pachymeter and Ocular Response Analyzer, respectively. The effect of CH and CCT was correlated with the DCT/GAT IOP differences.
Results:
Mean age was 57.4 ± 14.7 years (range 24–82 years). Mean IOP measurements obtained were 16.7 ± 3.2 mmHg by GAT and 19.4 ± 3.3 mmHg by DCT. DCT showed a statistically significant higher mean IOP (2.7 ± 1.9 mmHg, P < 0.001) compared with GAT. Mean CCT and CH were 546.5 ± 40 μm and 10.85 ± 2.0 mmHg, respectively. The differences in IOP (DCT – GAT) were significantly correlated with CCT and CH (Pearson’s correlation coefficient r = −0.517 and −0.355, P < 0.0001, respectively). The difference between the two correlation coefficients was statistically significant (P < 0.05, Z-statistic). According to the Bland–Altman plot, the results of the two methods were clinically different.
Conclusion:
Significantly higher IOP readings were obtained by DCT than by GAT in nonglaucomatous subjects. The IOP differences between the two methods were associated with CCT and CH, suggesting that DCT was less dependent on corneal parameters. Each method provides clinically different IOP values, indicating that DCT and GAT should not be used interchangeably.
Keywords: Pascal dynamic contour tonometry, Goldmann applanation tonometry, glaucoma, central corneal thickness, corneal hysteresis
Introduction
The accurate measurement of intraocular pressure (IOP) plays the most important role in the diagnosis, monitoring, and treatment of glaucoma.1,2 Goldmann applanation tonometry (GAT) is currently the most widely used method for the determination of IOP.3 However, GAT measurements can be influenced by several factors, such as central corneal thickness (CCT), corneal curvature, axial length, and the biomechanical properties of the ocular wall.4–14 In order to determine the “true” IOP in a more reliable manner, research has turned to alternative tonometry methods.15–17 Pascal dynamic contour tonometry (DCT) has attracted much attention in recent years as a promising novel method that provides direct transcorneal IOP measurements, and is influenced to a lesser degree by interindividual variations in CCT.18–28 Most studies report that IOP readings obtained by DCT are higher than those obtained by GAT.18–33 However, there are contradictory results for the magnitude of these IOP differences,27,28,32–34 as well as their association with the geometrical and biomechanical properties of the cornea.28–34 The biomechanical response of the cornea not only depends on its thickness, but also on its viscoelasticity, which is associated with stromal hydration, collagen composition, and probably other unidentified structural factors.12,35–38 Corneal hysteresis (CH), as measured by the Ocular Response Analyzer (ORA; Reichert Ophthalmic Instruments, Buffalo, NY) device, has been suggested to reflect the viscoelastic properties of the cornea.17 Little is known about the effect of the corneal biomechanics on DCT measurements.32,39 Furthermore, the clinical value of DCT compared with GAT has not yet been completely delineated. The objective of this study was to evaluate GAT and DCT IOP measurements in nonglaucomatous eyes and to analyze them in relation to CCT and CH.
Methods
This was a prospective study of 200 nonglaucomatous subjects, who visited the outpatient clinic of the “Hellenic Red Cross” General Hospital. The study was approved by the hospital’s Scientific Board. Written informed consent, according to the principles of the Declaration of Helsinki, was obtained from each participant. Ophthalmological examination included medical history, automated refraction, Javal’s keratometry, best corrected visual acuity with Snellen chart, slit lamp examination, fundoscopy with a 78-D lens, IOP measurement, and CH and CCT calculation. Patients with glaucoma, ophthalmic surgery or trauma, active ocular inflammation, refractive error/astigmatism of > ±2.00 D, corneal abnormalities, or refractive procedure were excluded from the study. Glaucoma suspects with IOP measurements >21 mmHg underwent further investigation with optical coherence tomography (Stratus, Zeiss) and automated Humphrey perimetry, in order to detect glaucomatous damage. Only subjects with ocular hypertension have been included in the study.
After instillation of proparacaine 0.5% topical anesthetic, IOP measurements were obtained by GAT and by DCT in randomized order, with a time interval of 5 minutes between them.
All IOP measurements were obtained by the same examiner in a masked fashion. GAT and DCT values were recorded by the same observer. GAT was performed on a slit lamp (Haag-Streit AG, Koeniz, Switzerland) with a tonometer calibrated according to the manufacturer’s guidelines. Two GAT readings were obtained for each eye, and mean IOP was recorded.
Dynamic contour tonometry was performed with the Pascal digital tonometer (dynamic contour tonometer, DCT-PASCAL, Ziemer Ophthalmic Systems Group Co, Switzerland), mounted to the slit lamp. DCT uses contour matching. The head of the DCT tonometer has a 10.5 mm radius and a 7.0 mm diameter, which is the approximate shape of a normal cornea. When the external pressure becomes equal with the IOP, the integrated piezoresistive pressure sensor automatically begins to acquire data, measuring the pulsative IOP continuously 100 times per second. Each measurement usually requires from 6 to 10 seconds and is simultaneously accompanied by an audio feedback, which helps the clinician to maintain good positioning on the cornea. The IOP value and a quality score (Q) indicating the reliability of the measurement are digitally displayed. According to the manufacturer’s instructions, Q1 and Q2 are characterized “excellent,” Q3 “acceptable,” Q4 and Q5 “not acceptable.” The average IOP of two measurements with a Q1 or Q2 score of each eye were evaluated for the analysis.
Fifteen minutes after DCT and GAT, CH and CCT measurements were obtained. CH was determined using the ORA. The ORA utilizes noncontact tonometry principles. The release of a precisely metered air pulse causes the cornea to shift inward, passing from a flat to a concave state. As the air pulse decreases, the cornea moves outward, returning first to a flat state, and then to its initial convex shape. An electro-optical collimator-detector monitors the central 3.0 mm of the corneal diameter during a 20-millisecond period, and records two applanation events produced by the bidirectional movement of the cornea. Two separate IOP readings, corresponding to the applanation events, are provided in a single measurement. The IOP measured during the first applanation event is always higher than the IOP measured during the second event. The difference between the two IOP values is the measure of CH, which reflects the viscoelastic properties of the cornea. Applanation signal peaks for each measurement were reviewed for quality, according to the manufacturer’s instructions (adequate magnitude and symmetry). When three ORA measurements of acceptable quality had been obtained in each eye, the average CH was calculated. Finally, CCT was determined using a hand-held ultrasound pachymeter (Pocket II; Quantel Medical SA, Clermont-Ferrand, France). The mean value of three CCT readings within a range of ±5 μm has been evaluated.
One eye was randomly selected and included in the analysis. Randomization was achieved using a randomization list generated by the http://www.randomization.com website.
Statistical data analysis was performed using medcalc 9.3.7.0 (Med-Calc Software, Mariakerke, Belgium). The Kolmogorov–Smirnov test was used to check for a normal distribution of quantitative data, which are provided as means and their standard deviations. Comparisons of the measurements between the two instruments were made using the paired t-test. In order to explore the difference of IOP measurements between DCT and GAT, in correlation with CCT and CH (power and direction of a linear relationship), we used the Pearson’s analysis (Pearson’s correlation coefficient) and Z statistics. Furthermore, the two methods were compared for bias and agreement with the Bland–Altman plot. Significance was set at P < 0.05.
Results
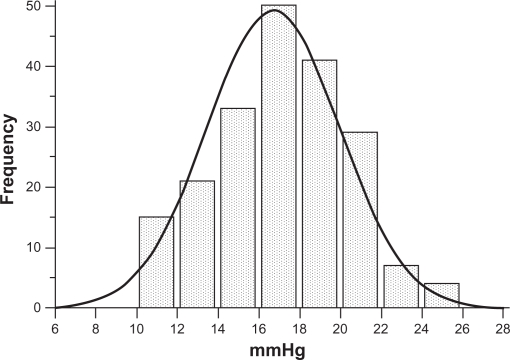
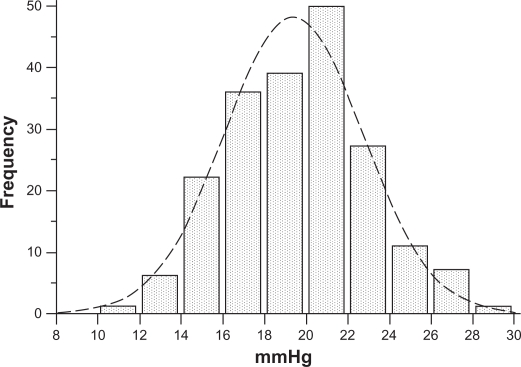
Of the 200 nonglaucomatous individuals, 93 were male and 107 were female, with an average age of 57.4 ± 14.7 years (range 24–82 years). Means and standard deviations of IOP measured by GAT and by DCT were 16.7 ± 3.2 (range 10–24) mmHg and 19.4 ± 3.3 (range 12–28.5) mmHg, respectively. IOP measured by GAT and by DCT had a normal distribution (one-sample Kolmogorov–Smirnov test). Differences in IOP measurements between DCT and GAT (ΔDCT – GAT, ie, the algebraic difference of IOP obtained by subtracting IOP by GAT from IOP by DCT for each eye) were statistically significant (2.7 ± 1.9 mmHg, paired t-test P < 0.001). The entire IOP distribution curve by DCT is shifted to the right compared with the IOP distribution curve by GAT (Figures 1 and 2). IOP > 21 mmHg was obtained by GAT in 28 eyes (14%) and by DCT in 94 eyes (47%).
Figure 1.
IOP normal distribution according to GAT measurements in 200 nonglaucomatous eyes, 28 (14%) of which had an IOP > 21 mmHg.
Abbreviations: GAT, Goldmann applanation tonometry; IOP, intraocular pressure.
Figure 2.
IOP normal distribution according to DCT measurements in 200 nonglaucomatous eyes. Compared with the GAT IOP curve in Figure 1, a shift of the entire DCT IOP distribution curve to the right is observed. Ninety-four (47%) eyes had an IOP > 21 mmHg.
Abbreviations: DCT, dynamic contour tonometry; GAT, Goldmann applanation tonometry; IOP, intraocular pressure.
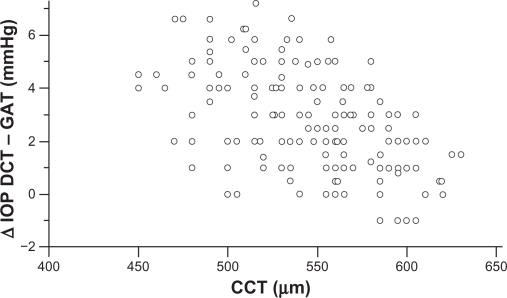
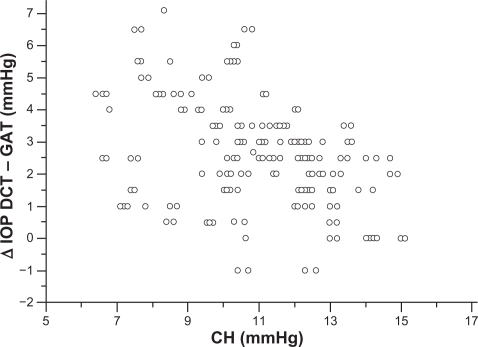
Mean corneal curvature, calculated from the mean values of the two readings, obtained by the Javal’s keratometry for each eye, was 43 ± 1.2 dpt. Mean CCT found in nonglaucomatous eyes was 546.5 ± 40 (range 450–630 μm), and mean CH was 10.85 ± 2.0 mmHg (range 6.4–15.1 mmHg). CCT, CH and corneal curvature, had a normal distribution (one-sample Kolmogorov–Smirnov test). A significant negative correlation was found between CCT and ΔDCT – GAT (Pearson’s correlation coefficient r = −0.517, P < 0.0001, 95% CI −0.612 to −0.408) (Figure 3). A significant negative correlation was found also between CH and ΔDCT – GAT (Pearson’s correlation coefficient r = −0.355, P < 0.0001, 95% CI −0.492 to −0.254) (Figure 4). The difference between the two correlation coefficients was statistical significant (P = 0.0460, Z-statistic = 1.996).
Figure 3.
CCT measurements plotted against the difference between DCT and GAT IOP measurements show a strongly negative correlation (Pearson’s correlation coefficient r = −0.517, P < 0.0001). IOP differences tend to increase in eyes with thinner corneas and to decrease in eyes with thicker corneas.
Abbreviations: CCT, central corneal thickness; DCT, dynamic contour tonometry; GAT, Goldmann applanation tonometry; IOP, intraocular pressure.
Figure 4.
CH measurements plotted against the difference between DCT and GAT IOP measurements show a significantly negative correlation (Pearson’s correlation coefficient r = −0.355, P < 0.0001). The IOP differences tend to increase in eyes with lower CH and to decrease in eyes with higher CH.
Abbreviations: CH, corneal hysteresis; DCT, dynamic contour tonometry; GAT, Goldmann applanation tonometry; IOP, intraocular pressure.
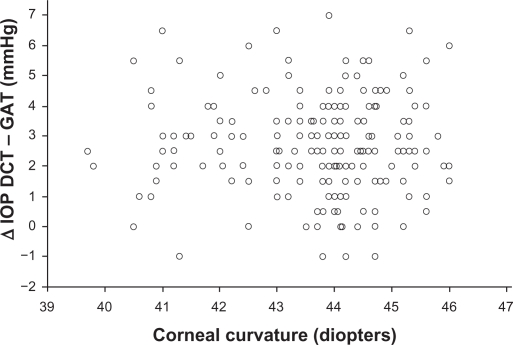
No statistical significance was found between the corneal curvature and ΔDCT – GAT (Figure 5) (Pearson’s correlation coefficient r = −0.028, P = 0.689, 95% CI −0.166 to 0.110).
Figure 5.
Corneal curvature measurements plotted against the difference between DCT and GAT IOP measurements do not show a statistically significant correlation (Pearson’s correlation coefficient r = −0.028, P = 0.689).
Abbreviations: DCT, dynamic contour tonometry; GAT, Goldmann applanation tonometry; IOP, intraocular pressure.
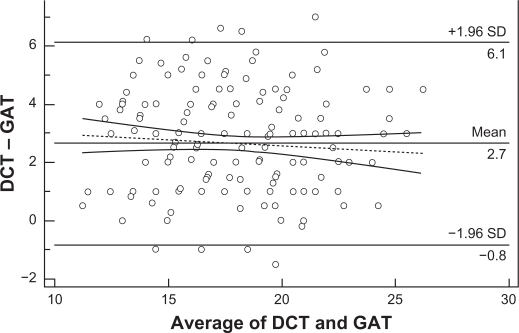
Figure 6 displays a scatter diagram of the differences plotted against the averages of the two measurements. Horizontal lines are drawn at the mean difference, and at the mean difference ±1.96 times the standard deviation of the differences. When two methods show excellent agreement, the mean difference will be near zero. According to the Bland–Altman plot, the results of the two methods differed clinically, since the measurements were on average >2.7 mmHg apart. The trend towards a reduction of the IOP differences at higher IOP levels was not statistically significant (Figure 6 dotted line, r = −0,083, P = 0,242, 95% CI −0.219 to 0.0562).
Figure 6.
Bland–Altman plot testing the clinical agreement of the IOP measurements obtained by DCT and GAT. The results of the 2 methods are clinically different, since the measurements are on average >2.7 mmHg apart. Therefore, the 2 methods are not interchangeable. The tendency of the IOP differences to decrease at higher IOPs was not statistically significant (dotted line, r = −0.083, P = 0.242).
Abbreviations: DCT, dynamic contour tonometry; GAT, Goldmann applanation tonometry; IOP, intraocular pressure; SD, standard deviation.
Discussion
Fifty years ago, Goldman had pointed out that the theoretical model of applanation tonometry, which relied on the Imbert-Fick law,3 concealed errors in clinical practice. It is well known that the GAT IOP value in thicker corneas is falsely higher, while in thinner corneas it is falsely lower.4,7–10 The impact of the biomechanical properties of the ocular wall on GAT IOP measurements, as well as on glaucoma pathogenesis, has also been demonstrated.12,13,39–43 New tonometry methods have been developed to improve the accuracy of IOP determination, among which great attention has been gained by DCT.
In the present study, significantly higher IOP readings (by 2.7 mmHg on average) were obtained in nonglaucomatous eyes by DCT than by GAT. In order to enhance the reliability of DCT measurements, we evaluated only Q1 and Q2 IOP readings, ie, those of “excellent” testing quality, according to the manufacturer’s instructions. Similar results in nonglaucomatous subjects were found by other authors.22,24,25 Kaufmann et al reported lower IOP differences (1.7 mm on average) between the two methods by using a prototype of the Pascal tonometer in healthy volunteers.18 Kniestedt et al, performing manometry in cadaver eyes, showed that GAT IOPs were on average lower (by almost 4 mmHg) than DCT IOPs.44,45
Several investigators have clinically documented that, compared with GAT, DCT overestimates IOP by values ranging on average from 0.7 to 4.4 mmHg. The range of the results in those studies may be due to the recruitment of nonhomogenous populations including glaucomatous, nonglaucomatous, mixed or racially dissimilar individuals, or variation in visual endpoint for different GAT observers. It has been reported recently that the mean difference of IOP values between GAT and DCT is not the same in glaucomatous eyes as in nonglaucomatous eyes.25,31 In addition, race is associated with variable corneal parameters,10,46–48 which may considerably influence GAT versus DCT measurements.
Most authors agree that DCT IOP measurements are less affected by CCT, compared to GAT,18–28 although a few contradictory findings have also been reported.29–34 Important evidence for the impact of corneal parameters on DCT versus GAT measurements is derived from the field of refractive surgery.35,49–51 Studies comparing the two methods before and after refractive surgical procedures showed that measurements by DCT were significantly more consistent.49–51 We found that the differences of measurements between DCT and GAT are strongly correlated with CCT (Figure 3). These IOP differences are more pronounced in eyes with thinner corneas, whereas in most eyes with thicker corneas they tend to be minimal. Surprisingly, however, as shown in Figure 3, a noteworthy number of eyes with thicker corneas (>550 μm) had IOP differences of ≥3 mmHg, while some eyes with thinner corneas (<550 μm) had IOP differences of ≤2 mmHg. The effect of corneal curvature on DCT measurements is controversial.18,23,24 This study, including eyes with < ± 2.0 dpt ammetropia, did not reveal any significant impact of the corneal curvature on the IOP differences between the two methods (Figure 5). Hence, our findings indicate that, in addition to corneal thickness, other characteristics of the cornea, such as its biomechanical response, may be implicated in the discrepancies between DCT and GAT IOP measurements. It is reported that CH is associated with CCT.41,52 Similarly to CCT, we found that CH was also significantly negatively correlated with the differences between DCT and GAT measurements (Figure 4), ie, in eyes with a higher CH value these IOP differences were lower, and vice versa. However the correlations of CCT (Figure 3) and CH (Figure 4) showed a significant difference, which implies that CCT and CH may have a different impact on DCT versus GAT. This finding could explain the discrepancies between DCT and GAT IOP measurements in a number of eyes with thicker or thinner corneas. Apparently, among eyes with the same CCT, the difference between DCT and GAT measurements may not be identical, due to different viscoelastic properties. The effect of corneal factors other than CCT on tonometry has been proposed in several studies. Feltgen et al, comparing intracameral with applanatory tonometry, concluded that GAT IOP is not methodically influenced by CCT.53 Kniestedt et al reported that the relationship between CCT and GAT is not linear.19 In a recent study, using the Ehlers-correction coefficient, CCT error-free GAT IOPs were not consistent with DCT IOPs.54 It is suggested that the development of various correction coefficients for a “true” GAT IOP determination, taking into account only CCT, has not given reliable results.15,19,51,53,55 The authors of a meta-analysis on CCT-induced GAT IOP measurement errors suggest different correction coefficients between normal and glaucomatous eyes.9 In addition, the impact of corneal biomechanics on GAT has been already introduced. Using bioengineering techniques, Liu and Roberts described in an experimental model that differences in corneal viscoelastic properties may have at least the same effect on GAT as differences in corneal thickness.12 Similarly to our results, Kotecha et al showed that CRF (corneal resistance factor) was correlated more significantly than CCT with DCT and GAT measurements.39 Hager et al found a weak correlation of CH with GAT and DCT measurements in glaucomatous eyes.32 It is also reported that corneal viscoelastic properties differ between normal and glaucomatous eyes.41 A different correlation of CCT with the deviations of DCT versus GAT IOP between nonglaucomatous and glaucomatous eyes has also been reported,25,31 probably due to differing biomechanical properties.
All these data imply that the effect of corneal parameters on the determination of IOP by both GAT and DCT is complex. Regardless of how differences between DCT and GAT could be explained, their clinical relevance is probably the most important issue. In our study, the Bland–Altman plot showed that the results of the two methods are clinically different (Figure 6). Using the criterion for ocular hypertension GAT IOP > 21 mmHg, the ocular hypertensive eyes among the participants in our study detected by GAT were 14% versus 47% by DCT. It is evident that the DCT IOP distribution curve (Figure 2) has shifted to the right compared to the GAT IOP distribution curve (Figure 1), which means that a subject with DCT IOP of 22 mmHg is not necessarily considered as suspect, because the measurement exceeds two standard deviations of the mean GAT IOP. Consequently, in agreement with other authors,24,34,39 we also suggest that the two methods should not be used interchangeably. Moreover, the determination of the target IOP value using DCT remains unclear. Further research in a large population is needed to determine the DCT IOP distribution curve with the corresponding statistical limits, as a benchmark for the clinical evaluation of DCT measurements independently of GAT. In addition it should be clarified, why the IOP differences between the two methods tend to diminish with increasing IOP.22,56 This tendency was also derived from the Bland–Altman plot of our data, but was not significant.
The question about which is the “true” IOP and by which method it can be reliably determined seems to be more theoretical than practical. Since glaucomatous damage can occur across a wide range of statistically “normal” to “abnormal” IOP values, importance should be primarily given to the “damaging” IOP rather than the “true” IOP. DCT appears to be giving a better answer to the initial question. DCT measurements showed good concordance with intracameral tonometry.57 GAT provides an indirect calculation of the IOP, converting the force exerted for the flattening of the cornea to pressure. To the contrary, by using DCT the IOP is directly transcorneally determined by a piezoelectrical sensor, avoiding systemic errors that may be produced by GAT.16 The principle of contour matching compared with applanation appears to lessen the influence of corneal thickness and biomechanical properties on IOP measurements. The “Q” quality score can verify the reliability of the DCT reading. In addition, repeatability of DCT is described at high levels.39,58
To summarize, significantly higher IOP values are obtained by DCT than by GAT in non glaucomatous subjects. The differences between GAT and DCT IOP measurements are associated with CCT and CH. Each method gives clinically different IOP values, indicating that DCT and GAT should not be used interchangeably.
Footnotes
Disclosure
The authors have no commercial interest in any product or procedure mentioned in this manuscript.
References
- 1.Kass MA, Heur DK, Higginbotham EJ, et al. The ocular hypertension treatment study: a randomised trial determines that topical ocular hypotensive medication delays or prevents the onset of primary open-angle glaucoma. Arch Ophthalmol. 2002;1209(6):701–713. doi: 10.1001/archopht.120.6.701. [DOI] [PubMed] [Google Scholar]
- 2.Leske MC, Heijl A, Hussein M, Bengtsson B, Hyman L, Komaroff E. Early Manifest Glaucoma Trail Group. Factors for glaucoma progression and the effect of treatment: the early manifest glaucoma trial. Arch Ophthalmol. 2003;121(1):48–56. doi: 10.1001/archopht.121.1.48. [DOI] [PubMed] [Google Scholar]
- 3.Goldmann H, Schmidt T. Applanation tonometry. Ophthalmologica. 1957;134(4):221–242. doi: 10.1159/000303213. [DOI] [PubMed] [Google Scholar]
- 4.Ehlers N, Bramsen T, Sperling S. Applanation tonometry and central corneal thickness. Acta Ophthalmol (Copenh) 1975;53(1):34–43. doi: 10.1111/j.1755-3768.1975.tb01135.x. [DOI] [PubMed] [Google Scholar]
- 5.Wessels IF, Oh Y. Tonometer utilization, accuracy, and calibration under field conditions. Arch Ophthalmol. 1990;108(12):1709–1712. doi: 10.1001/archopht.1990.01070140063030. [DOI] [PubMed] [Google Scholar]
- 6.Whitacre MM, Stein R. Sources of error with use of Goldmann-type tonometers. Surv Ophthalmol. 1993;38(1):1–30. doi: 10.1016/0039-6257(93)90053-a. [DOI] [PubMed] [Google Scholar]
- 7.Whitacre MM, Stein RA, Hassanein K. The effect of corneal thickness on applanation tonometry. Am J Ophthalmol. 1993;115(5):592–596. doi: 10.1016/s0002-9394(14)71455-2. [DOI] [PubMed] [Google Scholar]
- 8.Bron AM, Creuzot-Garcher C, Goudeau-Boutillon S, d’Athis P. Falsely elevated intraocular pressure due to increased central corneal thickness. Graefes Arch Clin Exp Ophthalmol. 1999;237(3):220–224. doi: 10.1007/s004170050222. [DOI] [PubMed] [Google Scholar]
- 9.Doughty MJ, Zaman ML. Human corneal thickness and its impact on intraocular pressure measures: a review and a meta-analysis approch. Surv Ophthalmol. 2000;44(5):367–408. doi: 10.1016/s0039-6257(00)00110-7. [DOI] [PubMed] [Google Scholar]
- 10.Brandt JD, Beiser JA, Kass MA, Gordon MO. Central corneal thickness in the Ocular Hypertension Treatment Study (OHTS) Ophthalmology. 2001;108(10):1779–1788. doi: 10.1016/s0161-6420(01)00760-6. [DOI] [PubMed] [Google Scholar]
- 11.Damji KF, Muni RH, Munger RM. Influence of corneal variables on accuracy of intraocular pressure measurement. J Glaucoma. 2003;12(1):69–80. doi: 10.1097/00061198-200302000-00015. [DOI] [PubMed] [Google Scholar]
- 12.Liu J, Roberts CJ. Influence of corneal biomechanical properties on intraocular pressure messurments: quantitative analysis. J Cataract Refract Surg. 2005;31(1):146–155. doi: 10.1016/j.jcrs.2004.09.031. [DOI] [PubMed] [Google Scholar]
- 13.Broman AT, Congdon NG, Bandeen-Roche K, Quigley HA. Influence of corneal structure, corneal responsiveness, and other ocular parameters on tonometric measurement of intraocular pressure. J Glaucoma. 2007;16(7):581–588. doi: 10.1097/IJG.0b013e3180640f40. [DOI] [PubMed] [Google Scholar]
- 14.Kumar N, Jivan S. Goldmann applanation tonometer calibration error checks: current practice in the UK. Eye (Lond) 2007;21(6):733–734. doi: 10.1038/sj.eye.6702316. [DOI] [PubMed] [Google Scholar]
- 15.Herndon LW. Measuring intraocular pressure-adjustments for corneal thickness and new technologies. Curr Opin Ophthalmol. 2006;17(2):115–119. doi: 10.1097/01.icu.0000193093.05927.a1. [DOI] [PubMed] [Google Scholar]
- 16.Kanngiesser HE, Kniestedt C, Robert YC. Dynamic contour tonometry: presentation of a new tonometer. J Glaucoma. 2005;14(5):344–350. doi: 10.1097/01.ijg.0000176936.16015.4e. [DOI] [PubMed] [Google Scholar]
- 17.Luce DA. Determining in vivo biomechanical properties of the cornea with ocular analyzer. J Cataract Refract Surg. 2005;31(1):156–162. doi: 10.1016/j.jcrs.2004.10.044. [DOI] [PubMed] [Google Scholar]
- 18.Kaufmann C, Bachmann LM, Thiel MA. Comparison of dynamic contour tonometry with goldmann applanation tonometry. Invest Ophthalmol Vis Sci. 2004;45(9):3118–3121. doi: 10.1167/iovs.04-0018. [DOI] [PubMed] [Google Scholar]
- 19.Kniestedt C, Lin S, Choe J, Bostrom A, Nee M, Stamper RL. Clinical comparison of contour and applanation tonometry and their relationship to pachymetry. Arch Ophthalmol. 2005;123(11):1532–1537. doi: 10.1001/archopht.123.11.1532. [DOI] [PubMed] [Google Scholar]
- 20.Ku JY, Danesh-Meyer HV, Craig JP, Gamble GD, McGhee CN. Comparison of intraocular pressure measured by Pascal dynamic contour tonometry and Goldmann applanation tonometry. Eye (Lond) 2006;20(2):191–198. doi: 10.1038/sj.eye.6701849. [DOI] [PubMed] [Google Scholar]
- 21.Martinez-de-la-Casa JM, Garcia-Feijoo J, Vico E, et al. Effect of corneal thickness on dynamic contour, rebound, and goldmann tonometry. Ophthalmology. 2006;113(12):2156–2162. doi: 10.1016/j.ophtha.2006.06.016. [DOI] [PubMed] [Google Scholar]
- 22.Schneider E, Grehn F. Intraocular pressure measurement-comparison of dynamic contour tonometry and goldmann applanation tonometry. J Glaucoma. 2006;15(1):2–6. doi: 10.1097/01.ijg.0000196655.85460.d6. [DOI] [PubMed] [Google Scholar]
- 23.Francis BA, Hsieh A, Lai MY, et al. Los Angeles Latino Eye Study Group. Effects of corneal thickness, corneal curvature, and intraocular pressure level on Goldmann applanation tonometry and dynamic contour tonometry. Ophthalmology. 2007;114(1):20–26. doi: 10.1016/j.ophtha.2006.06.047. [DOI] [PubMed] [Google Scholar]
- 24.Lanza M, Borrelli M, De Bernardo M, Filosa ML, Rosa N. Corneal parameters and difference between goldmann applanation tonometry and dynamic contour tonometry in normal eyes. J Glaucoma. 2008;17(6):460–464. doi: 10.1097/IJG.0b013e31816224bd. [DOI] [PubMed] [Google Scholar]
- 25.Ceruti P, Morbio R, Marraffa M, Marchini G. Comparison of Goldmann applanation tonometry and dynamic contour tonometry in healthy and glaucomatous eyes. Eye (Lond) 2009;23(2):262–269. doi: 10.1038/sj.eye.6703102. [DOI] [PubMed] [Google Scholar]
- 26.Lee J, Lee CH, Choi J, Yoon SY, Sung KR, et al. Comparison between dynamic contour tonometry and Goldmann applanation tonometry. Korean J Ophthalmol. 2009;23(1):27–31. doi: 10.3341/kjo.2009.23.1.27. [DOI] [PMC free article] [PubMed] [Google Scholar]
- 27.Kotecha A, White ET, Shewry JM, Garway-Heath DF. The relative effects of corneal thickness and age on Goldmann applanation tonometry and dynamic contour tonometry. Br J Ophthalmol. 2005;89(12):1572–1575. doi: 10.1136/bjo.2005.075580. [DOI] [PMC free article] [PubMed] [Google Scholar]
- 28.Doyle A, Lachkar Y. Comparison of dynamic contour tonometry with goldman applanation tonometry over a wide range of central corneal thickness. J Glaucoma. 2005;14(4):288–292. doi: 10.1097/01.ijg.0000169393.40298.05. [DOI] [PubMed] [Google Scholar]
- 29.Salvetat ML, Zeppieri M, Tosoni C, Brusini P. Comparisons between Pascal dynamic contour tonometry, the TonoPen, and Goldmann applanation tonometry in patients with glaucoma. Acta Ophthalmol Scand. 2007;85(3):272–279. doi: 10.1111/j.1600-0420.2006.00834.x. [DOI] [PubMed] [Google Scholar]
- 30.Halkiadakis I, Patsea E, Chatzimichali K, et al. Comparison of dynamic contour tonometry with Goldmann applanation tonometry in glaucoma practice. Acta Ophthalmol. 2009;87(3):323–328. doi: 10.1111/j.1755-3768.2008.01239.x. [DOI] [PubMed] [Google Scholar]
- 31.Realini T, Weinreb RN, Hobbs G. Correlation of intraocular pressure measured with goldmann and dynamic contour tonometry in normal and glaucomatous eyes. J Glaucoma. 2009;18(2):119–123. doi: 10.1097/IJG.0b013e31817d23c7. [DOI] [PMC free article] [PubMed] [Google Scholar]
- 32.Hager A, Loge K, Schroeder B, Füllhas MO, Wiegand W. Effect of central corneal thickness and corneal hysteresis on tonometry as measured by dynamic contour tonometry, ocular response analyzer, and Goldmann tonometry in glaucomatous eyes. J Glaucoma. 2008;17(5):361–365. doi: 10.1097/IJG.0b013e31815c3ad3. [DOI] [PubMed] [Google Scholar]
- 33.Pache M, Wilmsmeyer S, Lautebach S, Funk J. Dynamic contour tonometry versus Goldmann applanation tonometry: a comparative study. Graefes Arch Clin Exp Ophthalmol. 2005;243(8):763–767. doi: 10.1007/s00417-005-1124-y. [DOI] [PubMed] [Google Scholar]
- 34.Barleon L, Hoffmann EM, Berres M, Pfeiffer N, Grus FH. Comparison of dynamic contour tonometry and goldmann applanation tonometry in glaucoma patients and healthy subjects. Am J Ophthalmol. 2006;142(4):583–590. doi: 10.1016/j.ajo.2006.05.030. [DOI] [PubMed] [Google Scholar]
- 35.Dupps WJ, Jr, Wilson SE. Biomechanics and wound healing in the cornea. Exp Eye Res. 2006;83(4):709–720. doi: 10.1016/j.exer.2006.03.015. [DOI] [PMC free article] [PubMed] [Google Scholar]
- 36.Hjortdal JO, Jensen PK. In vitro measurement of corneal strain, thickness, and curvature using digital image processing. Acta Ophthalmol Scand. 1995;73(1):5–11. doi: 10.1111/j.1600-0420.1995.tb00004.x. [DOI] [PubMed] [Google Scholar]
- 37.Boote C, Dennis S, Huang Y, Quantock AJ, Meek KM. Lamellar orientation in human cornea in relation to mechanical properties. J Struct Biol. 2005;149(1):1–6. doi: 10.1016/j.jsb.2004.08.009. [DOI] [PubMed] [Google Scholar]
- 38.Daxer A, Misof K, Grabner B, Ettl A, Fratzl P. Collagen fibrils in the human corneal stroma: structure and aging. Invest Ophthalmol Vis Sci. 1998;39(3):644–648. [PubMed] [Google Scholar]
- 39.Kotecha A, White E, Schlottmann PG, Garway-Heath DF. Intraocular pressure measurement precision with the Goldmann applanation, dynamic contour, and ocular response analyzer tonometers. Ophthalmology. 2010;117(4):730–737. doi: 10.1016/j.ophtha.2009.09.020. [DOI] [PubMed] [Google Scholar]
- 40.Medeiros FA, Weinreb RN. Evaluation of the influence of corneal biomechanical properties on intraocular pressure measurements using the ocular response analyzer. J Glaucoma. 2006;15(5):364–370. doi: 10.1097/01.ijg.0000212268.42606.97. [DOI] [PubMed] [Google Scholar]
- 41.Mangouritsas G, Morphis G, Mourtzoukos S, Feretis E. Association between corneal hysteresis and central corneal thickness in glaucomatous and non-glaucomatous eyes. Acta Ophthalmol. 2009;87(8):901–905. doi: 10.1111/j.1755-3768.2008.01370.x. [DOI] [PubMed] [Google Scholar]
- 42.Burgoyne CF, Downs JC, Bellezza AJ, Suh JK, Hart RT. The optic nerve head as a biomechanical structure: a new paradigm for understanding the role of IOP-related stress and strain in the pathophysiology of glaucomatous optic nerve head damage. Prog Retin Eye Res. 2005;24(1):39–73. doi: 10.1016/j.preteyeres.2004.06.001. [DOI] [PubMed] [Google Scholar]
- 43.Sigal IA, Flanagan JG, Ethier CR. Factors influencing optic nerve head biomechanics. Invest Ophthalmol Vis Sci. 2005;46(11):4189–4199. doi: 10.1167/iovs.05-0541. [DOI] [PubMed] [Google Scholar]
- 44.Kniestedt C, Nee M, Stamper RL. Accuracy of dynamic contour tonometry compared with applanation tonometry in human cadaver eyes of different hydration states. Graefes Arch Clin Exp Ophthalmol. 2005;243(4):359–366. doi: 10.1007/s00417-004-1024-6. [DOI] [PubMed] [Google Scholar]
- 45.Kniestedt C, Nee M, Stamper RL. Dynamic contour tonometry: a comparative study on human cadaver eyes. Arch Ophthalmol. 2004;122(9):1287–1293. doi: 10.1001/archopht.122.9.1287. [DOI] [PubMed] [Google Scholar]
- 46.La Rosa FA, Gross RL, Orengo-Nania S. Central corneal thickness of Caucasians and African Americans in glaucomatous and non-glaucomatous populations. Arch Ophthalmol. 2001;119(1):23–27. [PubMed] [Google Scholar]
- 47.Hahn S, Azen S, Ying-Lai M, Varma R. Los Angeles Latino Eye Study Group. Central corneal thickness in Latinos. Invest Ophthalmol Vis Sci. 2003;44(4):1508–1512. doi: 10.1167/iovs.02-0641. [DOI] [PubMed] [Google Scholar]
- 48.Shimmyo M, Ross AJ, Moy A, Mostafavi R. Intraocular pressure, Goldmann applanation tension, corneal thickness and corneal curvature in Caucasians, Asians, Hispanics, and African Americans. Am J Ophthalmol. 2003;136(4):603–613. doi: 10.1016/s0002-9394(03)00424-0. [DOI] [PubMed] [Google Scholar]
- 49.Pepose JS, Feigenbaum SK, Qazi MA, Sanderson JP, Roberts CJ. Changes in corneal biomechanics and intraocular pressure following LASIK using static, dynamic, and noncontact tonometry. Am J Ophthalmol. 2007;143(1):39–47. doi: 10.1016/j.ajo.2006.09.036. [DOI] [PubMed] [Google Scholar]
- 50.Siganos DS, Papastergiou GI, Moedas C. Assessment of the Pascal dynamic contour tonometer in monitoring intraocular pressure in unoperated eyes and eyes after LASIK. J Cataract Refract Surg. 2004;30(4):746–751. doi: 10.1016/j.jcrs.2003.12.033. [DOI] [PubMed] [Google Scholar]
- 51.Kaufmann C, Bachmann LM, Thiel MA. Intraocular pressure measurements using dynamic contour tonometry after laser in situ keratomileusis. Invest Ophthalmol Vis Sci. 2003;44(9):3790–3794. doi: 10.1167/iovs.02-0946. [DOI] [PubMed] [Google Scholar]
- 52.Shah S, Laiquzzaman M, Cunliffe I, Mantry S. The use of the Reichert ocular response analyser to establish the relationship between ocular hysteresis, corneal resistance factor and central corneal thickness in normal eyes. Cont Lens Anterior Eye. 2006;29(5):257–262. doi: 10.1016/j.clae.2006.09.006. [DOI] [PubMed] [Google Scholar]
- 53.Feltgen N, Leifert D, Funk J. Correlation between central corneal thickness, applanation tonometry, and direct intracameral IOP readings. Br J Ophthalmol. 2001;85(1):85–87. doi: 10.1136/bjo.85.1.85. [DOI] [PMC free article] [PubMed] [Google Scholar]
- 54.Gunvant P, Newcomb RD, Kirstein EM, Malinovsky VE, Madonna RJ, Meetz RE. Measuring accurate IOPs: does correction factor help or hurt? Clin Ophthalmol. 2010;21(4):611–616. doi: 10.2147/opth.s11105. [DOI] [PMC free article] [PubMed] [Google Scholar]
- 55.Ang GS, Nicholas S, Wells AP. Poor utility of intraocular pressure correction formulae in individual glaucoma and glaucoma suspect patients. Clin Experiment Ophthalmol. 2010;39(2):111–118. doi: 10.1111/j.1442-9071.2010.02445.x. [DOI] [PubMed] [Google Scholar]
- 56.Yoo C, Eom YS, Kim YY. Goldmann applanation tonometry and dynamic contour tonometry in eyes with elevated intraocular pressure (IOP): comparison in the same eyes after subsequent medical normalization of IOP. Graefes Arch Clin Exp Ophthalmol. 2010;248(11):1611–1616. doi: 10.1007/s00417-010-1462-2. [DOI] [PubMed] [Google Scholar]
- 57.Boehm AG, Weber A, Pillunat LE, Koch R, Spoerl E. Dynamic contour tonometry in comparison to intracameral IOP measurements. Invest Ophthalmol Vis Sci. 2008;49(6):2472–2477. doi: 10.1167/iovs.07-1366. [DOI] [PubMed] [Google Scholar]
- 58.Sullivan-Mee M, Gerhardt G, Halverson KD, Qualls C. Repeatability and reproducibility for intraocular pressure measurement by dynamic contour, ocular response analyzer, and goldmann applanation tonometry. J Glaucoma. 2009;18(9):666–673. doi: 10.1097/IJG.0b013e31819c487d. [DOI] [PubMed] [Google Scholar]


