

Abstract
Human succinic semialdehyde dehydrogenase deficiency, an autosomal recessive disorder of γ-aminobutyric acid (GABA) catabolism, was modeled by a murine model sharing the phenotype of ataxia and seizures. Magnetic resonance imaging (MRI) with volumetry was obtained on 7 patients versus controls, and MRI with stereology was derived in 3 murine genotypes: null, wild-type, and heterozygous mutants. All patients had T1 hypointensity and T2 hyperintensity in globus pallidus, and 5 also had similar changes in subthalamic and cerebellar dentate nuclei. There was a trend for patients to have a smaller cerebellar vermis. Homozygous null mice had significantly lower total brain and cerebellar volumes than wild-types and heterozygotes. Stereology confirmed cerebellar atrophy and was otherwise normal in multiple regions. Cerebellar volume loss is present in the murine disorder with a trend for cerebellar atrophy in patients. Reduced cerebellar volume can reflect neurodegeneration and may be related to the clinical manifestations.
Keywords: succinic semialdehyde dehydrogenase deficiency, cerebellar atrophy
Succinic semialdehyde dehydrogenase (EC 1.2.1.24) deficiency (γ-hydroxybutyric [GHB] aciduria; OMIM 271980, 610045) is an autosomal recessively inherited neurometabolic disorder of γ-aminobutyric acid (GABA) metabolism. The succinic semialdehyde dehydrogenase gene (aldehyde dehydrogenase 5 family, member A1: ALDH5A1) maps to chromosome 6p22.1 Enzyme deficiency is demonstrable in blood lymphocytes.2 Oxidative conversion of succinic semialdehyde to succinic acid is impaired, which leads to production of GHB.
Succinic semialdehyde dehydrogenase deficiency has considerable phenotypic heterogeneity. Patients usually present with mild to severe developmental delay, predominantly involving expressive language. Other typical clinical signs and symptoms include hypotonia, truncal or appendicular ataxia, hyporeflexia, behavior disorders, and seizures. Patients often develop neuropsychiatric symptoms such as inattention, anxiety, hyperkinesis, sleep disturbances, and excessive daytime somnolence.3 Behavior problems including autism spectrum disorder may be associated, which, in combination with hypotonia and ataxia, suggest cerebellar involvement in the pathophysiology.4 A minority of patients (approximately 10%) have a progressive course featuring developmental regression and substantial extrapyramidal manifestations, including dystonia, choreoathetosis, and myoclonus.5
Reported neuroimaging findings include cerebral atrophy and T2 hyperintensities in globus pallidus, subcortical white matter, cerebellar dentate nucleus, and brainstem.3 Positron emission tomography with fluorodeoxyglucose has shown decreased cerebellar uptake.6 Magnetic resonance spectroscopy shows elevated parenchymal GABA in affected subjects, but not obligate heterozygotes.7,8
Hogema and coworkers developed a mouse model of succinic semialdehyde dehydrogenase deficiency, phenotypically expressed as ataxia, failure-to-thrive, and seizures.9 Null mice progressively undergo generalized absence seizures, starting at about day 14, followed by convulsive seizures at day 18 to 19, and ultimately lethal tonic-clonic status epilepticus by the third to fourth week of life.10
We sought to determine if there were brain structural abnormalities in the Aldh5a1 mouse model, or evidence for regional atrophy, using a combination of ex vivo MRI and a set of histologic and stereologic studies in homozygous, heterozygous, and wild-type mice. We also performed MRI on a group of affected subjects, parents (obligate heterozygotes), and healthy volunteers, and measured cerebellar volumes. We sought to determine whether cerebellar abnormalities were present in the human condition on volumetric MRI in parallel with radiographic and histologic studies in the animal model.
Materials and Methods
MRI Studies in an Ex Vivo Sample of Succinic Semialdehyde Dehydrogenase Animal Model
A total of 39 mice (14 succinic semialdehyde dehydrogenase −/−; 14 succinic semialdehyde dehydrogenase +/+; and 11 succinic semialdehyde dehydrogenase +/−) were perfused at postnatal day 19 utilizing the transcardiac perfusion technique previously described.11 This time was selected to avoid seizure development in the homozygous mice. Each excised head was kept in formalin until MRI was performed. For imaging, heads were removed from formalin, the surface moisture was minimized, and each one was placed in a 12 mm i.d. glass sample tube and submerged in Fomblin, a proton-free perfluorinated polycarbon oil for magnetic susceptibility matching. The brain was centered in a 13.5 mm i.d. solenoid, transmit/receive radiofrequency coil, in a horizontal 7 Tesla Bruker Avance MRI scanner (Bruker Biospin, Inc, Bellerica, MA). A 3-dimensional volume, encompassing the whole brain, was specified using 3 orthogonal scout images. Fast spin echo 3-D images of the whole brain were acquired (number of echos = 8, repetition time = 3000 ms, echo time = 9 ms, number of averages = 2, total scan time ∼ 12 hours) to achieve an isotropic image resolution of 62 μm.
To calculate volumes, a series of axial slices, interleaved at 500 μm, were specified from 3-D images. The areas encompassing the whole brain and corresponding cerebellum were evaluated using image display software and tracing the periphery of the regions of interest. These areas were extrapolated over the interleaved gaps to calculate volumes. Subsequently, brains were removed from the skull after MRI and dry weight was measured. The volumes of the brains were calculated assuming a density of 1g/cm3. Investigators were blinded to genotype during volumetry.
Histology and Stereology in Mice
These studies used a combination of the Cavalieri principle and point counting techniques,12 as reported in previous studies involving the assessment of brain volumes in humans,13 nonhuman primates,14 and rodents.15 For each brain region, a systematic random sample of 5 to 6 sections was selected and the reference space of interest was outlined using the mouse cursor.16 The software was automatically positioned on a point-grid randomly over each section within the outlined regions. The distance between points was selected to produce a coefficient of error for individual volume estimates of less than 5%.
Five subregions in a single hemisphere (left) from 15 brains were divided into 3 groups (5 per group): wild-type (controls), heterozygotes, and mutants. The following were reference volumes for the present study: neocortex (Vntx); hippocampus Vhippo, which included the 4 subregions of Ammon's horn and the gyrus dentatus; cerebellum (Vcereb), including deep cerebellar nuclei (dentate, interpositus [emboliform + globose], and fastigial), white matter tracts in the deep regions, Purkinje, granule, molecular cell layers, white matter, and the cerebellar cortex; and cerebral forebrain (Vsb), including caudate, putamen, basal forebrain, amygdala, thalamus, globus pallidus, white matter, and the structures included in Vntx. The fifth subregion, the subcortical volume (Vsub), was calculated as the difference between Vbrain and Vntx.
Human Studies
We studied 7 affected patients (4 male, age 15.7 ± 5.7 years), 10 parents (6 male, age 43.6 ± 5.8), and 8 healthy volunteer controls (4 male, 31.8 ± 10.2 years). Affected patients and family members were screened for inclusion by 1 investigator having extensive clinical experience with succinic semialdehyde dehydrogenase deficiency (Dr Pearl). Inclusion criteria were clinical characteristics consistent with succinic semialdehyde dehydrogenase deficiency, persistent 4-hydroxybutyric aciduria (GHB aciduria), and confirmation of deficient enzymatic activity in lymphocytes.
All subjects underwent MRI using a 1.5-T Horizon scanner (General Electric, Fairfield, CT). For volume measurements, T1-weighted spoiled gradient images (repetition time, 27 ms; minimum echo time; flip angle 20°) were acquired in coronal orientation. MRIs were analyzed using MEDx imaging software (Medical Numerics, Inc, Germantown, MD). Regions of interest were manually traced in each slice in which they appeared by an investigator blinded to the subject's age and diagnosis. The areas of each region of interest were summed and multiplied by the thickness of the total number of slices used. The extent of the cerebellar vermis in the coronal plane was defined according to the method of Press et al.17 The cerebellar peduncles were not included in the total volume of cerebellar hemispheres. The cerebellar vermis volume was normalized by dividing the measured region of interest by the total volume of both cerebral hemispheres.
Data analysis, including analysis of variation (ANOVA) with post hoc Bonferroni tests, was performed with Systat (Systat Inc, Point Richmond, CA).
Results
Mouse MRI
Morphological changes in internal structures were not identified. The homozygous mutant population had a larger cerebellar-cranial difference than both the wild-type and heterozygous group (Table 1). One-way ANOVA showed significant effects of mutation status on total brain (F ratio, 18.190) and cerebellar volume (F ratio, 26.486). Post hoc pairwise comparisons (Bonferroni) showed that homozygous null mice had significantly lower total brain and cerebellar volumes (Table 1) compared to the wild-type and heterozygous mice. The 2 latter groups did not differ. Extracted total brain volume calculations based on dry weight showed similar results, with smaller average values for homozygous null (0.34 ± 0.02), compared to heterozygous (0.37 ± 0.02) and wild-type mice (0.39 ± 0.03) (F ratio, 11.7; null vs wild-type P < .001; null vs heterozygous P = .06).
Table 1.
Mouse Brain Volumetrya
| Group | Total Brain (Mean ± SD) (Radiographic Volumetry) | Cerebellum (Mean ± SD) (Radiographic Volumetry) | Cerebellum (Mean ± SD) (Stereology) |
|---|---|---|---|
| Wild-type | 0.407 ± 0.034 | 0.050 ± 0.005 | 0.0156 ± 0.00093 |
| Heterozygous mutant | 0.399 ± 0.028 | 0.050 ± 0.006 | 0.0135 ± 0.00098 |
| Homozygous null | 0.340 ± 0.031b | 0.038 ± 0.003b | 0.0120 ± 0.001c |
Cubic centimeters.
P < .001 vs wild-type and heterozygous mutant.
P < .017 vs wild-type and heterozygous mutant.
Mouse Stereology
Regional volumes were derived for individual mice (n = 15) and group means (SEM) for 3 genotypes (wild-type, heterozygous, homozygous mutant; n = 5 per group). Inspection of the mean +/- SEM values for wild-type versus mutant groups indicated possible differences for 2 brain volumes, cerebellum (Vcereb) and subcortical structures (Vsub). ANOVA results revealed a statistically significant group difference for Vcereb (P < .017) (Table 1), but nonsignificant differences for Vsub (P < .28). Comparison of volume data for other regions in wild-type versus mutant groups confirmed a low probability of group differences (P < .50). No volume differences were present in any brain region in heterozygotes compared to wild-type controls (P < .17 for Vcereb; P < .20 for all other regions).
Human Imaging
Five patients had symmetric homogeneous hypointensity on T1-weighted sequences and hyperintensity on T2-weighted sequences in globus pallidus, subthalamic nuclei, and cerebellar dentate nuclei. The other 2 patients had signal abnormality limited to the globus pallidus, which was asymmetrical in 1. There were no cerebral cortical abnormalities.
With group as a main factor and age as a covariate, there was a trend (F ratio, 2.79; P = .08) for affected subjects to have a smaller cerebellar vermis, with no effect of age (P > .20) (Table 2). Figures 1A and 1B show cerebellar atrophy on structural imaging in 1 patient.
Table 2.
Human Cerebellar Vermis Volumesa in Succinic Semialdehyde Dehydrogenase Deficiency
| Group | Vermis (Mean ± SD) | Vermis Normalized to Total Cerebral Volume (Mean ± SD) |
|---|---|---|
| Healthy volunteers (n = 8) | 8734 ± 1256 | 0.065 ± 0.006 |
| Parents (n = 10) | 8496 ± 1035 | 0.060 ± 0.009 |
| Affected subjects (n = 7) | 7427 ± 1427 | 0.056 ± 0.011b |
Cubic centimeters.
F ratio 2.79, P = .08 indicate a trend for affected subjects to have a smaller cerebellar vermis, with no effect of age (P > .20).
Figure 1.
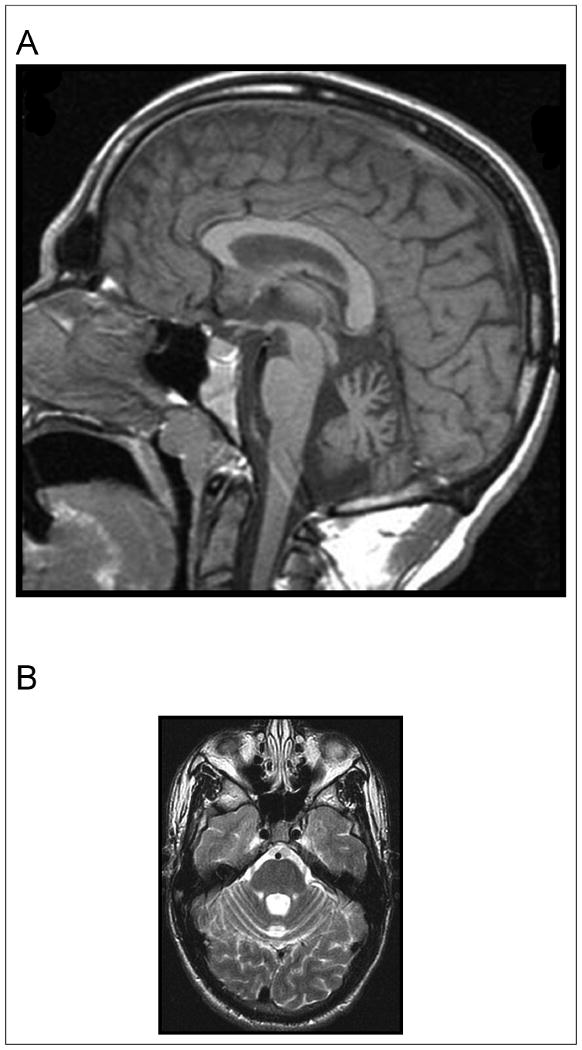
(A) Midsaggittal 1.5 T magnetic resonance imaging (MRI) demonstrating cerebellar atrophy predominantly affecting the midline vermis in subject with succinic semialdehyde dehydrogenase deficiency. (B) Axial 1.5 T MRI demonstrating cerebellar atrophy predominantly affecting the midline vermis in subject with succinic semialdehyde dehydrogenase deficiency.
Discussion
Significant cerebral and cerebellar volume loss were found in homozygous succinic semialdehyde dehydrogenase deficient mutant mice compared to wild-type controls and heterozygous animals, on both MRI and stereological analysis. There were no differences in total brain volume or subregions in heterozygous mice versus wild-type controls.
The murine findings parallel MRI measurements in patients who show a trend toward cerebellar vermian atrophy compared to obligate heterozygotes (parents) and healthy control volunteers. Although the natural history of murine succinic semialdehyde dehydrogenase deficiency is fatal demise with status epilepticus, the reduced cerebellar volume in this study was found in animals that had not experienced any observed convulsive seizures. Moreover, the patients studied had relatively mild and well-controlled epilepsy, and had not been exposed to phenytoin, the antiepileptic drug most closely associated with cerebellar atrophy.18 Thus, both animal and human data suggest the findings are related to the underlying metabolic disorder. The mutant mice do manifest general failure to thrive, although birth weights are comparable to wild-type mice, raising the possibility that the changes reported in this study are because of an indirect result of failure to thrive with general poor health or decreased feeding. Nevertheless, the end result is loss of cerebellar volume, and some of the symptoms of succinic semialdehyde dehydrogenase deficiency may be because of this cerebellar atrophy.
The MRI signal abnormalities in human images were not identified in mouse brain. This may have been because of the sequence having relatively short repetition times leading to decreased T2 weighting or effects of brain fixation. Alternatively, there may be species-related differences in the expression of the genetic defect. The latter situation has been seen in mouse models in neurofibromatosis type 1.19 Developmental differences between mouse and man could also affect imaging findings.4,20
Clinical manifestations associated with cerebellar dysfunction, ie, ataxia and hypotonia, are characteristic of human succinic semialdehyde dehydrogenase deficiency. Moreover, cerebellar dysfunction has been closely associated with behavioral and cognitive deficits including hyperactivity, autistic symptoms, and speech disorders, which are all common in succinic semialdehyde dehydrogenase deficiency.21,22 GABA alterations have been implicated in the pathophysiology of learning disabilities, autism, behavior problems, and developmental dyslexia.23-25 A recent review26 highlighted the relationships of functional polymorphisms in the succinic semialdehyde dehydrogenase gene and quantitative trait loci, including cognition and dyslexia. Cerebellar volume loss is demonstrated in both human and murine deficiency of succinic semialdehyde dehydrogenase, an enzyme integral to GABA catabolism.
Acknowledgments
This work was completed in the Clinical Epilepsy Section and Mouse Imaging Facility, National Institute of Neurological Disease and Stroke, National Institutes of Health. Peter R. Mouton, PhD, provided the stereological analyses of brain volumes. We thank Susan Combs, BA, for her technical and editorial assistance.
Funding: The authors disclosed receipt of the following financial support for the research and/or authorship of this article: The study was supported by the NINDS Division of Intramural Research; NIH NS 40270 (Dr Gibson) and HD 58553 (Dr Gibson, Dr Pearl); and the Pediatric Neurotransmitter Disease Association (Dr Pearl).
Footnotes
Reprints and permission: sagepub.com/journalsPermissions.nav
Declaration of Conflicting Interests: The authors declared no potential conflicts of interest with respect to the authorship and/or publication of this article.
References
- 1.Chambliss KL, Caudle DL, Hinson DD, et al. Molecular cloning of the mature NAD(+)-dependent succinic semialdehyde dehydrogenase from rat and human. cDNA isolation, evolutionary homology, and tissue expression. J Biol Chem. 1995;270:461–467. doi: 10.1074/jbc.270.1.461. [DOI] [PubMed] [Google Scholar]
- 2.Gibson KM, Aramaki S, Sweetman L, et al. Stable isotope dilution analysis of 4-hydroxybutyric acid: an accurate method for quantification in physiological fluids and the prenatal diagnosis of 4-hydroxybutyric aciduria. Biomed Environ Mass Spectrom. 1990;19:89–93. doi: 10.1002/bms.1200190207. [DOI] [PubMed] [Google Scholar]
- 3.Pearl PL, Gibson KM, Acosta MT, et al. Clinical spectrum of succinic semialdehyde dehydrogenase deficiency. Neurology. 2003;60:1413–1417. doi: 10.1212/01.wnl.0000059549.70717.80. [DOI] [PubMed] [Google Scholar]
- 4.Knerr I, Gibson KM, Jakobs C, Pearl PL. Neuropsychiatric morbidity in adolescent and adult succinic semialdehyde dehydrogenase deficiency patients. CNS Spectr. 2008;13:598–605. doi: 10.1017/s1092852900016874. [DOI] [PMC free article] [PubMed] [Google Scholar]
- 5.Pearl PL, Acosta MT, Wallis DD, et al. Dyskinetic features of succinate semialdehyde dehydrogenase deficiency, a GABA degradative defect. In: Fernandez-Alvarez E, Arzimanoglu A, Tolosa E, editors. Paediatric Movement Disorders: Progress in Understanding. Montrouge, France: John Libbey Eurotext; 2005. pp. 203–212. [Google Scholar]
- 6.Al-Essa MA, Bakheet SM, Patay ZJ, Powe JE, Ozand PT. Clinical, fluorine-18 labeled 2-fluoro-2-deoxyglucose positron emission tomography (FDG PET), MRI of the brain and biochemical observations in a patient with 4-hydroxybutyric aciduria; a progressive neurometabolic disease. Brain Dev. 2000;22:127–131. doi: 10.1016/s0387-7604(99)00121-7. [DOI] [PubMed] [Google Scholar]
- 7.Novotny EJ, Jr, Fulbright RK, Pearl PL, Gibson KM, Rothman DL. Magnetic resonance spectroscopy of neurotransmitters in human brain. Ann Neurol. 2003;54:S25–S31. doi: 10.1002/ana.10697. [DOI] [PubMed] [Google Scholar]
- 8.Ethofer T, Seeger U, Klose U, et al. Proton MR spectroscopy in succinic semialdehyde dehydrogenase deficiency. Neurology. 2004;62:1016–1018. doi: 10.1212/01.wnl.0000115385.45515.df. [DOI] [PubMed] [Google Scholar]
- 9.Hogema BM, Gupta M, Senephansiri H, et al. Pharmacologic rescue of lethal seizures in mice deficient in succinate semialdehyde dehydrogenase. Nat Genet. 2001;29:212–216. doi: 10.1038/ng727. [DOI] [PubMed] [Google Scholar]
- 10.Gupta M, Polinsky M, Senephansiri H, et al. Seizure evolution and amino acid imbalances in murine succinate semialdehyde dehydrogenase (SSADH) deficiency. Neurobiol Dis. 2004;16:556–562. doi: 10.1016/j.nbd.2004.04.008. [DOI] [PubMed] [Google Scholar]
- 11.Bai Y, Markham K, Chen F, et al. The in vivo brain interactome of the amyloid precursor protein. Mol Cell Proteomics. 2008;7:15–34. doi: 10.1074/mcp.M700077-MCP200. [DOI] [PubMed] [Google Scholar]
- 12.Gundersen HJ, Jensen EB. The efficiency of systematic sampling in stereology and its prediction. J Microsc. 1987;147:229–263. doi: 10.1111/j.1365-2818.1987.tb02837.x. [DOI] [PubMed] [Google Scholar]
- 13.Subbiah P, Mouton P, Fedor H, McArthur JC, Glass JD. Stereological analysis of cerebral atrophy in human immunodeficiency virus-associated dementia. J Neuropathol Exp Neurol. 1996;55:1032–1037. [PubMed] [Google Scholar]
- 14.Mouton PR, Price DL, Walker LC. Empirical assessment of synapse numbers in primate neocortex. J Neurosci Methods. 1997;75:119–126. doi: 10.1016/s0165-0270(97)00058-7. [DOI] [PubMed] [Google Scholar]
- 15.Mouton PR, Long JM, Lei DL, et al. Age and gender effects on microglia and astrocyte numbers in brains of mice. Brain Res. 2002;956:30–35. doi: 10.1016/s0006-8993(02)03475-3. [DOI] [PubMed] [Google Scholar]
- 16.Paxinos G, Franklin KBJ. The Mouse Brain in Stereotaxic Coordinates. 2nd. New York, NY: Academic Press; 2003. [Google Scholar]
- 17.Press GA, Murakami JW, Courchesne E, Grafe M, Hesselink JR. The cerebellum: 3. Anatomic-MR correlation in the coronal plane. AJR Am J Roentgenol. 1990;154:593–602. doi: 10.2214/ajr.154.3.2106226. [DOI] [PubMed] [Google Scholar]
- 18.Lee SK, Mori S, Kim DJ, et al. Diffusion tensor MRI and fiber tractography of cerebellar atrophy in phenytoin users. Epilepsia. 2003;44:1536–1540. doi: 10.1111/j.0013-9580.2003.43502.x. [DOI] [PubMed] [Google Scholar]
- 19.Rosenbaum T, Engelbrecht V, Krolls W, van Dorsten FA, Hoehn-Berlage M, Lenard HG. MRI abnormalities in neurofibromatosis type 1 (NF1): a study of men and mice. Brain Dev. 1999;21:268–273. doi: 10.1016/s0387-7604(99)00024-8. [DOI] [PubMed] [Google Scholar]
- 20.Blasi P, Palmerio F, Aiello A, Rocchi M, Malaspina P, Novelletto A. SSADH variation in primates: intra- and interspecific data on a gene with a potential role in human cognitive functions. J Mol Evol. 2006;63:54–68. doi: 10.1007/s00239-005-0154-8. [DOI] [PubMed] [Google Scholar]
- 21.Steinlin M. Cerebellar disorders in childhood: cognitive problems. Cerebellum. 2008;7:607–610. doi: 10.1007/s12311-008-0083-3. [DOI] [PubMed] [Google Scholar]
- 22.Timmann D, Daum I. Cerebellar contributions to cognitive functions: a progress report after two decades of research. Cerebellum. 2007;6:159–162. doi: 10.1080/14734220701496448. [DOI] [PubMed] [Google Scholar]
- 23.Blatt GJ. GABAergic cerebellar system in autism: a neuropathological and developmental perspective. Int Rev Neurobiol. 2005;71:167–178. doi: 10.1016/s0074-7742(05)71007-2. [DOI] [PubMed] [Google Scholar]
- 24.Fatemi SH, Reutiman TJ, Folsom TD, Thuras PD. GABA(A) receptor downregulation in brains of subjects with autism. J Autism Dev Disord. 2009;39:223–230. doi: 10.1007/s10803-008-0646-7. [DOI] [PMC free article] [PubMed] [Google Scholar]
- 25.Fatemi SH, Folsom TD, Reutiman TJ, Thuras PD. Expression of GABA(B) receptors is altered in brains of subjects with autism. Cerebellum. 2009;8:64–69. doi: 10.1007/s12311-008-0075-3. [DOI] [PMC free article] [PubMed] [Google Scholar]
- 26.Malaspina P, Picklo MJ, Jakobs C, Snead OC, Gibson KM. Comparative genomics of aldehyde dehydrogenase 5a1 (succinate semialdehyde dehydrogenase) and accumulation of gamma-hydroxybutyrate associated with its deficiency. Hum Genomics. 2009;3:106–120. doi: 10.1186/1479-7364-3-2-106. [DOI] [PMC free article] [PubMed] [Google Scholar]