Abstract
Amblyopia, a developmental disorder of spatial vision, is thought to result from a cascade of cortical deficits over several processing stages beginning at the primary visual cortex (V1). However, beyond V1, little is known about how cortical development limits the visual performance of amblyopic primates. We quantitatively analyzed the monocular and binocular responses of V1 and V2 neurons in a group of strabismic monkeys exhibiting varying depths of amblyopia. Unlike in V1, the relative effectiveness of the affected eye to drive V2 neurons was drastically reduced in the amblyopic monkeys. The spatial resolution and the orientation bias of V2, but not V1, neurons were subnormal for the affected eyes. Binocular suppression was robust in both cortical areas, and the magnitude of suppression in individual monkeys was correlated with the depth of their amblyopia. These results suggest that the reduced functional connections beyond V1 and the subnormal spatial filter properties of V2 neurons might have substantially limited the sensitivity of the amblyopic eyes and that interocular suppression was likely to have played a key role in the observed alterations of V2 responses and the emergence of amblyopia.
Keywords: amblyopia, macaque monkeys, strabismus, V2
Introduction
Experiencing strabismus early in life, and hence, the chronic interocular decorrelation of cortical input signals, leads to compromised binocular vision and often, amblyopia. Amblyopic primates typically exhibit reductions in spatial contrast sensitivity and optotype acuity in the affected eye (Hess and Howell 1977; Levi and Harwerth 1977; Kiorpes et al. 1998). Amblyopic subjects are also known to exhibit difficulties in global perceptual tasks that require precise pooling of neighboring, local feature information (Hess et al. 1999; Kovacs et al. 1999; Chandna et al. 2001; Kozma and Kiorpes 2003; Norcia et al. 2005; Levi 2008). Fixation instability (Zhang et al. 2008) and anomalous eye movements under monocular viewing conditions are also common among strabismic and/or amblyopic primates (Das et al. 2005; Das and Mustari 2007; Zhang et al. 2008).
The neural basis of “reduced” vision in amblyopic primates is not well understood. Reductions in spatial resolution and contrast sensitivity of V1 neurons and/or an impoverished sampling by V1 are typically invoked to explain “low-level perceptual deficits” (see reviews by Kiorpes and Movshon 2003; Chino et al. 2004; Anderson and Swettenham 2006; Daw 2006; Kiorpes 2006; Levi 2006). However, the previous study in V1 of monkeys exhibiting strabismic amblyopia reported that even in severely amblyopic monkeys, a relatively small proportion of V1 neurons exhibit reductions in contrast sensitivity at high spatial frequencies and/or slightly lower spatial resolutions, and the magnitude of these V1 anomalies is too small to account for the severity of perceptual losses for the same subjects (Kiorpes et al. 1998; Kiorpes and Movshon 2003).
An emerging view of the neural basis of strabismic amblyopia is that the major cortical alterations that limit a wide range of visual performances are likely to occur beyond V1 (Kiorpes and Movshon 2003; Chino et al. 2004; Kiorpes 2006; Levi 2006). However, little is known about the receptive-field properties of extrastriate neurons in amblyopic monkeys except for the recent study in area MT of amblyopic monkeys where abnormal visual motion processing was reported (El-Shamayleh et al. 2010). Moreover, the neural basis of spatial vision deficits in amblyopic monkeys has not been explored in extrastriate visual areas.
Area V2 in normal adult monkeys directly receives a substantial proportion of V1 outputs (e.g., Van Essen et al. 1986; Sincich and Horton 2002, 2003; Sincich et al. 2010) and V2 neurons often exhibit more “complex” spatial visual processing than V1 units (Hegde and Van Essen 2000; Ito and Komatsu 2004; Anzai et al. 2007; Dillenburger and Roe 2010; Willmore et al. 2010). Considerable information is available in the literature on the postnatal development of the receptive-field properties of V2 neurons in normal infant monkeys (Zhang et al. 2005a, 2005b; Zheng et al. 2007; Maruko et al. 2008). However, there is no published study on how early experimental strabismus alters the functional development of V2 neurons in nonhuman primates. We therefore quantitatively analyzed both the monocular spatial receptive-field properties and the binocular interaction properties of V2 neurons in monkeys exhibiting strabismic amblyopia and compared the results to those obtained from V1 neurons in the same animals. Here we report that the neuronal circuits responsible for the spatial receptive-field properties of V2, but not V1, neurons were subnormal, and the functional connections from V1 to V2 were severely reduced for the amblyopic eye. These V2 deficits in individual monkeys were correlated with the high prevalence of binocular suppression in both cortical areas and with the depth of amblyopia.
Materials and Methods
All experimental and animal care procedures were in compliance with the Guiding Principles for Research Involving Animals and were approved by the Institutional Animal Care and Use Committee of the University of Houston.
Subjects
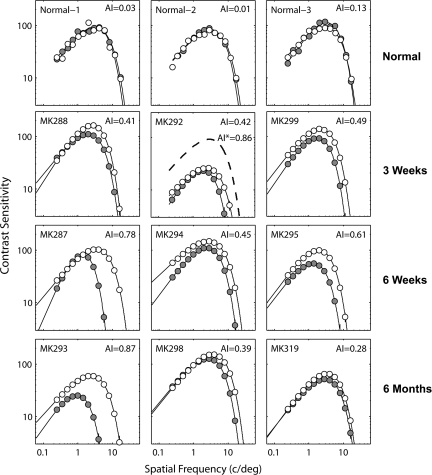
The subjects were 12 infant rhesus monkeys (Macaca mulatta) obtained from the University of Texas, Animal Resources Center. Three monkeys were used for normally reared controls and 9 monkeys received surgical procedures to create esotropia at 3 weeks (n = 3), 6 weeks (n = 3), and 6 months (n = 3) of age. The procedures for creating strabismus (esotropia) by surgical means have been described in detail elsewhere (Crawford and Harwerth 2004). Briefly, experimental strabismus was created in 9 infant monkeys by surgically shortening the medial rectus muscle and transecting the lateral rectus muscle of the right eye under Ketamine HCl (30 mg/kg)/acepromazine maleate (0.15–0.2 mg/kg) anesthesia. Although we did not make any quantitative assessment of comitance, the surgical method is known to produce incomitant deviations (i.e., the size of deviations varies with direction of gaze). However, none of our experimental monkeys adopted a head posture by which they could reduce the size of the deviations. Strabismic and normal infant monkeys were reared in our animal facility under a 12-h light/dark cycle. Around 18–24 months of age, behavioral testing was conducted to measure monocular capacities (and other visual functions that are not related to this study). Measurement of spatial contrast sensitivity functions revealed a wide range of contrast sensitivity loss in the operated monkeys (Fig. 1). Upon the completion of behavioral testing around 4 years of age, the microelectrode recording experiments were conducted in V1 and V2 of each monkey.
Figure 1.
Spatial contrast sensitivity functions of 3 normal (top row) and experimental monkeys with the onset age of 3 weeks (second row), 6 weeks (third row) and 6 months (bottom row). For the monkey (MK-292) that exhibited “bilateral amblyopia,” AI values are shown for an interocular comparison and the comparison between the operated eye (filled symbols) and the average function of the 3 normal monkeys (dotted line).
Measurements of Ocular Alignment
The monkey's interocular alignments were measured using infrared photoretinoscopy (Schaeffel et al. 1987; Hung et al. 1995), which recorded the position of the first Purkinje image relative to the center of the pupil (Hirshberg corneal reflex test, Quick and Boothe 1989). A high-output IR LED was positioned at 82 cm in front of the monkey's eyes, and pictures of the reflected light were obtained continuously using a video camera. Interocular alignment was assessed by averaging the results from at least 3 frames for a given measurement. The alignment was assessed several times before and immediately after strabismus surgery and at relatively regular intervals (e.g., roughly once/week) until about 7–10 months of age, that is, during the most sensitive segment of the “critical period for binocular vision development” (Harwerth et al. 1986; Kiorpes and Movshon 2003; Chino et al. 2004). We made adjustments in the calculations by taking the continuous changes in the anterior chamber depth and corneal curvature during the early development (Qiao-Grinder 2009), with the following equation: deviation angle = arcsin (p/d), where p is corneal displacement in mm and d is the difference between corneal radius and the anterior chamber depth at a given age. Thus, 1-mm deviation at 3 weeks of age corresponds to 14.9 degrees deviation, whereas 1-mm deviation equals 17.5 degrees at 6 months of age. These values were generally similar to those in adults reported by Quick and Boothe (1989).
Behavioral Testing
Spatial contrast sensitivity functions were obtained separately for each eye when the monkeys were at least 18 months of age using operant procedures described previously (Harwerth et al. 1980; Smith et al. 1985; Wensveen et al. 2006). Briefly, the monkeys were placed in a primate chair inside a dark sound-attenuating chamber. The primate chair was fitted with a response lever on the waist plate and a drink spout on the neck plate through which orange drink reinforcement was delivered. The animal's optimal spectacle correction determined by refraction was held in a facemask at about a 14-mm vertex distance. The visual stimuli (Gabor patches) were generated on a 20-inch video monitor (Nano Flexscan 9080; Eizo Nanao) that operated at 100 Hz by using a graphic board (VSG; Cambridge Research Systems). The usable display subtended a visual angle of 11 × 14° at the 114 cm viewing distance and had a space average luminance of 60 cd/m2. The behavioral paradigm was a temporal-interval detection task that required the monkey to press and hold down the response lever to initiate a trial and then release the lever within a criterion response interval (900 ms) after presentation of the Gabor stimulus to score a hit and receive a juice reinforcement. The Gabor stimuli, which consisted of carrier gratings presented in sine phase at the center of the display and contrast was attenuated by a 2D Gaussian envelop with a 4-degree standard deviation (SD), were presented for durations of 500 ms, with equal probability between 250 and 6000 ms after the initial lever press. Contrast detection thresholds were measured as a function of spatial frequency from 0.25 to 16 c/deg in 0.5 octave steps using an adaptive decreasing contrast staircase procedure. Contrast sensitivity functions were generated from the geometric means of a minimum of 10 threshold measurements at each spatial frequency. The characteristics of the monkey's spatial vision were derived from functions fitted to the contrast sensitivity data via a nonlinear regression program that optimized the fit with 4 independent parameters, that is, peak spatial frequency, peak sensitivity, and the slopes of the high and low spatial frequency limbs of the function (Harwerth et al. 1980, 1990; Smith et al. 1999).
Amblyopia index (AI) values (Kiorpes et al. 1998; Wensveen et al. 2006) were calculated for each monkey by integrating the area between the contrast sensitivity functions for the operated and fellow eyes and dividing it by the area under the function for the operated eye. This index ranges from 0 (no deficit) to 1.0 (no measurable sensitivity in the operated eye). Interocular comparisons of the contrast sensitivity functions in individual monkeys are the most precise measure of deficits in experimental monkeys because the peak contrast sensitivity of normally reared monkeys and the fellow eyes of strabismic and anisometropic monkeys are known to vary substantially among individual monkeys (see examples in Kiorpes et al. 1998; Harwerth et al. 1980; Smith et al. 1985; Kiorpes and Movshon 2003; Wensveen et al. 2006). In experimental monkeys in which both eyes exhibit “qualitatively” lower peak contrast sensitivity (e.g., MK-292), we calculated AI based on both interocular difference and the difference in contrast sensitivity between the operated eye and normal control monkeys.
Neurophysiology
Preparation
The surgical preparation and the recording and stimulation methods have been described in detail elsewhere (Maruko et al. 2008). Briefly, monkeys were anesthetized initially with an intramuscular injection of ketamine hydrochloride (15–20 mg/kg) and acepromazine maleate (0.15–0.2 mg/kg). The animals were paralyzed by an iv infusion of vercuronium bromide (a loading dose of 0.1–0.2 mg/kg followed by a continuous infusion of 0.1–0.2 mg/kg/h) and artificially respired with a mixture of 59% N2O, 39% O2, and 2% CO2. Anesthesia was maintained by the continuous infusion of a mixture of Sufentanyl citrate (0.05 μg/kg/h) and Propofol (4 mg/kg/h). The core body temperature was kept at 37.6 °C. Cycloplegia was produced by 1% atropine sulfate, and the animals' corneas were protected with rigid, gas-permeable, extended-wear contact lenses. Retinoscopy was used to determine the contact lens parameters required to focus the eyes on the stimulus screen. The use of anesthesia and paralysis was necessary to ensure that quantitative analyses of monocular and binocular responses could be obtained from a large number of units for each monkey. In addition, anesthesia and paralysis minimize the potential confounding effects of unsteady fixation and/or nystagmus that are often present in the affected eyes of monkeys and humans with strabismic amblyopia (e.g., Zhang et al. 2008).
Recording and Visual stimulation
A typical penetration was made at an angle of approximately 30 degrees along the lunate sulcus within the region representing the central 6 degrees. We studied the total of 376 V1 and 399 V2 neurons from 9 amblyopic monkeys and 139 V1 and 183 V2 neurons in 3 normal control monkeys. The great majority of the sampled cells had their receptive fields within 3 degrees from the center of the projected fovea. More specifically, 66% of V1 and V2 units from the amblyopic monkeys had their receptive fields within 3 degrees of the projected fovea compared with 62% in normal control monkeys. Between 3 and 6 degrees, we found the receptive fields of 25% of the units from the amblyopic monkeys and 32% of the units from normal monkeys. Only 9% of the units in the amblyopic monkeys and 6% in normal monkeys had their receptive fields beyond 6 degrees. The locations of receptive fields of V2 neurons were very similar to those for V1. Each penetration began posterior to the lunate sulcus (V1). We evenly sampled through V1 at approximately 50-μm steps for a distance of 2.0–2.5 mm until the electrode entered the white matter. Electrode advancement continued through a gap of several hundred microns until the tip reached layer 6 of V2. The electrode then traversed all layers of V2 until it came out of the surface of V2.
Tungsten-in-glass microelectrodes were used to record single-unit activity or multiunit activity from which responses from single cortical neurons were isolated by using spike-sorting software. Recorded and amplified action potentials from a single cell at each site were digitized at 25 KHz and stored to disk on a computer running Tucker-Davis Technologies data acquisition components on our Visual Experiment Recording and Stimulation workstation. Drifting gratings were displayed on a monochrome monitor with ultra-short persistence (frame rate = 140 Hz; 800 × 600 pixels, screen size = 20° × 15° at 114 cm, or 40° × 30° at 57 cm, and mean luminance = 50 cd/m2), and neuronal responses were sampled at a rate of 140 Hz (7.14 ms bin widths) and compiled into peristimulus time histograms (PSTHs) that were equal in duration to, and synchronized with, the temporal cycle of the grating. For sine-wave gratings, the amplitude and phase of the temporal response components in the PSTHs were determined by Fourier analysis. In all experiments, the stimuli (sine-wave gratings, 40% contrast unless specified otherwise) were presented multiple times in a randomly ordered sequence for typically 1.6 s. One or 2 blank stimuli (i.e., zero contrast control) were included in each repeat of the re-randomized sequence to provide a measure of a neuron's maintained firing rate.
Data Analysis
For each isolated neuron, the receptive fields for both eyes were mapped on the tangent screen and its ocular dominance was initially determined using handheld stimuli. The mapped receptive fields were projected on the monitor screen by using a pair of gimbaled mirrors, and the responses of each neuron to drifting sine-wave gratings (TF = 3.0 Hz) were measured to characterize the monocular and binocular receptive-field properties. The typical size of the gratings was 4 degrees in diameter and therefore stimulated both the receptive-field (RF) center and surround of all V1 and V2 units. For the measurement of monocular properties for each eye, the stimuli were presented randomly to either the left or the right eye for a given presentation. The orientation tuning functions were obtained using the qualitatively determined optimal spatial frequency for each cell. This was followed by acquisition of the spatial frequency tuning functions at the cell's preferred orientation and the preferred direction of drift. Following the determination of the monocular properties, the neuron's binocular interaction properties were measured with a pair of dichoptic gratings using the cell's optimal monocular parameters.
Orientation Tuning
The optimal orientation and orientation bandwidth for each receptive field were determined by fitting the orientation tuning functions with wrapped Gaussian functions (Swindale 1998):
where θ = orientation, m1 = response amplitude, m2 = preferred orientation, and m3 = SD of the Gaussian function.
Orientation Bias
Orientation bias was calculated by using the vector summation methods (Levick and Thibos 1982; Smith et al. 1990). Briefly, the response of a given cell to a given orientation is expressed as the following complex number:
The response amplitude for a grating of orientation θ is described by a vector with a length of r at an angle coordinate of 2θ, where j is the square root of −1. The orientation bias is expressed as the mean response vector for a series of equally spaced stimulus orientations: Rmean = ΣR/N, where N = number of orientations. The mean response vector was then normalized with respect to the average amplitude of the vectors for all orientations, that is, Σr/N. A normalized phasor for all stimulus orientations was computed by the following formula:
where ΣR is the vector sum for all 12 orientations and Σr is the scalar sum of the amplitudes of all the response vectors. The normalized phasor b represents orientation bias, which varied between 0 (no orientation bias) and 1.0 (responsive to only one orientation). The term 2θp signifies the angular coordinates of the resultant vector and the angle θp is the preferred stimulus orientation of the unit. It is important to emphasize that the above normalization procedure minimizes the sensitivity of the measure to the responsiveness of the cell (Thibos and Levick 1985).
Spatial Frequency Tuning
To determine each cell's optimal spatial frequency and spatial resolution, the spatial frequency response data were fitted with Gaussian functions (DeAngelis et al. 1993):
where m0 = spatial frequency, m1 = response amplitude, m2 = optimal spatial frequency, and m3 = SD of the Gaussian function. The spatial resolution of each unit was determined by locating the highest spatial frequency that evoked responses significantly higher than the average spontaneous firing of the unit (i.e., >2 SDs).
Ocular Dominance
The “ocular dominance index” (ODI) of a neuron was quantitatively determined from the spatial frequency tuning functions using the following formula (Chino et al. 1997; Smith et al. 1997): ODI = (Rl – noise)/(Rr – noise) + (Rl – noise), where Rl is the peak response amplitude for left eye stimulation, Rr is the peak response amplitude for right eye stimulation, and “noise” is the spontaneous maintained activity. ODI values range from 0.0 (right eye response alone) to 1.0 (left eye response alone) with 0.5 indicating perfect binocular balance. An ocular imbalance index (OII) was quantified for all units using the formula OII = 2 × |ODI − 0.5| (DeAngelis and Newsome 1999). The OII value ranges from 0.0 (no imbalance) to 1.0 (complete monocular dominance) and shows the difference in relative strength of the 2 eyes in driving a unit. Since the OII value does not indicate which eye is dominant, each unit was assigned according to ODI value to be dominated by the amblyopic (right in normal monkeys) eye (ODI < 0.5) or the fellow (left) eye group (ODI ≥ 0.5). Then all OII values of units dominated by each eye were summed. The relative ratio (log2) of the summed OII value for units dominated by the nonamblyopic eye over that dominated by the amblyopic eye was defined as the relative ocular dominance index (ROII).
Binocular Interactions
To determine the strength and the nature of binocular interactions, responses were collected for dichoptic sine-wave gratings of the optimal spatial frequency, orientation and direction of drift as a function of the relative interocular spatial phase disparity of the grating pair. The sensitivity to relative interocular spatial phase disparities was quantified using a “binocular interaction index” that was calculated from the sine function fit to the binocular phase tuning data (BII = amplitude of the fitted sine wave/the average binocular response amplitude) (Ohzawa and Freeman 1986; Smith et al. 1997). To characterize whether binocular signal interactions were facilitatory or suppressive in nature, the “peak binocular response amplitude/dominant monocular response amplitude” ratios (Peak B/M) were calculated for each unit and expressed in terms of relative strength (db), that is, 10 log Peak B/M. Negative peak B/M values signify binocular suppression, and positive values indicate binocular facilitation.
Histology
At the end of each penetration, small electrolytic lesions (5 μA, 5 s, electrode negative) were made at 3 points along the track for later reconstruction. Experiments were terminated by administering an overdose of sodium pentobarbital (100 mg/kg) and the animals were euthanized by perfusion through the heart with an aldehyde fixative. Frozen sections were stained for Nissl substance and cytochrome oxidase (CO). The sections were used to identify the recording site for each unit in order to determine laminar variations of responses and to confirm that we recorded from comparable sites in different animals. The examination of electrode tracks indicated that our sampling in each animal was even and very similar for all monkeys.
Results
Physiological Optics, Onset Age, and Amblyopia
Contrast Sensitivity Functions
All 9 strabismic monkeys exhibited amblyopia. The spatial contrast sensitivity functions of these experimental monkeys and 3 normal monkeys are illustrated in Figure 1. The depth of amblyopia (AI) is shown for each monkey in the upper right corner. The contrast sensitivity loss in the affected eye varied considerably between the experimental monkeys and was apparent either for all spatial frequencies (e.g., MK-294) or for only mid- to high spatial frequencies (e.g., MK-287). Except for one monkey (MK-292) where the peak contrast sensitivity was only 25 for the fellow nonoperated eye, the contrast sensitivity of the fellow eyes in all other experimental monkeys was within the known range for normal monkeys (e.g., Harwerth et al. 1980; Smith et al. 1985; Kiorpes et al. 1998; Kiorpes and Movshon 2003; Wensveen et al. 2006). For MK-292, we calculated its AI by comparing the spatial contrast sensitivity functions between the 2 eyes (AI = 0.42) and also between the more severely affected eye and the average contrast sensitivity function for the 3 normal monkeys (dotted lines, AI = 0.86).
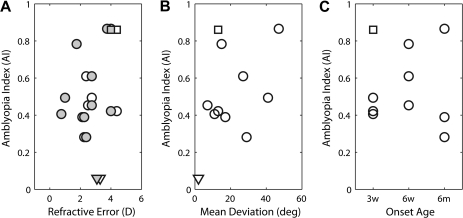
The large variation in the type and the depth of amblyopia among our experimental monkeys parallels that commonly observed in human strabismic amblyopes (e.g., McKee et al. 2003). To better understand the origin of the broad range of perceptual deficits in our experimental monkeys, we first analyzed the 3 factors that might have strongly influenced the severity of amblyopia, specifically refractive errors, the size of ocular deviation, and the onset age of strabismus during early infancy (Fig. 2).
Figure 2.
(A) Effects of refractive errors of individual monkeys during early development (measured at 90 days of age) on the depth of amblyopia (AI). Open circles show data for the operated eyes and filled circles the fellow eyes. Triangles show comparable data for age-matched normal infant monkeys. (B) Relationships between the mean ocular deviation and the depth of amblyopia (AI) for individual strabismic monkeys. (C) Effects of the onset age of strabismus on the depth of amblyopia. The square symbols in all panels indicate an additional data point for MK-292 (bilateral amblyope) when comparisons were made between the function for the operated eye and the average function of the 3 normal monkeys. Triangles show the data points for normal monkeys.
Refractive Errors
Abnormally high refractive errors (e.g., extreme hyperopia in both eyes) or substantial interocular differences in refractive power (anisometropia) during early infancy could become a major contributing factor of amblyopia. None of our experimental monkeys exhibited anisometropia or abnormal refractive errors during their early development (Fig. 2A). Also, the refractive errors of all experimental adult monkeys were within the range of refractive errors for normal adult monkeys (Bradley et al. 1999). Not surprisingly, there was no correlation between the refractive error of individual monkeys during the early development (e.g., at 90 days of age) and the depth of their amblyopia (Fig. 2A).
Ocular Deviations
The transected or detached lateral rectus muscles in many surgical models of esotropia are known to grow back and attach to the globe at various points of development, restoring relatively normal alignment in fully mature monkeys. However, during the postnatal 9 months (the critical period for binocular vision in macaque monkeys) (Harwerth et al. 1986; Horton et al. 1997), the experimental monkeys in this study exhibited a broad range of convergent misalignments (esotropia) (Fig. 2B). The majority (5/9) of infant monkeys had the average deviations of 20 degrees or less, but 2 monkeys showed very large deviations. Although strabismic monkeys with larger average deviations tended to exhibit more severe amblyopia, there was no consistent relationship between the size of the average ocular deviation and the AI of individual monkeys.
Onset Age
Differences in the onset age of experimental strabismus could systematically affect the severity of amblyopia. Two out of 3 monkeys operated at 6 weeks of age showed relatively severe amblyopia (Fig. 2C). As mentioned earlier, one monkey (MK-292) in the 3-week–onset group showed severe reductions in contrast sensitivity for both eyes (Fig. 1 and square in Fig. 2). Two “late-onset” monkeys (6 months) exhibited limited reductions in contrast sensitivity (AI = 0.39 and 0.28) while one monkey (MK-293) showed the most severe amblyopia (AI = 0.87). Together, the onset age of strabismus did not have consistent effects on the depth of amblyopia
Receptive-Field Properties
To reveal a potential link between developmentally altered cortical neurophysiology and amblyopia, the sample size of neurons needs to be fairly large. In the subsequent cell population analyses, therefore, all units from 9 experimental monkeys (376 V1 neurons and 399 V2 neurons) were divided into 2 subgroups, namely the units from the amblyopic monkeys that showed “severe” amblyopia (AI ≥ 0.5) and the units from the monkeys that had “mild” amblyopia (AI < 0.5). AI of 0.5 was chosen for this analysis because this is the mid-point in the normalized scale of the AI values (0.0–1.0), and also there was a clear break in the distribution of individual AI values beyond this point.
Ocular Dominance Imbalance
The most common explanation for the neural basis of amblyopia is a large ocular dominance shift in V1 away from the affected eye (Kiorpes and Movshon 2003; Chino et al. 2004; Hensch 2005; Anderson and Swettenham 2006; Daw 2006; Kiorpes 2006; Levi 2006). In a previous study with nonhuman primates, the amblyopic eyes of strabismic monkeys were reported to drive V1 units as effectively as do the fellow eyes although “binocular” units were lost, that is, the ocular dominance distribution of V1 neurons was relatively well balanced between the 2 eyes (e.g., Kiorpes et al. 1998). In this study, we wanted to know whether our amblyopic monkeys show a similar binocularly balanced ocular dominance distribution in V2.
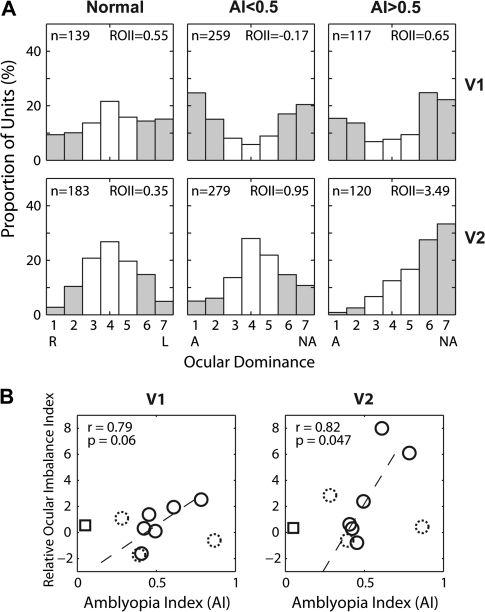
Ocular dominance was assigned for each unit by calculating its quantitatively determined ODI, which was then placed into 1 of the 7 evenly spaced bins that match the traditional 7 categories of ocular dominance (OD) (Hubel and Wiesel 1962). There was a substantial loss of binocularly balanced units (OD = 3–5) in V1 of all experimental monkeys compared with normal monkeys (Fig. 3A). However, regardless of the severity of amblyopia, both the operated (OD = 1–2) and fellow (OD = 6–7) eyes had similar proportions of units strongly dominated by either eye (chi-square tests on OD = 1–2 vs. OD = 6–7 between normal, mildly amblyopic, and severely amblyopic monkeys, P > 0.1).
Figure 3.
(A) Ocular dominance distribution of V1 (top) and V2 neurons (bottom) for normal monkeys (left), monkeys with mild amblyopia (AI < 0.5) (middle), and monkeys with severe amblyopia (AI > 0.5) (right). ROII, relative ocular dominance imbalance (see the text for details). A, amblyopic eye; NA, fellow “nonamblyopic” eye; R, right eye; L, left eye. Open histograms show the prevalence of “binocularly balanced cells” and filled histograms show binocularly imbalanced/monocular cells. AI values and ROII values are also illustrated in each panel. (B) ROII of individual monkeys as a function of their AI. Dotted open circles show data from the “late-onset” (6 months) group and square symbols indicate data from normal monkeys.
In V2, to our surprise, a relatively normal proportion of binocularly balanced units (OD = 3–5) was encountered for the mildly amblyopic monkeys. One possible explanation for this is that the binocular connections in V2 of normal adult monkeys are far more extensive than in V1 (Fig. 3A, left column), and hence, the binocular connections in mildly amblyopic monkeys appear to have been better preserved in V2 than in V1.
The most important result in V2 was that contrary to units in V1, the OD distribution of V2 neurons for the “severely amblyopic” monkeys (AI ≥ 0.5) exhibited a large shift away from their amblyopic eye (Fig. 3A, bottom right). This shift of OD in the severely amblyopic monkeys was statistically significant (chi-square test on OD = 1–2 vs. OD = 6–7 between normal and severely amblyopic monkeys, P = 2.4 × 10⁻⁸). The similar but smaller shift in mildly amblyopic monkeys was not significant (chi-square test on OD = 1–2 vs. OD = 6–7 between normal and mildly amblyopic monkeys, P = 0.214). However, the difference between mild and severely amblyopic monkeys was significant (chi-square test, P = 1.5 × 10⁻⁴). Interestingly, the OD shifts away from the amblyopic monkeys were significantly larger in V2 than in V1 for both mildly and severely amblyopic monkeys (chi-square test, P = 6.5 × 10⁻⁴ for mildly amblyopic and P = 7.2 × 10⁻⁶, respectively). Note that for the above multiple comparisons involving 9 neuronal groups, the P value of individual comparisons must be smaller than 0.008 to keep the overall significance at P < 0.05.
To examine the relationship between the abnormal OD shifts and the depth of amblyopia, the ROII was calculated for each monkey. The ROII value signifies the relative ability of the fellow nonoperated eyes in comparison to their operated eyes to drive V1 or V2 neurons. Thus, the larger an ROII value, the greater the ocular dominance shift away from the affected eye. Figure 3B plots an ROII value of each monkey as a function of its AI. Both in V1 and V2, there were modest correlations between ocular dominance imbalance and the depth of amblyopia. Because of the modest sample size for a given subject (n = 40–50 units in each area) and the small number of data points for the correlation analysis, it is difficult to establish a significant relationship between physiology and behavior. Nevertheless, it is worthwhile to note that the “outliers” come from the experimental monkeys with late-onset strabismus (6 months of age; dotted circles) and that monkeys with early-onset esotropia (3 and 6 weeks of age) showed a relatively consistent relationship especially in V2 (r = 0.82, P = 0.047). The apparent lack of a meaningful relationship for the late-onset group is not surprising considering that the ocular dominance plasticity in macaque V1, assessed with CO activity measures, is dramatically reduced by 3 months of age (Horton and Hocking 1997).
The ROII value calculated for each treatment group was 0.55 for V1 and 0.35 for V2 in normal monkeys. For the mildly amblyopic monkeys (A < 0.5), the ROII values were 0.17 for V1 and 0.95 for V2, whereas for the more severely amblyopic monkeys (AI ≥ 0.5), the ROII values were 0.65 and 3.49 for V1 and V2, respectively (Fig. 3A). Taken together, our results on the ocular dominance distribution of V1 and V2 neurons suggest that the reduced contrast sensitivity in the affected eye of severely amblyopic monkeys was closely associated with the impoverished functional connections beyond V1 for the affected eye.
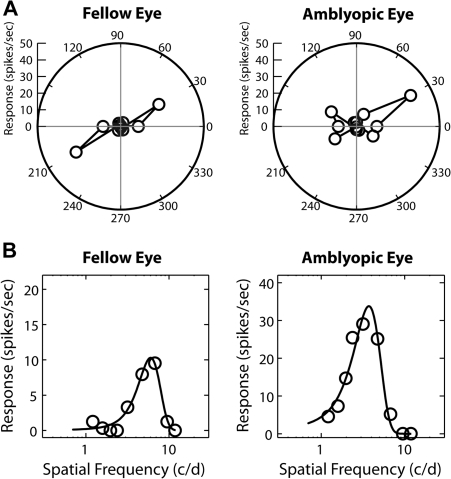
To determine whether the monocular spatial RF properties of cortical neurons in amblyopic monkeys are developmentally altered, we measured the orientation selectivity and the spatial frequency tuning of individual neurons by presenting stimuli for the right or left eye in a random sequence (Fig. 4). The V2 neuron from a severely amblyopic monkey showed substantial interocular differences characterized by the broader orientation tuning (4A) and the lower optimal spatial frequency and spatial resolution for stimulation of the amblyopic eye (4B). For the subsequent cell population analysis, we compared the distribution of spatial properties between units with ocular dominance 1 through 5 for the amblyopic eye and units with ocular dominance 3 through 7 for the fellow eye. We employed a 3-factor analysis of variance (ANOVA) to test significance of differences between the eyes, the depth of amblyopia and cortical areas.
Figure 4.
Examples of orientation tuning functions (A) and spatial frequency tuning functions (B) of a V2 neuron from a severely amblyopic monkey. Orientation bandwidth (half-width at half height) was 10.9 degree for the fellow eye and 24.5 degree for the amblyopic eye while orientation bias was 0.76 for the fellow eye and 0.46 for the affected eye. The optimal spatial frequency was 6.0 c/d for the fellow eye and 3.7 c/d for the amblyopic eye while spatial resolution for the fellow eye was 14.6 c/d and 10.2 c/d for the affected eye.
Spatial Frequency Tuning
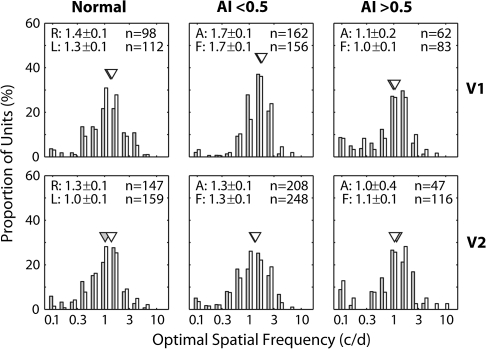
The poor acuity of amblyopic subjects is thought to result at least in part from reductions in the optimal spatial frequency and/or spatial resolution of V1 neurons dominated by the amblyopic eye (e.g., Movshon et al. 1987; Kiorpes et al. 1998; Kiorpes and McKee 1999; Kiorpes and Movshon 2003). Figure 5 shows that there were no significant interocular differences in the optimal spatial frequency for either V1 or V2 units regardless of the severity of amblyopia (P > 0.1). Also the mean optimal spatial frequencies of V1 or V2 neurons in our mildly or severely amblyopic monkeys were not significantly different from that for normal control monkeys (P > 0.1). Our result in V1 is consistent with a previous report (Kiorpes et al. 1998).
Figure 5.
Histograms illustrating the distribution of the optimal spatial frequencies of V1 (top) and V2 neurons (bottom) for normal monkeys (left), monkeys with mild amblyopia (AI < 0.5) (middle), and monkeys with severe amblyopia (AI > 0.5) (right). Open histograms show the data for the amblyopic eye and filled histograms illustrate the distributions for the fellow eye. Triangles show geometric means. Mean (±standard error) for the affected eye (A) and the fellow eye (F) is shown on top.
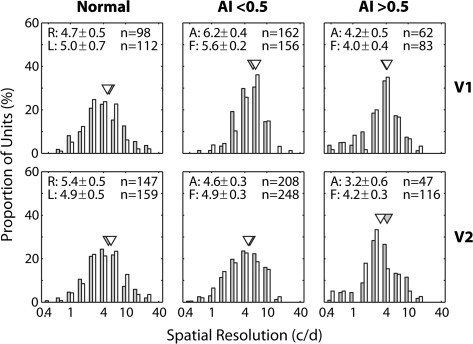
The results on the spatial resolution of V2 neurons substantially differed from those for V1 (Fig. 6). In V1, the mean spatial resolutions for the affected eyes of either mildly or severely amblyopic monkeys were not significantly different from those for the fellow eyes (P = 0.19 and P = 0.78, respectively). However, in severely amblyopic monkeys, the mean spatial resolutions of V2 neurons for the affected eyes were significantly lower than for the fellow eyes (P = 0.04) or for the affected eye of mildly amblyopic monkeys (P = 0.002) or for the right eye of normal monkeys (P = 0.001). We did not find any interocular difference for the spatial resolutions of V2 in the mildly amblyopic monkeys (P = 0.19). However, V2 neurons in response to stimulation of the affected eyes in these monkeys showed slightly but significantly lower resolutions than units from normal monkeys (P = 0.038).
Figure 6.
Histograms illustrating the distribution of the spatial resolutions of V1 (top) and V2 neurons (bottom) for normal monkeys (left), monkeys with mild amblyopia (AI < 0.5) (middle), and monkeys with severe amblyopia (AI > 0.5) (right). Open histograms show the data for the amblyopic eye and filled histograms illustrate the distributions for the fellow eye. Triangles show geometric means. Mean (±standard error) for the affected eye (A) and the fellow eye (F) is shown on top.
Orientation Selectivity
Most previous studies on the neural basis of amblyopia have not examined the effects of early strabismus on the orientation tuning of V1 neurons or have found no changes in V1 orientation tuning associated with amblyopia (e.g., Kiorpes et al. 1998; Sakai et al. 2006). There has been no report on the orientation tuning of extrastriate neurons in amblyopic monkeys. One of the more effective methods to determine whether or not the RF structures of V2 neurons are disrupted in amblyopic monkeys is to measure the unit's sensitivity to stimulus orientation using a vector summation method (e.g., orientation bias or circular variance). The orientation bias measure is largely insensitive to the responsiveness of the unit (Thibos and Levick 1982, 1985). Also unlike measures of tuning bandwidths around a unit's preferred orientation, the measures of orientation bias or circular variance take responses to all orientations into consideration (Thibos and Levick 1982, 1985; Ringach et al. 2002). In this study, therefore, we compared both the orientation bandwidth and orientation bias of individual neurons.
Bandwidth
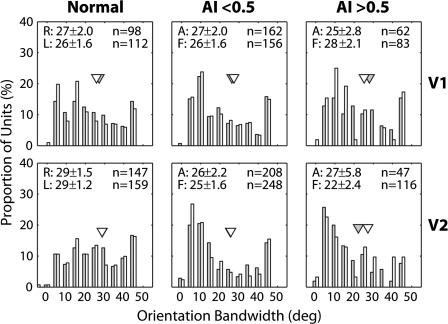
The mean orientation bandwidths of V1 neurons in response to stimulation of the amblyopic eyes were not significantly broader than for the fellow eyes (P > 0.1) (Fig. 7). For V2 neurons, we also found no significant interocular differences in the mean orientation bandwidths (P > 0.1).
Figure 7.
Histograms illustrating the distribution of orientation bandwidths of V1 (top) and V2 neurons (bottom) for normal monkeys (left), monkeys with mild amblyopia (AI < 0.5) (middle), and monkeys with severe amblyopia (AI > 0.5) (right). Open histograms show the data for the amblyopic eye and filled histograms illustrate the distributions for the fellow eye. Triangles show geometric means. Mean (±standard error) for the affected eye (A) and the fellow eye (F) is shown on top.
Bias
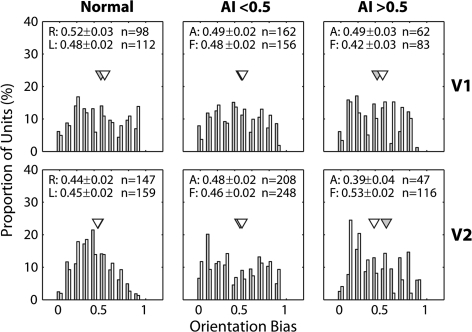
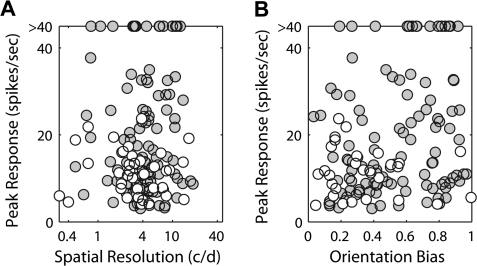
An important result emerged when we analyzed orientation bias (Fig. 8). The mean orientation bias of V2, but not V1 (P > 0.1), neurons in response to stimulation of the affected eye of severely amblyopic monkeys was significantly lower than that of units driven by their fellow eyes (P = 0.013). Other smaller interocular differences were not significant in V1 or V2 (P > 0.1). It should be noted that although V2 neurons from the severely amblyopic monkeys had generally lower peak firing rates to stimulation of the affected eye (open circles) than the fellow eye (filled circles), neither the spatial resolution nor the orientation bias of these units was influenced by their peak firing rates (r = 0.04 and 0.24, respectively, in Fig. 9).
Figure 8.
Histograms illustrating the distribution of orientation biases of V1 (top) and V2 neurons (bottom) for normal monkeys (left), monkeys with mild amblyopia (AI < 0.5) (middle), and monkeys with severe amblyopia (AI > 0.5) (right). Open histograms show the data for the amblyopic eye and filled histograms illustrate the distributions for the fellow eye. Triangles show geometric means values. Mean (±standard error) for the affected eye (A) and the fellow eye (F) is shown on top.
Figure 9.
Relationships between the peak firing rates and the spatial resolutions (A) and the orientation biases (B) of individual V2 units from severely amblyopic monkeys. Open circles indicate the tuning for the affected eyes and filled circles show the tuning for the fellow eyes.
Binocular Signal Interactions
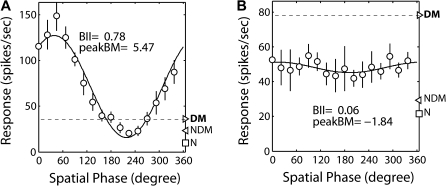
Strabismic amblyopia is thought to be closely associated with abnormal binocular interactions in V1 during early infancy (Chino et al. 1994; Sengpiel and Blakemore 1996; Smith et al. 1997; Horton et al. 1999; Kiorpes, 2006; Levi 2006; Sengpiel et al. 2006). However, none of the previous neurophysiological studies has directly investigated this presumed relationship in nonhuman primates. To reveal a possible link between abnormal changes in the binocular interactions of cortical neurons and amblyopia, we measured the strength of excitatory binocular interactions (binocular interaction index or BII) and the strength of binocular suppression (peak binocular response/dominant monocular response) of individual V1 and V2 neurons and compared the results with the AI of each subject. Figure 10 illustrates typical interocular spatial phase tuning functions of a V2 neuron in a normal (A) and in an amblyopic monkey (B). Unlike in the normal unit where binocular responses showed robust tuning for interocular spatial phase disparity (BII = 0.78) and strong binocular facilitation (Peak B/M = 5.47 db), the binocular responses in the neuron from an amblyopic monkey were not sensitive to phase disparity (BII = 0.06) and all binocular responses were nearly one half of the dominant monocular response regardless of spatial phase disparity (Peak B/M = −1.84 db), thus, exhibiting a severe loss of disparity sensitivity and strong binocular suppression. For the subsequent cell population analyses, we used 2-factor ANOVA to test significance between the animal groups (i.e., the degree of amblyopia) and between V1 and V2.
Figure 10.
(A) An example of a spatial phase disparity tuning function of a V2 neuron from a normal monkey exhibiting facilitatory binocular interactions (Peak B/M = 5.47 db) and high sensitivity to spatial phase disparity (BII = 0.78). (B) An example of a spatial phase disparity tuning function of a V2 neuron from an amblyopic monkey exhibiting a robust binocular suppression (Peak B/M = -1.84 db) and no disparity sensitivity (BII = 0.06). DM, monocular response for the dominant eye; NDM, monocular response for the nondominant eye; N, spontaneous activity.
Binocular Facilitation and Disparity Sensitivity
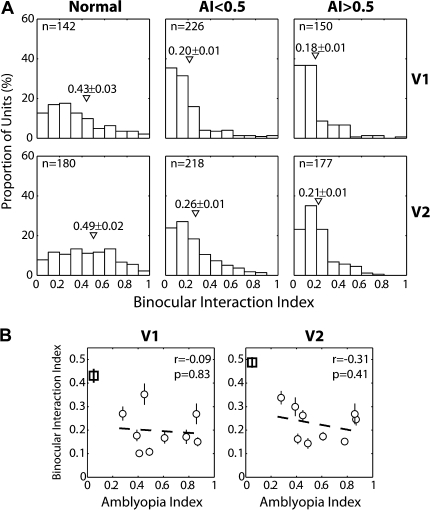
During the height of the critical period, experiencing optical strabismus for only 7–14 days is known to disrupt the excitatory binocular interactions in monkey V1, for example, a severe loss of overall BII values (Kumagami et al. 2000; Mori et al. 2002; Zhang et al. 2005c). Here we asked whether the reductions in the BII values of V1 and/or V2 of our experimental monkeys are related to the depths of their behavioral amblyopia. The mean BII of 226 V1 units from the mildly amblyopic monkeys and 150 V1 units from the severely amblyopic monkeys were significantly lower than that of 142 V1 units from the normal monkeys (P = 0.0001) (Fig. 11A, top). We found comparable reductions in the mean BII of V2 neurons for the mildly amblyopic monkeys (n = 218) and the severely amblyopic monkeys (n = 177) (P = 0.0001) (Fig. 11A, bottom). However, the mean BII of V1 neurons in severely amblyopic monkeys was not significantly different from that of the mildly amblyopic monkeys (P = 0.37), whereas the small difference in V2 was significant (P = 0.04).
Figure 11.
(A) Histograms illustrating the distribution of binocular interaction index (BII) values for V1 (top) and V2 (bottom) neurons in normal (left), mildly amblyopic (middle) and severely amblyopic monkeys (right). (B) Relationships between the average BIIs of V1 (left) and V2 (right) neurons for individual monkeys and the depth of their amblyopia (AI). Square symbols indicate the mean BII of normal monkeys.
Figure 11B plots the mean BII of individual monkeys as a function of the depth of their amblyopia (AI). We found little correlations between physiology (BII) and behavior (AI). Thus, the disruption of the cortical circuitry underlying the unit's disparity sensitivity does not adequately explain the anomalous cortical processing that leads to the development of amblyopia.
Binocular Suppression
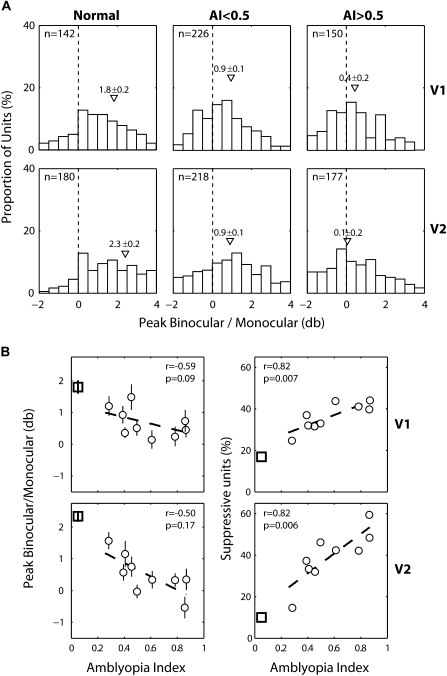
In normal monkeys, the majority of neurons both in V1 and V2 showed robust excitatory binocular interactions, expressed as the average peak binocular response over the monocular dominant eye response (Fig. 10), and a small percentage of neurons showed suppressive binocular interactions (i.e., Peak B/M < 0 db) (Fig. 12A). For our experimental monkeys, binocular suppression was robust both in V1 and V2 and the mean Peak B/M values in both mildly and severely amblyopic monkeys were significantly lower than that in normal monkeys (P = 0.0001) (Fig. 12A). Moreover, the average Peak B/M value of V1 and V2 neurons for the severely amblyopic monkeys were significantly lower than the mildly amblyopic monkeys (P = 0.0197 for V1, P = 0.001 for V2).
Figure 12.
(A) Distribution histograms of peak binocular/Monocular response ratios (db) for V1 (top) and V2 (bottom) neurons in normal (left), mildly amblyopic (middle), and severely amblyopic monkeys (right). Bars on the left side of the dashed line represent binocularly suppressive units (Peak B/M < 0.0 db). Mean values (±standard error) are shown with triangles. (B) Relationships between the average Peak B/M of V1 (top) and V2 (bottom) neurons in individual monkeys and the depth of their amblyopia (AI) (left columns). Relationships between the proportion of binocularly suppressive V1 (top) and V2 (bottom) neurons of individual monkeys and the depth of their amblyopia (AI) (right columns).
The mean Peak B/M value in each animal appeared to be negatively correlated with the depth of their amblyopia in V1 and V2 but neither of these correlations was significant (Fig. 12B, left). When the relationship between the percentage of binocularly suppressive units (Peak B/M < 0 db) in individual subjects and the severity of their amblyopia (AI) was analyzed, there were strong positive correlation between the percentage of binocularly suppressive units in each animal and the depth of amblyopia in both V1 (r = 0.82, P = 0.01) (Fig. 12B) and in V2 (r = 0.82, P = 0.006) (Fig. 12B, right). Together, the prevalence of binocularly suppressive V1 and V2 neurons was closely associated with the depth of amblyopia in individual monkeys.
Discussion
Two new and important results emerged in this study. First, the behavioral loss of visual sensitivity in our amblyopic monkeys was closely associated with a reduction in the functional connections beyond V1 and the anomalous alteration of the circuitry supporting orientation and spatial frequency tuning of V2, but not V1, neurons. Second, the prevalence of binocular suppression in both V1 and V2 neurons of individual monkeys was correlated with the depth of their behavioral amblyopia.
Ocular Dominance Imbalance and Amblyopia
In V1, there was no ocular dominance shift away from the behaviorally amblyopic eye. A similar observation was made in a previous study (Kiorpes et al. 1998). A new and more significant finding of this study was that there was a robust ocular dominance shift in V2 favoring the nonamblyopic eye of the severely amblyopic monkeys. The contrasting results on the ocular dominance imbalance in V1 versus V2 suggest that early surgical strabismus had the greatest impact not on the development of V1 circuitry but on the development of the functional connections beyond V1. Together, “undersampling” by neurons in V2 (and downstream), but not in V1, might have substantially limited the visual performance of these amblyopic monkeys.
Disruption of V2 Spatial RF Organization, Binocular Suppression, and Amblyopia
The spatial filter properties (spatial frequency and orientation selectivity) of V2 neurons in severely amblyopic monkeys were subnormal for the affected eyes of severely amblyopic monkeys. These relatively mild but significant deficits were likely to have resulted from the high prevalence of binocular suppression. In the previous studies of V1 neurons from prism-reared monkeys (optically simulated strabismus), we consistently found that their V1 neurophysiology was dominated by binocular suppression that emerged as early as 3 days after the onset of prism rearing (Zhang et al. 2005b) and that the suppression remained robust throughout the life of strabismic monkeys (Smith et al. 1997; Kumagami et al. 2000; Endo et al. 2000; Mori et al. 2002; Zhang et al. 2003; Zhang et al. 2005b; Sakai et al. 2006). A consequence of robust binocular suppression in V1 is that the output signals from V1 of strabismic infants under binocular (i.e., natural) viewing conditions are likely to exhibit considerable irregularities for the stimulation of the affected eye. Impoverished signals from V1 combined with the altered fixation pattern (e.g., dominant fixation with the non-deviating eye) might have disrupted the functional maturation of converging V1 input connections within the receptive field of a given V2 neuron (e.g., V1-like “subfields” within the receptive field) (e.g., Nishimoto et al. 2006; Anzai et al. 2007; Willmore et al. 2010). As a result, the RF structure of V2 neurons might have been compromised. Our methods to reveal binocular suppression could not allow us to determine which eye was being suppressed by the dichoptic stimulation. However, the metabolic mapping study of suppression scotoma of V1 in strabismic monkeys showed that the deviating eyes were being suppressed by the nondeviating fellow eyes during the early development (Horton et al. 1999).
The spatial frequency tuning functions of V1 neurons driven by the deviating eye of our amblyopic monkeys were essentially normal. These results in V1 differ from the previous studies where there were significant correlations between the physiological (V1) and behavioral loss for the affected eyes of severely amblyopic monkeys (Movshon et al. 1987; Kiorpes et al. 1998; Kiorpes and Movshon 2003). The overall distribution of the optimal spatial frequency and the spatial resolution of V1 units for the fellow eye in this study were very similar to those reported by the above referenced studies, suggesting that a sampling bias was not a factor for the apparent differences (e.g., the location of RFs relative to the central fovea). One possible explanation for the apparent difference in V1 might be a methodological one; the criteria used to determine the spatial resolution of individual units were quite different between the 2 studies (Kiorpes et al. 1998).
Increased Neuronal Deficits in V2 Relative to V1
Many of the neuronal deficits revealed in this study were unique to V2 or more extensive in V2 than in V1. Ocular dominance imbalance was far greater in V2 while it was negligible in V1 and the ocular dominance imbalance of V2 was more reliably associated with the depth of amblyopia (Fig. 3). The loss of spatial resolution and the orientation bias in the affected eye were unique to V2 (Figs 6 and 7). These results support the emerging view on the visual system development in nonhuman primates that at a given age, V2 is more plastic than V1 and that the functional development of the visual brain appears to proceed in a hierarchical order (Barone et al. 1995; Distler et al. 1996; Batardiere et al. 2002; Zhang et al. 2005b; Zheng et al. 2007). Also cortical plasticity is likely to be more robust in higher order visual areas until later in development. The present study gives more direct evidence for the largely undocumented idea that amblyopia may be best explained as a “cascade” of cortical deficits over several processing stages that begin at V1 (Kiorpes et al. 1998; Kiorpes and Movshon 2003; Chino et al. 2004; Muckli et al. 2006; El-Shamayleh et al. 2010). For example, the abnormal alterations in V2 neurophysiology reflect not only the direct effect of early strabismus on V2 development (e.g., ocular dominance imbalance in V2, but not in V1) but also the consequence of abnormal V1 cortical physiology (e.g., robust binocular suppression in V1) on V2 development (e.g., the monocular spatial filter deficits of V2 neurons). Moreover, this interesting idea could also explain a neural basis of amblyopia in our mildly amblyopic monkeys. The small ocular dominance imbalance in V2 of these experimental monkeys (Fig. 3), which was not statistically significant, could be amplified downstream and become a significant factor. We therefore conclude that although this study demonstrated several key deficits in V2 that could limit the fine spatial vision of amblyopic primates, these neuronal deficits in V2 are likely to be amplified downstream.
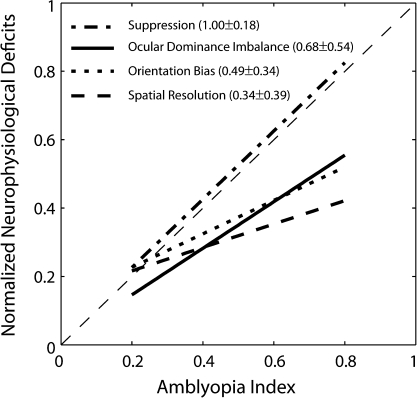
In this study, we have presented substantial evidence for the association between anomalous V2 neurophysiology and behavioral amblyopia. Our study does not allow us to directly establish a causal link between neurophysiological deficits in V2 and the observed amblyopia. However, it is possible to infer from our data which of the altered V2 neurophysiology (ocular dominance imbalance, lower spatial resolutions, reduced orientation biases, and/or binocular suppression) might have had a stronger impact in limiting the visual performance of our amblyopic monkeys. Comparisons of the normalized regression lines relating the 4 major cortical deficits in V2 with the depth of amblyopia (Fig. 13) show that the function relating binocular suppression and amblyopia had a slope of 1.0 and relatively small deviations (standard error of the mean) of individual data, suggesting that this association is exceedingly strong. The slopes of the functions relating the ocular dominance imbalance, the orientation bias reduction, the spatial resolution loss, and amblyopia are shallower with relatively larger deviations of individual data, and these functions are located below the diagonal, indicating that each of these neural deficits alone might have had less consistent impact in limiting visual performance. Finally, the present results on the high prevalence of binocular suppression in V1 and its impact on the V2 neurophysiology, the abnormal spatial RF organization and undersampling should provide a unique insight into the neural mechanisms underlying more complex vision deficiencies in strabismic amblyopes such as crowding and position uncertainty (Levi 2006, 2007, 2008).
Figure 13.
Comparisons of the relative magnitude of V2 deficits with the depth of amblyopia (AI). The proportions of binocularly suppressive unit, the ocular dominance imbalance (ROII), the average spatial resolution, and the average orientation bias of V2 neurons in individual monkeys were first normalized to the respective maximum value and then were fit to obtain a regression line for each V2 deficit. The slope (±standard error of the mean) is given for each function.
Funding
National Institute of Health Research Grants (R01-EY008128 to Y.M.C., R01-EY003611 to E.L.S., R01-EY001139 to R.S.H., and Core Grant P30 EY-07751).
Acknowledgments
Conflict of Interest: None declared.
References
- Anderson SJ, Swettenham JB. Neuroimaging in human amblyopia. Strabismus. 2006;14:21–35. doi: 10.1080/09273970500538082. [DOI] [PubMed] [Google Scholar]
- Anzai A, Peng X, Van Essen DC. Neurons in monkey visual area V2 encode combinations of orientations. Nat Neurosci. 2007;10:1313–1321. doi: 10.1038/nn1975. [DOI] [PubMed] [Google Scholar]
- Barone P, Dehay C, Berland M, Bullier J, Kennedy H. Developmental remodeling of primate visual cortical pathways. Cereb Cortex. 1995;5:22–38. doi: 10.1093/cercor/5.1.22. [DOI] [PubMed] [Google Scholar]
- Batardiere A, Barone P, Knoblauch K, Giroud P, Berland M, Dumas AM, Kennedy H. Early specification of the hierarchical organization of visual cortical areas in the macaque monkey. Cereb Cortex. 2002;12:453–465. doi: 10.1093/cercor/12.5.453. [DOI] [PubMed] [Google Scholar]
- Bradley DV, Fernandes A, Lynn M, Tigges M, Boothe RG. Emmetropization in the rhesus monkey (Macaca mulatta): birth to young adulthood. Invest Ophthalmol Vis Sci. 1999;40:214–229. [PubMed] [Google Scholar]
- Chandna A, Pennefather PM, Kovacs I, Norcia AM. Contour integration deficits in anisometropic amblyopia. Invest Ophthalmol Vis Sci. 2001;42:875–878. [PubMed] [Google Scholar]
- Chino YM, Bi H, Zhang B. The postnatal development of the neuronal response properties in primate visual cortex. In: Kaas J, Collins C, editors. 2004. Boca Raton (FL): Primate Vision p. 81–108. [Google Scholar]
- Chino YM, Cheng H, Smith EL, III, Garraghty PE, Roe AW, Sur M. Early discordant binocular vision disrupts signal transfer in the lateral geniculate nucleus. Proc Natl Acad Sci U S A. 1994;91:6938–6942. doi: 10.1073/pnas.91.15.6938. [DOI] [PMC free article] [PubMed] [Google Scholar]
- Chino YM, Smith EL, III, Hatta S, Cheng H. Postnatal development of binocular disparity sensitivity in neurons of the primate visual cortex. J Neurosci. 1997;17:296–307. doi: 10.1523/JNEUROSCI.17-01-00296.1997. [DOI] [PMC free article] [PubMed] [Google Scholar]
- Crawford ML, Harwerth RS. Ocular dominance column width and contrast sensitivity in monkeys reared with strabismus or anisometropia. Invest Ophthalmol Vis Sci. 2004;45:3036–3042. doi: 10.1167/iovs.04-0029. [DOI] [PubMed] [Google Scholar]
- Das VE, Fu LN, Mustari MJ, Tusa RJ. Incomitance in monkeys with strabismus. Strabismus. 2005;13:33–41. doi: 10.1080/09273970590910298. [DOI] [PMC free article] [PubMed] [Google Scholar]
- Das VE, Mustari MJ. Correlation of cross-axis eye movements and motoneuron activity in non-human primates with “A” pattern strabismus. Invest Ophthalmol Vis Sci. 2007;48:665–674. doi: 10.1167/iovs.06-0249. [DOI] [PMC free article] [PubMed] [Google Scholar]
- Daw NW. Visual development. 3rd ed. New York: Springer; 2006. [Google Scholar]
- DeAngelis GC, Newsome WT. Organization of disparity-selective neurons in macaque area MT. J Neurosci. 1999;19:1398–1415. doi: 10.1523/JNEUROSCI.19-04-01398.1999. [DOI] [PMC free article] [PubMed] [Google Scholar]
- DeAngelis GC, Ohzawa I, Freeman RD. Spatiotemporal organization of simple-cell receptive fields in the cat's striate cortex. I. General characteristics and postnatal development. J Neurophysiol. 1993;69:1091–1117. doi: 10.1152/jn.1993.69.4.1091. [DOI] [PubMed] [Google Scholar]
- Dillenburger B, Roe AW. Influence of parallel and orthogonal real lines on illusory contour perception. J Neurophysiol. 2010;103:55–64. doi: 10.1152/jn.00001.2009. [DOI] [PMC free article] [PubMed] [Google Scholar]
- Distler C, Bachevalier J, Kennedy C, Mishkin M, Ungerleider LG. Functional development of the corticocortical pathway for motion analysis in the macaque monkey: a 14C-2-deoxyglucose study. Cereb Cortex. 1996;6:184–195. doi: 10.1093/cercor/6.2.184. [DOI] [PubMed] [Google Scholar]
- El-Shamayleh Y, Kiorpes L, Kohn A, Movshon JA. Visual motion processing by neurons in area MT of macaque monkeys with experimental amblyopia. J Neurosci. 2010;30:12198–12209. doi: 10.1523/JNEUROSCI.3055-10.2010. [DOI] [PMC free article] [PubMed] [Google Scholar]
- Endo M, Kaas JH, Jain N, Smith EL, III, Chino Y. Binocular cross-orientation suppression in the primary visual cortex (V1) of infant rhesus monkeys. Invest Ophthalmol Vis Sci. 2000;41:4022–4031. [PubMed] [Google Scholar]
- Harwerth RS, Boltz RL, Smith EL., III Psychophysical evidence for sustained and transient channels in the monkey visual system. Vision Res. 1980;20:15–22. doi: 10.1016/0042-6989(80)90137-6. [DOI] [PubMed] [Google Scholar]
- Harwerth RS, Smith EL, III, Crawford ML, von Noorden GK. Behavioral studies of the sensitive periods of development of visual functions in monkeys. Behav Brain Res. 1990;41:179–198. doi: 10.1016/0166-4328(90)90107-p. [DOI] [PubMed] [Google Scholar]
- Harwerth RS, Smith EL, III, Duncan GC, Crawford ML, von Noorden GK. Multiple sensitive periods in the development of the primate visual system. Science. 1986;232:235–238. doi: 10.1126/science.3952507. [DOI] [PubMed] [Google Scholar]
- Hegde J, Van Essen DC. Selectivity for complex shapes in primate visual area V2. J Neurosci. 2000;20:rC61. doi: 10.1523/JNEUROSCI.20-05-j0001.2000. [DOI] [PMC free article] [PubMed] [Google Scholar]
- Hensch TK. Critical period plasticity in local cortical circuits. Nat Rev Neurosci. 2005;6:877–888. doi: 10.1038/nrn1787. [DOI] [PubMed] [Google Scholar]
- Hess RF, Howell ER. The threshold contrast sensitivity function in strabismic amblyopia: evidence for a two type classification. Vision Res. 1977;17:1049–1055. doi: 10.1016/0042-6989(77)90009-8. [DOI] [PubMed] [Google Scholar]
- Hess RF, Wang YZ, Demanins R, Wilkinson F, Wilson HR. A deficit in strabismic amblyopia for global shape detection. Vision Res. 1999;39:901–914. doi: 10.1016/s0042-6989(98)00157-6. [DOI] [PubMed] [Google Scholar]
- Horton JC, Hocking DR. 1997. [Google Scholar]
- Horton JC, Hocking DR, Adams DL. Metabolic mapping of suppression scotomas in striate cortex of macaques with experimental strabismus. J Neurosci. 1999;19:7111–7129. doi: 10.1523/JNEUROSCI.19-16-07111.1999. [DOI] [PMC free article] [PubMed] [Google Scholar]
- Horton JC, Hocking DR, Kiorpes L. Pattern of ocular dominance columns and cytochrome oxidase activity in a macaque monkey with naturally occurring anisometropic amblyopia. Vis Neurosci. 1997;14:681–689. doi: 10.1017/s0952523800012645. [DOI] [PubMed] [Google Scholar]
- Hubel DH, Wiesel TN. Receptive fields, binocular interaction and functional architecture in the cat's visual cortex. J Physiol. 1962;160:106–154. doi: 10.1113/jphysiol.1962.sp006837. [DOI] [PMC free article] [PubMed] [Google Scholar]
- Hung LF, Crawford ML, Smith EL. Spectacle lenses alter eye growth and the refractive status of young monkeys. Nat Med. 1995;1:761–765. doi: 10.1038/nm0895-761. [DOI] [PubMed] [Google Scholar]
- Ito M, Komatsu H. Representation of angles embedded within contour stimuli in area V2 of macaque monkeys. J Neurosci. 2004;24:3313–3324. doi: 10.1523/JNEUROSCI.4364-03.2004. [DOI] [PMC free article] [PubMed] [Google Scholar]
- Kiorpes L. Visual processing in amblyopia: animal studies. Strabismus. 2006;14:3–10. doi: 10.1080/09273970500536193. [DOI] [PubMed] [Google Scholar]
- Kiorpes L, Kiper DC, O'Keefe LP, Cavanaugh JR, Movshon JA. Neuronal correlates of amblyopia in the visual cortex of macaque monkeys with experimental strabismus and anisometropia. J Neurosci. 1998;18:6411–6424. doi: 10.1523/JNEUROSCI.18-16-06411.1998. [DOI] [PMC free article] [PubMed] [Google Scholar]
- Kiorpes L, McKee SP. Neural mechanisms underlying amblyopia. Curr Opin Neurobiol. 1999;9:480–486. doi: 10.1016/s0959-4388(99)80072-5. [DOI] [PubMed] [Google Scholar]
- Kiorpes L, Movshon JA. Neural limitations on visual development in primates. In: Chalupa LM, Werner JS, editors. The visual neurosciences. 2003. MIT Press. Cambridge, MA. USA. 159–173. [Google Scholar]
- Kovacs I, Kozma P, Feher A, Benedek G. Late maturation of visual spatial integration in humans. Proc Natl Acad Sci U S A. 1999;96:12204–12209. doi: 10.1073/pnas.96.21.12204. [DOI] [PMC free article] [PubMed] [Google Scholar]
- Kozma P, Kiorpes L. Contour integration in amblyopic monkeys. Vis Neurosci. 2003;20:577–588. doi: 10.1017/s0952523803205113. [DOI] [PubMed] [Google Scholar]
- Kumagami T, Zhang B, Smith EL, III, Chino YM. Effect of onset age of strabismus on the binocular responses of neurons in the monkey visual cortex. Invest Ophthalmol Vis Sci. 2000;41:948–954. [PubMed] [Google Scholar]
- Levi DM. Visual processing in amblyopia: human studies. Strabismus. 2006;14:11–19. doi: 10.1080/09273970500536243. [DOI] [PubMed] [Google Scholar]
- Levi DM. Image segregation in strabismic amblyopia. Vision Res. 2007;47:1833–1838. doi: 10.1016/j.visres.2007.03.005. [DOI] [PMC free article] [PubMed] [Google Scholar]
- Levi DM. Crowding—an essential bottleneck for object recognition: a mini-review. Vision Res. 2008;48:635–654. doi: 10.1016/j.visres.2007.12.009. [DOI] [PMC free article] [PubMed] [Google Scholar]
- Levi M, Harwerth RS. Spatio-temporal interactions in anisometropic and strabismic amblyopia. Invest Ophthalmol Vis Sci. 1977;16:90–95. [PubMed] [Google Scholar]
- Levick WR, Thibos LN. Analysis of orientation bias in cat retina. J Physiol. 1982;329:243–261. doi: 10.1113/jphysiol.1982.sp014301. [DOI] [PMC free article] [PubMed] [Google Scholar]
- Maruko I, Zhang B, Tao X, Tong J, Smith EL, III, Chino YM. Postnatal development of disparity sensitivity in visual area 2 (v2)of macaque monkeys. J Neurophysiol. 2008;100:2486–2495. doi: 10.1152/jn.90397.2008. [DOI] [PMC free article] [PubMed] [Google Scholar]
- McKee SP, Levi DM, Movshon JA. The pattern of visual deficits in amblyopia. J Vis. 2003;3:380–405. doi: 10.1167/3.5.5. [DOI] [PubMed] [Google Scholar]
- Mori T, Matsuura K, Zhang B, Smith EL, III, Chino YM. Effects of the duration of early strabismus on the binocular responses of neurons in the monkey visual cortex (V1) Invest Ophthalmol Vis Sci. 2002;43:1262–1269. [PubMed] [Google Scholar]
- Movshon JA, Eggers HM, Gizzi MS, Hendrickson AE, Kiorpes L, Boothe RG. Effects of early unilateral blur on the macaque's visual system. III. Physiological observations. J Neurosci. 1987;7:1340–1351. doi: 10.1523/JNEUROSCI.07-05-01340.1987. [DOI] [PMC free article] [PubMed] [Google Scholar]
- Muckli L, Kiess S, Tonhausen N, Singer W, Goebel R, Sireteanu R. Cerebral correlates of impaired grating perception in individual, psychophysically assessed human amblyopes. Vision Res. 2006;46:506–526. doi: 10.1016/j.visres.2005.10.014. [DOI] [PubMed] [Google Scholar]
- Nishimoto S, Ishida T, Ohzawa I. Receptive field properties of neurons in the early visual cortex revealed by local spectral reverse correlation. J Neurosci. 2006;26:3269–3280. doi: 10.1523/JNEUROSCI.4558-05.2006. [DOI] [PMC free article] [PubMed] [Google Scholar]
- Norcia AM, Pei F, Bonneh Y, Hou C, Sampath V, Pettet MW. Development of sensitivity to texture and contour information in the human infant. J Cogn Neurosci. 2005;17:569–579. doi: 10.1162/0898929053467596. [DOI] [PubMed] [Google Scholar]
- Ohzawa I, Freeman RD. The binocular organization of simple cells in the cat's visual cortex. J Neurophysiol. 1986;56:221–242. doi: 10.1152/jn.1986.56.1.221. [DOI] [PubMed] [Google Scholar]
- Qiao, Grinder Y. Refractive development and ocular structural correlates in infant rhesus monkeys. 2009 Thesis 610 2009.Q52. Online Computer Library Center (OCLC) control No. 441297960 University of Houston. [Google Scholar]
- Quick MW, Boothe RG. Measurement of binocular alignment in normal monkeys and in monkeys with strabismus. Invest Ophthalmol Vis Sci. 1989;30:1159–1168. [PubMed] [Google Scholar]
- Ringach DL, Shapley RM, Hawken MJ. Orientation selectivity in macaque V1: diversity and laminar dependence. J Neurosci. 2002;22:5639–5651. doi: 10.1523/JNEUROSCI.22-13-05639.2002. [DOI] [PMC free article] [PubMed] [Google Scholar]
- Sakai E, Bi H, Maruko I, Zhang B, Zheng J, Wensveen J, Harwerth RS, Smith EL, III, Chino YM. Cortical effects of brief daily periods of unrestricted vision during early monocular form deprivation. J Neurophysiol. 2006;95:2856–2865. doi: 10.1152/jn.01265.2005. [DOI] [PubMed] [Google Scholar]
- Schaeffel F, Farkas L, Howland HC. Infrared photoretinoscopy. Appl Optics. 1987;26:1505–1509. doi: 10.1364/AO.26.001505. [DOI] [PubMed] [Google Scholar]
- Sengpiel F, Blakemore C. The neural basis of suppression and amblyopia in strabismus. Eye. 1996;10(Pt 2):250–258. doi: 10.1038/eye.1996.54. [DOI] [PubMed] [Google Scholar]
- Sengpiel F, Jirmann KU, Vorobyov V, Eysel UT. Strabismic suppression is mediated by inhibitory interactions in the primary visual cortex. Cereb Cortex. 2006;16:1750–1758. doi: 10.1093/cercor/bhj110. [DOI] [PubMed] [Google Scholar]
- Sincich LC, Horton JC. Divided by cytochrome oxidase: a map of the projections from V1 to V2 in macaques. Science. 2002;295:1734–1737. doi: 10.1126/science.1067902. [DOI] [PubMed] [Google Scholar]
- Sincich LC, Horton JC. Independent projection streams from macaque striate cortex to the second visual area and middle temporal area. J Neurosci. 2003;23:5684–5692. doi: 10.1523/JNEUROSCI.23-13-05684.2003. [DOI] [PMC free article] [PubMed] [Google Scholar]
- Sincich LC, Jocson CM, Horton JC. V1 interpatch projections to v2 thick stripes and pale stripes. J Neurosci. 2010;30:6963–6974. doi: 10.1523/JNEUROSCI.5506-09.2010. [DOI] [PMC free article] [PubMed] [Google Scholar]
- Smith EL, III, Bradley DV, Fernandes A, Boothe RG. Form deprivation myopia in adolescent monkeys. Optom Vis Sci. 1999;76:428–432. doi: 10.1097/00006324-199906000-00023. [DOI] [PubMed] [Google Scholar]
- Smith EL, III, Chino YM, Ni J, Ridder WH, III, Crawford ML. Binocular spatial phase tuning characteristics of neurons in the macaque striate cortex. J Neurophysiol. 1997;78:351–365. doi: 10.1152/jn.1997.78.1.351. [DOI] [PubMed] [Google Scholar]
- Smith EL, III, Chino YM, Ridder WH, III, Kitagawa K, Langston A. Orientation bias of neurons in the lateral geniculate nucleus of macaque monkeys. Vis Neurosci. 1990;5:525–545. doi: 10.1017/s0952523800000699. [DOI] [PubMed] [Google Scholar]
- Smith EL, III, Harwerth RS, Crawford ML. Spatial contrast sensitivity deficits in monkeys produced by optically induced anisometropia. Invest Ophthalmol Vis Sci. 1985;26:330–342. [PubMed] [Google Scholar]
- Swindale NV. Orientation tuning curves: empirical description and estimation of parameters. Biol Cybern. 1998;78:45–56. doi: 10.1007/s004220050411. [DOI] [PubMed] [Google Scholar]
- Thibos LN, Levick WR. Astigmatic visual and deprivation in cat: behavioral, optical and retinophysiological consequences. Vision Res. 1982;22:43–53. doi: 10.1016/0042-6989(82)90165-1. [DOI] [PubMed] [Google Scholar]
- Thibos LN, Levick WR. Orientation bias of brisk-transient y-cells of the cat retina for drifting and alternating gratings. Exp Brain Res. 1985;58:1–10. doi: 10.1007/BF00238948. [DOI] [PubMed] [Google Scholar]
- Van Essen DC, Newsome WT, Maunsell JH, Bixby JL. The projections from striate cortex (V1) to areas V2 and V3 in the macaque monkey: asymmetries, areal boundaries, and patchy connections. J Comp Neurol. 1986;244:451–480. doi: 10.1002/cne.902440405. [DOI] [PubMed] [Google Scholar]
- Wensveen JM, Harwerth RS, Hung LF, Ramamirtham R, Kee CS, Smith EL., III Brief daily periods of unrestricted vision can prevent form-deprivation amblyopia. Invest Ophthalmol Vis Sci. 2006;47:2468–2477. doi: 10.1167/iovs.05-0885. [DOI] [PMC free article] [PubMed] [Google Scholar]
- Willmore BD, Prenger RJ, Gallant JL. Neural representation of natural images in visual area V2. J Neurosci. 2010;30:2102–2114. doi: 10.1523/JNEUROSCI.4099-09.2010. [DOI] [PMC free article] [PubMed] [Google Scholar]
- Zhang B, Matsuura K, Mori T, Wensveen JM, Harwerth RS, Smith EL, III, Chino Y. Binocular deficits associated with early alternating monocular defocus. II. Neurophysiological observations. J Neurophysiol. 2003;90:3012–3023. doi: 10.1152/jn.00975.2002. [DOI] [PubMed] [Google Scholar]
- Zhang B, Stevenson SS, Cheng H, Laron M, Kumar G, Tong J, Chino YM. Effects of fixation instability on multifocal VEP (mfVEP) responses in amblyopes. J Vis. 2008;8(16):11–14. doi: 10.1167/8.3.16. [DOI] [PubMed] [Google Scholar]
- Zhang B, Watanabe I, Bi H, Zheng J, Maruko I, Smith Iii EL, Chino YM. Delayed maturation of receptive-field center and surround in macaque V2 neurons [Abstract] Journal of Vision. 2005a;5(8):431–431a. [Google Scholar]
- Zhang B, Zheng J, Watanabe I, Maruko I, Bi H, Smith EL, Chino Y. Delayed maturation of receptive field center/surround mechanisms in V2. Proc Natl Acad Sci U S A. 2005b;102:5862–5867. doi: 10.1073/pnas.0501815102. [DOI] [PMC free article] [PubMed] [Google Scholar]
- Zhang B, Bi H, Sakai E, Maruko I, Zheng J, Smith EL, III, Chino YM. Rapid plasticity of binocular connections in developing monkey visual cortex (V1) Proc Natl Acad Sci U S A. 2005c;102:9026–9031. doi: 10.1073/pnas.0500280102. [DOI] [PMC free article] [PubMed] [Google Scholar]
- Zheng J, Zhang B, Bi H, Maruko I, Watanabe I, Nakatsuka C, Smith EL, Chino YM. Development of temporal response properties and contrast sensitivity of V1 and V2 neurons in macaque monkeys. J Neurophysiol. 2007;97:3905–3916. doi: 10.1152/jn.01320.2006. [DOI] [PubMed] [Google Scholar]


