

Abstract
The ATP-sensitive potassium (KATP) channel consisting of sulfonylurea receptor 1 (SUR1) and inward rectifier potassium channel 6.2 (Kir6.2) has a well-established role in insulin secretion. Mutations in either subunit can lead to disease due to aberrant channel gating, altered channel density at the cell surface or a combination of both. Endocytic trafficking of channels at the plasma membrane is one way to influence surface channel numbers. It has been previously reported that channel endocytosis is dependent on a tyrosine-based motif in Kir6.2 while SUR1 alone is unable to internalize. In this study, we followed endocytic trafficking of surface channels in real time by live cell imaging of channel subunits tagged with an extracellular minimal α-bungarotoxin binding peptide labeled with a fluorescent dye. We demonstrate that SUR1 undergoes endocytosis independent of Kir6.2. Moreover, mutations in the putative endocytosis motif of Kir6.2, Y330C, Y330A and F333I are unable to prevent channel endocytosis. These findings challenge the notion that Kir6.2 bears the sole endocytic signal for KATP channels and support a role of SUR1 in this trafficking process.
Keywords: KATP channel, endocytosis, bungarotoxin, imaging, SUR1, Kir6.2
Introduction
ATP-sensitive potassium (KATP) channels formed by sulfonylurea receptors (SURs) and inwardly rectifying potassium channels (Kir6.x) have an established role in coupling cellular ATP and ADP levels to membrane excitability to regulate physiological processes. In pancreatic β-cells KATP channels consisting of SUR1 and Kir6.2 regulate insulin secretion to maintain glucose homeostasis. Elevated blood glucose leads to increased ATP production and a higher intracellular [ATP/ADP] ratio which closes KATP channels, causing membrane depolarization, opening of voltage-gated calcium channels, calcium influx and insulin secretion. In contrast, low blood glucose causes KATP channel opening due to a decreased intracellular [ATP/ADP] ratio leaving the β-cell in a hyperpolarized resting state to prevent insulin release (1).
Defective channel function is linked to a number of human diseases including several forms of diabetes (2, 3). KATP channel function depends on channel gating properties and the number of channels expressed at the cell surface. Mutations in either subunit, Kir6.2 or SUR1, can affect KATP channel surface expression or gating properties to cause disease. Gain-of-function mutations are associated with permanent neonatal diabetes mellitus (4, 5). On the other hand, loss-of-function mutations underlie congenital hyperinsulinism (6-8). The number of KATP channels expressed at the cell surface is dependent on correct trafficking of channels from the endoplasmic reticulum (ER) to the plasma membrane. SUR1 and Kir6.2 each contain an RKR tripeptide ER retention signal preventing the subunits from exiting the ER when they are expressed independently. Only assembled channels can leave the ER because the octameric structural organization of the SUR1/Kir6.2 complex masks the ER retention signals (9, 10). In addition to regulation in the secretory pathway, the number of KATP channels in the plasma membrane can also be influenced by changes in internalization, recycling or degradation of surface channels. An increase of channel density at the plasma membrane is expected to increase the threshold of glucose concentrations necessary to depolarize β-cell membrane and stimulate insulin secretion. Conversely, a decrease of cell surface channel density renders membrane potential more easily depolarized at a given stimulatory glucose concentration (6, 11-13). Endocytosis of KATP channels has been suggested to be clathrin-mediated and solely dependent on Kir6.2. Initially, a dileucine motif in Kir6.2 was proposed to be responsible for KATP channel internalization in response to PKC stimulation in COS-7 cells and neurons (14). The role of the dileucine motif was later challenged by Mankouri et al. who reported that channel endocytosis is instead mediated by a tyrosine-based motif 330YSKF333 in the C-terminal cytoplasmic domain of Kir6.2. They further reported that a neonatal diabetes Kir6.2 mutation Y330C that reduces channel sensitivity to ATP inhibition also prevented channel endocytosis. As Y330C disrupts the tyrosine-based motif, it was concluded that the mutation causes neonatal diabetes in part by preventing channel endocytosis and increasing the resident lifetime of the ATP-insensitive mutant Kir6.2. In these studies, trafficking and distribution of KATP channels were assessed primarily with conventional approaches using antibody labeling of fixed cells or biochemical assays (15).
In the present study we used a small, high affinity α-bungarotoxin (BTX) binding peptide tag (BTX tag) (16) placed on the extracellular domain of SUR1 or Kir6.2 for tetramethyl rhodamine iso-thiocyanate (TRITC)-BTX labeling to monitor internalization of KATP channels in living cells. This new approach allowed us to visualize endocytosis of membrane bound KATP channels in real time. Live cell imaging of the Kir mutants Y330C and F333I co-expressed with SUR1 showed that these mutant channels do not prevent internalization as previously reported. We also show that SUR1 alone undergoes endocytosis when the ER-retention signal RKR is inactivated by mutation to AAA (SUR1RKR→AAA). Taken together these data suggest that the aforementioned Kir6.2 tyrosine motif is not solely responsible for KATP channel internalization and that the SUR1 protein contains signaling information that is sufficient for its own endocytosis and thus contributes to regulation of endocytosis of the channel complex.
Results
Monitoring endocytosis of KATP channels with live cell imaging
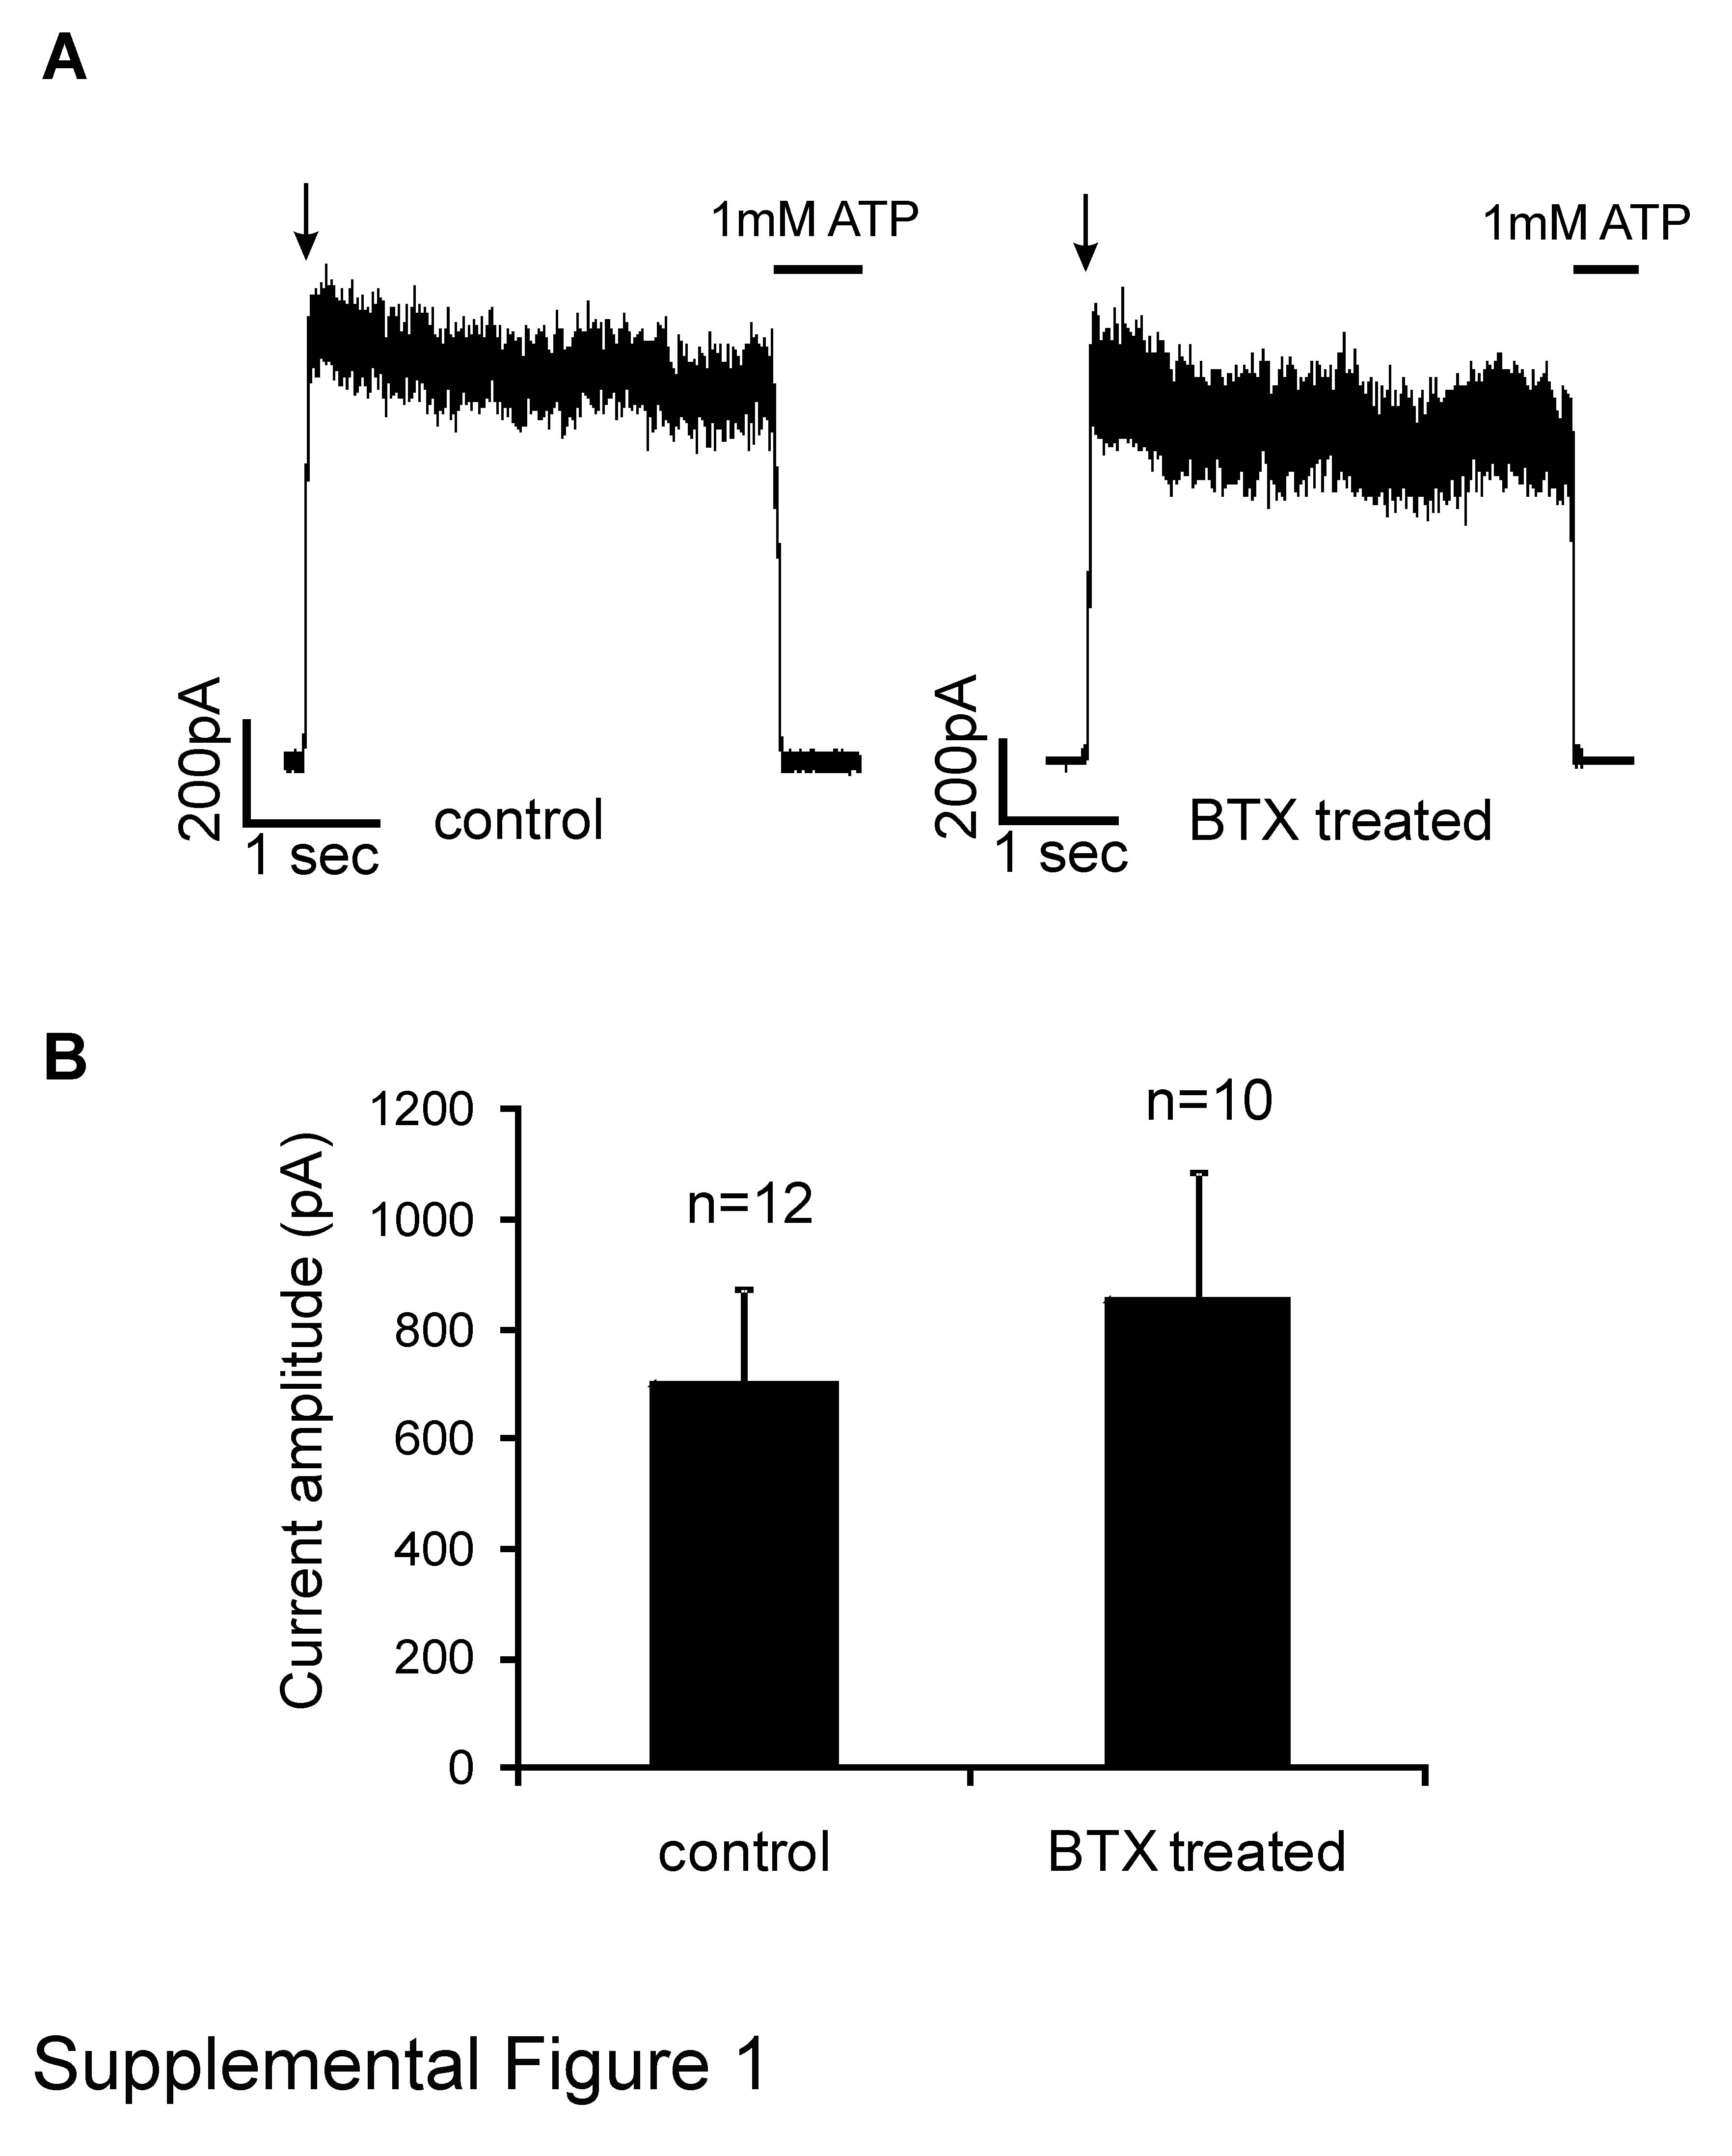
In previous internalization studies KATP channels were primarily monitored with either biochemical methods or antibody based imaging of fixed cells (17-20). While these methods provide snapshots of channel protein distribution during the time course of the study, they lack the power to visually follow internalization that live cell imaging methods offer. In order to follow internalization of KATP channels in living cells we tagged the N-terminus of SUR1 with a short peptide sequence (BTX tag-SUR1) that binds fluorophore-labeled BTX (TRITC-BTX) with high affinity (21). The N-terminus of SUR1 is located on the extracellular side of the plasma membrane allowing access of TRITC-BTX, which itself is membrane impermeable, to its targeting sequence without permeabilization of cells (16, 22). Co-expression of BTX tag-SUR1 with Kir6.2 generated channels with gating characteristics similar to untagged channels as assessed by inside-out patch clamp recording. Preincubation of cells expressing the channel with TRITC-BTX also had no effect on channel gating or channel density, indicating that ligand binding does not affect channel function or expression (Supplemental Figure 1).
For live cell imaging COSm6 cells transiently transfected with BTX tag-SUR1 and wild type (WT)-Kir6.2 were loaded onto the microscope stage at 37°C. TRITC-BTX was applied to the medium to label channels at the plasma membrane and image acquisition began immediately after focusing on the cells. This approach minimizes the time between ligand application and image acquisition such that channels expressed at the cell surface were captured before significant intracellular fluorescence due to endocytosis could develop. Cells transfected with BTX tag-SUR1 and WT-Kir6.2 showed fluorescent surface signal at the start of acquisition (Figure 1A, first panel). At later time points an increase in punctate intracellular fluorescent signal was detected. We followed trafficking of labeled channels from the plasma membrane over a 30min time period. Fluorescence intensity profiles were measured with a line scan algorithm as described in Materials and Methods. Fluorescent signals associated with the cell surface are depicted by two initial peaks in the line scan graph at acquisition start (Figure 1A, acquisition start). Internalized channels are detected as peaks distributing towards the middle of the graph over time (Figure 1A, panels 10-30min and Movie S1). Imaging of untransfected cells labeled with TRITC-BTX served as a control. In these cells no punctate fluorescence signal was observed (data not shown). Furthermore, we examined endocytosis using live cell imaging of channels formed by SUR1 and BTX tagged Kir6.2 (see Movie S3 in supplement). Internalization was similar when the BTX tag was fused to either SUR1 or Kir6.2, although the overall fluorescent signal was stronger when the tag was placed on the SUR1 subunit (compare Movie S1 and Movie S3). We therefore used BTX tag-SUR1 for all subsequent studies.
Figure 1. Live cell imaging of KATP channel endocytosis.

(A) Plasma membrane bound KATP channels are visible immediately after adding TRITC-BTX protein ligand dye in a COSm6 cell transiently transfected with BTX tag-SUR1 and WT Kir6.2 (picture acquisition start, scale bar 5 μm). Channels budding from the plasma membrane and migrating towards the cytosol are visible as bright fluorescent puncta (white arrowheads in 10-30min movie captures, white arrow and inset at 30min). At the start of acquisition only surface-bound channels are depicted as two peaks in the line scan graph (A, bottom part, x-axis at approximately 5 and 15 μm). Internalized channels are illustrated as peaks around 10 μm on the x-axis of the graph corresponding to the inside of the cell (red arrows). (B) Similar observations were made in INS-1 cells infected with adenoviral BTX tag-SUR1 and WT Kir6.2 (B, white arrowheads, arrow and inset, red arrows in graph). KATP channel endocytosis was visually followed over 30min and internalization was illustrated in the graphs below the movie snap shots (bottom part, corresponding movies in supplemental data).
Similar studies were carried out in INS-1 cells, which closely resemble pancreatic β-cells, to validate results obtained in the heterologous expression system. For these experiments INS-1 cells were infected with recombinant adenoviruses containing BTX tag-SUR1 and Kir6.2 cDNAs. Confocal microscopy showed surface labeled channels trafficked from the plasma membrane towards intracellular compartments over time (Figure 1B, Movie S2). These results confirmed the results obtained in COSm6 cells. For subsequent experiments analyzing mutant KATP channels, we used COSm6 cells as they provide a clean experimental platform devoid of endogenous KATP channels, which might compensate potential effects of mutant constructs.
Analysis of Kir6.2 mutations previously reported to impair KATP channel endocytosis
Earlier studies suggested that the neonatal diabetes Kir6.2 mutations Y330C and F333I impair internalization of KATP-channels by disrupting the tyrosine-based endocytosis motif 330YSKF333 (15). To see if similar observations could be made with live cell imaging, COSm6 cells were co-transfected with BTX tag-SUR1 and Kir6.2 harboring the F333I or Y330C mutation. Live cell imaging was performed as described above. Surprisingly, we observed internalization of both Kir6.2-Y330C and F333I mutant KATP channels (Figure 2A, Movie S4 and data not shown). Moreover, we observed significantly reduced fluorescence signal at the cell surface when the dye was added and acquisition was started indicating reduced surface channel expression. The decreased surface expression is opposite to what one would expect if the mutations prevent channel endocytosis and increase channel residence time in the plasma membrane. Quantitative analysis by line scan revealed an increase in fluorescent signal levels corresponding to an increased amount of intracellular fluorescent puncta over time (Figure 2A, graphs acquisition start to 30min).
Figure 2. Analysis of Kir6.2 mutants with disrupted 330YSKF333motif.

(A) The Kir6.2 mutant Y330C shows robust internalization when monitored by time-lapse imaging. Distribution of surface and internalized channels is displayed using line scan (compare screen shots, white arrowheads and inset, scale bar 5 μm, line scan below). (B) COSm6 cells labeled with TRITC-BTX at 4°C and chased for 30min at 37°C with media containing FITC-BSA. Cells expressing BTX tag-SUR1 and WT Kir6.2 or Y330C, Y330A or F333I mutant Kir6.2 displayed punctate TRITC-BTX labeled channels (left panel, red, scale bar 10 μm, images were contrast enhanced for better visualization due to low expression level of Kir mutants). Co-localization with the fluid phase marker FITC-BSA (middle panel, green) in cells labeled with both fluorophores confirms the intracellular nature of channels (see merged pictures and insets, right panel). Note not all cell membranes were brightly labeled with FITC-BSA especially membranes at the cell-cell contact sites likely because FITC-BSA could not access this space. Also, only cells transfected with the channel subunits were labeled with TRITC-BTX. (C) Analysis of protein expression in COSm6 cells transfected with FLAG- or BTX tag-SUR1 with WT or mutant Kir6.2. Western blot of Kir6.2 shows reduced protein levels for both Y330C and F333I mutant Kir6.2 compared to WT whether the co-expressed SUR1 is tagged with a FLAG-epitope or BTX tag. Western blot of SUR1 shows reduced complex glycosylated form (upper band) when it is co-expressed with mutant Kir6.2. (D) Quantitative chemiluminescence assay shows surface expression of mutant channels was reduced by approximately 50%. (E) Monitoring endocytosis by surface biotinylation. COSm6 cells expressing WT or mutant KATP channels were labeled at 4°C and chased at 37°C for 30min. Residual surface label was cleaved to allow for Western Blot detection of internalized channels only (stripped, 0min control and 30min, right). Unstripped samples served as control to account for the total amount of channels present at the 0min and 30min time points (unstripped, left). Internalization of WT and Y330C mutant channels was similar over a 30min time interval when normalized to the total amout of surface label present at 0min (compare 30min stripped samples to 0min unstripped samples). (F) Quantification of biotinylated WT and mutant KATP channels by densitometry (n=4). The percentage of surface channels internalized at 30min was not significantly different between WT SUR1/ KIR6.2 (31.8±4.7%) and SUR1/ Kir6.2-Y330C (36.6±8.7%).
In order to substantiate our finding we utilized a second, more conventional method. COSm6 cells co-expressing BTX tag-SUR1 and WT, F333I-, Y330C- or Y330A- Kir6.2 were labeled at 4°C with TRITC-BTX and chased at 37°C before fixation to assess endocytosis. The chase medium contained a fluid phase marker, fluorescein iso-thiocyanate (FITC)-bovine serum albumin (BSA). After 30min of incubation at 37°C a punctate BTX staining pattern was observed inside cells expressing WT or mutant channels (Figure 2B). Co-localization with the endocytic vesicle marker FITC-BSA confirmed that puncta were truly of intracellular nature.
The results described above are in opposition to previously published results by others. This prompted us to confirm our data with yet additional biochemical approaches. Our imaging experiments showed reduced surface staining of Y330C and F333I mutant channels, therefore we first compared their expression levels with WT channels using Western Blot and the chemiluminescence assay described in Materials and Methods. By Western Blot, the Y330C and F333I Kir6.2 mutants showed reduced steady-state protein levels compared to WT Kir6.2 co-expressed with either FLAG- or BTX tag-SUR1 (Figure 2C, middle blot). Moreover, there was a significant reduction in the mature, complex-glycosylated SUR1 upper band in cells co-expressing the mutant Kir6.2 compared to cells co-expressing WT Kir6.2 (Figure 2C, top blot) Blotting with tubulin served as loading control (Figure 2C, bottom blot). Reduced mature SUR1 band is indicative of a decrease in the abundance of channels that have trafficked past the medial Golgi where complex glycosylation of SUR1 occurs. Indeed, quantification of surface channels by chemiluminescence assays revealed ∼50% reduction in surface expression of SUR1/Kir6.2-F333I and Y330C mutants compared to WT channels (Figure 2D).
To monitor channel endocytosis biochemically we employed a surface biotinylation pulse-chase protocol as detailed in Materials and Methods (Figure 2E). Biotinylated WT and mutant channels were chased at 37°C to examine endocytosis (30min time point) or kept on ice (0min time point). To assay internalized channels only samples were treated with a membrane impermeable reducing agent to strip off residual surface biotin label (Figure 2E, stripped, far right). Samples not treated with the reducing agent served as controls to account for the total amount of signal present at 0min and 30min (Figure 2E, unstripped, left). Densitometry of the Western blots was performed to estimate the percent of the initial signal (0 time, unstripped) that was internalized after 30min of chase for WT and the Y330C mutant. We observed no significant difference between the two (WT: 31.8±4.7% and Y330C: 36.6±8.7%; Figure 2F). Taken together, the imaging and biochemical data led us to conclude that the integrity of the proposed 330YSKF333 endocytosis motif is not essential for KATP channel internalization.
SUR1 is involved in KATP channel internalization
Since the 330YSKF333 motif in Kir6.2 is not essential for channel endocytosis, we asked if the SUR1 subunit alone was capable of undergoing endocytosis. To address this question we inactivated the ER retention signal RKR by mutating it to AAA (SUR1RKR→AAA), which allows SUR1 to traffic to the cell surface in the absence of Kir6.2 (10). As expected, live cell imaging showed abundant surface expression of BTX tag-SUR1RKR→AAA at the start of acquisition in COSm6 transfected with the construct (Figure 3A). Interestingly, BTX tag-SUR1RKR→AAA alone showed internalization comparable to WT BTX tag-SUR1/Kir6.2 channels when imaged over a 30min interval. Movie screen shots at acquisition start and 10, 20 and 30min time points are shown in Figure 3A (internalized channels are indicated by white arrowheads, arrow and inset; compare also Movie S5 of a different cell in supplemental data). Pulse-chase experiments with the FITC-BSA fluid phase marker identified intracellular localization of the puncta validating our live cell imaging results (Figure 3B). Further analysis revealed that there was no statistically significant difference of the average number of internalized BTX-labeled puncta between the SUR1RKR→AAA and WT BTX tag-SUR1/Kir6.2 group. The average number of puncta colocalized with the fluid phase marker FITC-BSA was similar as well indicating that there was no difference in the number of intracellular puncta (Figure 3C; BTX-labeled: RKR=16.5±1.7 and WT =16±2.4; colocalized FITC-BSA: RKR=9.5±1.2 and WT=12.2 ±1.3, N=2, n>20 per condition).
Figure 3. SUR1RKR→AAA expressed alone undergoes endocytosis.

(A) Live cell imaging of COSm6 cells expressing BTX tag-SUR1RKR→AAA. BTX tag-SUR1RKR→AAA expresses at the plasma membrane independently of Kir6.2 (acquisition start capture, scale bar 5 μm). Time-lapse imaging shows an increased number of fluorescent puncta inside the cells over 30min representing endocytosed BTX tag-SUR1RKR→AAA (10-30min movie screen captures, white arrowheads and inset). Internalization was analyzed using line scan and is illustrated in the graphs below (for details refer to Materials and Methods). (B) COSm6 cells expressing WT channels (BTX tag-SUR1+Kir6.2; upper panel) or BTX tag-SUR1RKR→AAA (lower panel) were labeled with TRITC-BTX and chased with FITC-BSA present in the medium for 30 min. Co-localization of WT channels and SUR1RKR→AAA (red, scale bar 10 μm) with FITC-BSA (green) confirmed visualized channels were intracellular (merged pictures, far right, insets, scale bar 10 μm). (C) Quantitative analysis showed that the average number of internalized BTX-labeled puncta was similar between BTX tag-SUR1RKR→AAA and WT channels as well as the number of BTX-stained vesicles colocalized with the endocytic marker FITC-BSA (BTX-labeled, black bar: SUR1RKR→AAA =16.5±1.7 and WT =16±2.4; colocalized FITC-BSA, striped bar: SUR1RKR→AAA =9.5±1.2 and WT=12.2±1.3, N=2, n>20 per condition) indicating similar internalization behavior for BTX tag-SUR1RKR→AAA and WT channels.
Endocytosis of SUR1RKR→AAA was further examined by surface biotinylation pulse-chase experiments. The SUR1RKR→AAA protein manifests as both the core-glycosylated and complex-glycosylated forms just as WT SUR1; however, the complex-glycosylated SUR1RKR→AAA migrates slower on SDS-PAGE than complex-glycosylated WT SUR1, consistent with previous reports. Expression levels of WT SUR1/Kir6.2 and SUR1RKR→AAA were similar whether the constructs were fused to a FLAG- or BTX tag (Figure 4A). Supporting our results obtained from the imaging experiments, we observed internalization of SUR1RKR→AAA expressed alone with a time course similar to WT SUR1 co-expressed with Kir6.2 using chemiluminescence pulse-chase assays (Figure 4B) and in surface biotinylation pulse-chase experiments (Figure 4C). Internalization of surface biotinylated channels was observed upon 30min of chase for both WT and SUR1RKR→AAA (Figure 4C; compare stripped 0min and 30min). Densitometry measurements and normalization to the unstripped controls at 0min revealed that the percentage of endocytosed surface channels after 30min was comparable between WT and SUR1RKR→AAA (Figure 4D, WT: 39.7±4.8% and SUR1RKR→AAA: 39.9±12.9%). The similar time course of internalization was further observed in surface biotinylation experiments with smaller increment of chase time between 0min to 30min (Figure 4E). Note, in Western blots from surface biotinylation experiments only one band of SUR1RKR→AAA is detected representing the complex-glycosylated form that traffics to the cell surface (Figure 4C and 4E).
Figure 4. Biochemical analysis of SUR1RKR→AAA internalization.

(A) Western Blot of WT FLAG- or BTX tag-SUR1/ Kir6.2 and FLAG- or BTX-SUR1RKR→AAA expressed alone. Protein expression levels of WT and SUR1RKR→AAA are comparable whether SUR1 is fused with a FLAG-epitope or BTX tag. (B) Monitoring endocytosis of WT and SUR1RKR→AAA by quantitative chemiluminescence assays. Cells expressing WT fSUR1/ Kir6.2 or fSUR1RKR→AAA channels were labeled with anti-FLAG antibody at 4°C followed by a 30min chase at 37°C. FLAG-tagged channels remaining at the cell surface at 30min were detected by chemiluminescence assay and normalized to WT levels at 0min. Internalization was comparable for WT channels and SUR1RKR→AAA (% surface expression for WT: 100 at 0min and 29.0±5.0 at 30min; % surface expression for SUR1RKR→AAA: 132±10.5 at 0min and 35.6±6.9 at 30min; n=4). (C) Monitoring endocytosis of WT and SUR1RKR→AAA by surface biotinylation as described in Materials and Methods. Internalization of WT and SUR1RKR→AAA channels was similar over a 30min time interval when normalized to the total surface label present at 0min (compare 30min stripped samples to 0min unstripped samples). (D) Quantification of WT and SUR1RKR→AAA biotinylation signals by densitometry (n=4). The percentage of surface label internalized at 30min was not significantly different between WT channels (39.7±4.8%) and SUR1RKR→AAA (39.9±12.9%). (E) Time course of internalization assessed by surface biotinylation pulse-chase experiments (n=2). Similar kinetics of internalization was observed between WT channels and SUR1RKR→AAA.
The experiments described above were all carried out in COSm6 cells. We next tested if SUR1RKR→AAA endocytosis might be dependent on tissue origin as a previous study reported that SUR1RKR→AAA was unable to undergo endocytosis in the human tsA-201 cell line. TsA-201 cells expressing either WT BTX tag-SUR1/Kir6.2 or BTX tag- SUR1RKR→AAA were labeled at 4°C and chased for 30min with FITC-conjugated transferrin included in the media. Both WT SUR1/Kir6.2 and SUR1RKR→AAA displayed robust internalization in tsA-201 cells (Figure 5A, left, top: WT, bottom: SUR1RKR→AAA) co-localizing with transferrin (merged pictures and insets). Internalization levels were comparable to those observed in COSm6 cells which served as controls (Figure 5A, right). Quantitative analysis of transferrin co-localization revealed that the percentage of BTX-dye stained puncta also positive for staining with FITC-transferrin was not significantly different between WT SUR1/Kir6.2 and SUR1RKR→AAA or between tsA-201 and COSm6 cells (Figure 5B). These findings indicate that SUR1RKR→AAA endocytosis is independent of tissue or species origin (compare tsA-201 cells from human versus COSm6 cells from monkey origin). Moreover, SUR1RKR→AAA and WT SUR1/Kir6.2 channels follow the same route of endocytosis as suggested by co-localization with transferrin, a marker for recycling endosomes and clathrin-mediated endocytosis (CME). To further investigate SUR1RKR→AAA endocytosis we performed immunofluorescent staining with the early endosomal marker EEA1. BTX tag-SUR1RKR→AAA colocalized with EEA1 to the same degree as WT BTX tag-SUR1/Kir6.2 channels (Figure 5C) another indication that both are internalized via similar mechanisms.
Figure 5. SUR1RKR→AAA endocytosis occurs in cell types of different origin and follows the same route of internalization as WT KATP channels.

(A) WT channels (A, upper panel) and BTX tag-SUR1RKR →AAA (A, lower panel) show co-localization with FITC-transferrin, a marker for early endosomes and clathrin-mediated endocytosis, after a 30min chase in tsA-201 (A, left) and COSm6 cells (A, right) indicating that BTX tag-SUR1RKR→AAA endocytosis is not dependent on a cell type of specific origin (red: TRITC-BTX, green: FITC-transferrin, see merged pictures and insets for co-localization, scale bars 10μm). (B) Quantitative analysis of BTX tag-SUR1+Kir6.2 WT channels and BTX tag-SUR1RKR→AAA co-localized with transferrin in tsA-201 and COSm6 cells. Co-localization was measured using Metamorph (see methods for details). The percentage of TRITC-BTX stained channels co-localized with FITC-transferrin was not significantly different between WT (black bars) and SUR1RKR→AAA (grey bars) in tsA-201 (left; WT=14.6±2.1%, n=11 and SUR1RKR→AAA=14.7±1.2%, n=7) or COSm6 cells (right; WT=17.2±1.8%, n=7 and SUR1RKR→AAA=15.2±2.2%, n=9) indicating internalization of BTX tag-SUR1RKR→AAA follows a similar route of endocytosis as WT channels in both cell types. (C) Co-localization of endocytosed BTX tag-SUR1RKR→AAA or WT channels with the early endosome marker EEA1. Surface channels were labeled with TRITC-BTX (left panel, red, scale bar 10μm) at 4°C and allowed to undergo endocytosis at 37°C for 30min. Cells were then fixed and stained with anti-EEA1 antibody (middle panel, green). BTX tag-SUR1RKR→AAA displays co-localization with EEA1 comparable to BTX tag-SUR1+Kir6.2 WT (merged pictures, white arrows and insets).
SUR1RKR→AAA endocytosis is dynamin-dependent and clathrin-mediated
Previous studies have shown that wild type KATP channel endocytosis is dependent on the large GTPase dynamin (14). In order to verify if SUR1RKR→AAA internalization is dynamin-dependent as well we performed live cell imaging of cells transfected with BTX tag-SUR1RKR→AAA in the presence of the dynamin inhibitor dynasore (23) (24). Incubation of cells with 80μM dynasore 10min prior to and during live cell imaging led to a significant decrease of BTX tag-SUR1RKR→AAA internalization compared to untreated control (Figure 6A, supplemental movie S6). Similar observations were made in cells transfected with WT BTX tag-SUR1/Kir6.2 (images not shown). Quantification of intracellular puncta revealed that SUR1RKR→AAA, internalization was blocked by 84.25±0.48%, similar to the extent of block observed in WT channels (86.34±0.88%) (Fig.6C). Note a small number of fluorescent BTX tag-SUR1RKR→AAA puncta were internalized in dynasore treated cells, consistent with a previous report showing that dynasore blocks endocytosis by approximately 80-90% (25). Thus, like wild-type channels, SUR1RKR→AAA undergoes endocytosis in a dynamin-dependent manner. As dynamin is involved in CME but also caveolae-mediated endocytosis (26) (27), we conducted further experiments to test whether endocytosis of wild type KATP channels and SUR1RKR→AAA is mediated by the clathrin or caveolae-dependent pathway. We used the drug nystatin in order to block caveolae-mediated endocytic pathways (28). Treatment of cells with 25μg/ml nystatin did not block or reduce internalization of either SUR1RKR→AAA or WT SUR1/Kir6.2 compared to untreated controls (Figure 6B). Quantitative analysis showed that nystatin treatment had no significant effect on endocytosis of either WT SUR1/Kir6.2 or SUR1RKR→AAA (Figure 6C, left: WT=98.5±0.65% and SUR1RKR→AAA=99.6±1.4% internalization of untreated control), indicating that their endocytosis is unlikely to be caveolae-dependent.
Figure 6. SUR1RKR→AAA endocytosis is dynamin-dependent but not caveolae-mediated.

(A) Endocytosis of cells expressing BTX tag-SUR1RKR→AAA was monitored by live cell imaging either with or without dynasore treatment, a potent inhibitor of the large GTPase dynamin that is involved in clathrin- and caveolae-mediated endocytosis. Control cells not treated with dynasore showed robust internalization of SUR1RKR→AAA over a 30min time interval (top, scale bar 10μm) while endocytosis of SUR1RKR→AAA was almost completely blocked when the cells were treated with dynasore (bottom, scale bar 10μm) and the protein accumulated at the plasma membrane due to decreased endocytosis (see bright fluorescent surface staining at 30min in dynasore treated cell), indicating that SUR1RKR→AAA internalization is dynamin dependent (movies in supplemental material). (B) To test whether SUR1RKR→AAA internalization is mediated by caveolae cells were incubated with 25μg/ml nystatin, an inhibitor of caveolae-mediated endocytosis, labeled with TRITC-BTX dye at 4°C and chased for 30min at 37°C. SUR1RKR→AAA showed robust internalization when treated with nystatin comparable to untreated control cells (B, upper panel, all scale bars 10μm). The same observations were made in cells expressing WT channels (B, lower panel) indicating that neither SUR1RKR→AAA nor WT channel endocytosis is caveolae-mediated. (C) Quantitative analysis of endocytosis in nystatin and dynasore treated cells. Internalization of channels was measured as average intracellular fluorescence intensity present after 30min of chase. When treated with nystatin, cells expressing WT or SUR1RKR→AAA showed internalization rates comparable to untreated controls (n=4/condition).
The above results establish that wild type and mutant channel endocytosis is dynamin-dependent but not caveolae-mediated. Next, we tested whether internalization is mediated by a clathrin-dependent pathway. Cells expressing WT SUR1/Kir6.2 or SUR1RKR→AAA were treated with chlorpromazine or potassium depletion to inhibit CME (29) (30). Internalization of both SUR1RKR→AAA and WT SUR1/Kir6.2 was almost completely abolished under these conditions (Figure 7A, middle, chlorpromazine: WT=8.06% and SUR1RKR→AAA =4.1% of untreated control; bottom, K+-depletion: WT=1.9% and SUR1RKR→AAA=3.6% of untreated control). Transferrin was included in the chase media during the assay as an internal control for CME and transferrin endocytosis was also almost completely blocked by chlorpromazine and K+-depletion (compare Figure 7A, pictures labeled FITC-transferrin; top panel is untreated control). These findings strongly support the notion that endocytosis of SUR1RKR→AAA, just like internalization of WT KATP channels, is clathrin-mediated.
Figure 7. Endocytosis of SUR1RKR→AAA is clathrin-mediated.

Cells expressing WT channels or SUR1RKR→AAA were treated with different inhibitors of CME (see Materials and Methods). Internalization of WT and SUR1RKR→AAA was inhibited substantially when the cells were treated with 10μg/ml chlorpromazine (middle). WT channel internalization was blocked by 91.9% (n=16) and SUR1RKR→AAA by 95.9% (n=14) compared to their respective untreated controls (top; n>10). Transferrin uptake was almost completely blocked under these conditions (green). Exposure to potassium free solution before and during the assay (bottom) also blocked internalization of both WT (by 98.1%; n=5) and SUR1RKR→AAA (by 98.1%; n=8) compared to their respective untreated controls (n>10). Scale bars: 10μm.
Taken together, our results demonstrate that 1) SUR1, at least the SUR1RKR→AAA variant, is capable of undergoing endocytosis independently of Kir6.2 and 2) internalization of SUR1RKR→AAA follows the same route as wild type KATP-channels and 3) is dynamin-dependent and clathrin-mediated. These data strongly support a role of SUR1 in mediating endocytic trafficking of KATP channels.
Discussion
Regulation of membrane protein endocytosis and recycling is a common and important mechanism to control protein function and plays a critical role in various cellular events such as signaling, synaptic transmission and hormone secretion. In the present study we utilized a live cell imaging approach to monitor KATP endocytosis in real time. To our knowledge, this is the first study following the dynamic endocytic trafficking of KATP channels in living cells. The use of a high-affinity BTX-binding-peptide tag to study protein trafficking by live imaging has been previously documented for a number of ion channels and G-protein coupled receptors (22, 31-33). It offers several advantages over conventional immunohistochemical approaches using antibody labeling in fixed cells or live cell imaging using fluorescent protein-tags such as GFP. Antibodies are large proteins that may limit spatial resolution and may also lead to clustering of surface proteins with possible confounding effects on trafficking (34, 35). GFP-tagging does not distinguish between intracellular or surface protein pools. Because of the large size of GFP it can affect protein function or trafficking as it has been documented for KATP channels (36). Using patch-clamp recordings, we showed that the extracellular N-terminal BTX tag itself or binding of fluorophore conjugated-BTX to the tagged SUR1 protein does not alter channel gating properties or channel density (Supplemental Figure 1). We have previously shown that a FLAG-tag placed at the N-terminus of SUR1 also does not affect channel function (6). This is likely because 1) in both cases the tags are small peptides minimizing effects on protein folding and 2) KATP channel gating is mostly regulated by intracellular ligands.
Comparison with previous KATP channel endocytosis studies
Two internalization signals, both in Kir6.2, have been implicated in mediating KATP channel endocytosis in previous studies. The first is a dileucine motif present in the C-terminus of Kir6.2 (355LL356) that has been proposed to mediate PKC-induced, clathrin-mediated endocytosis of SUR2A/Kir6.2 and SUR1/Kir6.2 KATP channels to down-regulate channel function in heterologous expression systems and in cardiac ventricular myocytes (14). The second is a tyrosine-based motif reported by Mankouri et al., also in the C-terminus of Kir6.2 (330YSKF333). In their study, it was concluded that KATP channels undergo constitutive endocytosis mediated by the tyrosine-based motif in Kir6.2 and that SUR1 does not play a signaling role, as surface-labeled myc-tagged SUR1RKR→AAA expressed in the absence of Kir6.2 was not internalized over a 30min time course. The authors further showed that introducing neonatal diabetes-associated mutations Y330C or F333I in Kir6.2 prevented endocytosis of KATP channels leading to their proposal that reduced endocytosis is a contributing mechanism to increased channel activity and disease (15). In contrast, the studies we present here - using live cell imaging complemented by immunocytochemistry and surface biotinylation approaches - clearly show that Y330C, Y330A and F333I Kir6.2 mutants do undergo endocytosis similar to wild type channels (Figure 2). Also in contrast to the notion that Y330C and F333I cause neonatal diabetes in part by increasing their surface density, our results showed significantly reduced surface expression of these mutants suggesting they cause increased channel activity and neonatal diabetes solely via effects on gating (37). It is interesting to note that a similar tyrosine motif 332YSRF335 is present in a closely related channel Kir2.3 and has been reported not to be responsible for mediating endocytosis of the channel (38). Moreover, two residues in the proposed Kir6.2 tyrosine motif, Y330 and F333, are predicted to lie closely to the Kir6.2 subunit-subunit interface or SUR1-Kir6.2 interface and may be involved in ATP binding or ATP-induced gating (37, 39). Mutations at either of these residues (Y330C and F333I) cause permanent neonatal diabetes by rendering the channel less sensitive to ATP inhibition (37). These studies raise the question of whether the proposed tyrosine motif residues would be available for interaction with adaptor proteins to signal endocytosis.
A role of SUR1 in KATP channel endocytosis
In our study we found that SUR1RKR→AAA itself is endocytosed in the absence of Kir6.2, with a time course and intracellular distribution similar to WT SUR1/Kir6.2 channels. Since these results again contradict with previous studies (15), we repeated some of our experiments in the human tsA-201 cell line used in the previous study to exclude the possibility that the internalization of SUR1RKR→AAA is cell-type or species dependent (Figure 5). Our results showed clearly endocytosis of SUR1RKR→AAA also occurs in tsA-201 cells. One possible explanation for the observed discrepancy between the two studies could be the number of cells analyzed. We analyzed two independent experiments with more than 20 cells per condition and a total of more than 200 individual internalized puncta counted (Figure 3C, 5B, and 6C). When screening by confocal microscopy we found that a small percentage of cells did not show internalization of either mutant or WT channels possibly because these cells were in a specific stage of the cell cycle (not shown)(40, 41). Smaller sample size in the earlier study could lead to the conclusion that endocytosis is impaired. Another explanation for impaired endocytosis of SUR1RKR→AAA reported in the previous study might be the use of an anti-myc antibody to investigate protein internalization. Antibodies, although widely used to monitor internalization behavior, can pose problems due to specificity and/ or bulkiness of the antibody molecules for example with significant impact on membrane trafficking (35, 42). Therefore, antibodies should be extensively tested in the system used. Ideally, the SUR1RKR→AAA endocytosis assay would have been complemented by a secondary method to draw a definitive conclusion about internalization behavior of SUR1RKR→AAA.
Our study, using three different approaches, shows that endocytosis of SUR1RKR→AAA is comparable if not more efficient than that of WT SUR1/Kir6.2 channels. Moreover, co-localization with various endocytic compartment markers showed similar patterns between internalized SUR1RKR→AAA and WT SUR1/Kir6.2. That SUR1RKR→AAA alone is internalized independently of Kir6.2 with similar intracellular distribution as WT KATP channels suggest SUR1 itself likely carries endocytosis signals and may contribute to endocytic trafficking regulation of the channel. Moreover, we found that endocytosis of SUR1RKR→AAA can be abolished specifically by dynasore, an inhibitor of the GTPase dynamin and by inhibitors of CME but not caveolae-mediated endocytosis, strongly supporting the concept that SUR1RKR→AAA is internalized by a dynamin-dependent, clathrin-mediated process.
Typical clathrin-mediated endocytosis motifs are dileucine or tyrosine-based YXXΦ or NPXY (where X represents any amino acid and Φ represents bulky hydrophobic amino acids). Other non-canonical signals such as di-isoleucine in Kir2.3 have also been reported (38). In some cases, multiple signals may be involved to regulate endocytic protein trafficking and sorting as in CFTR, another ABC transporter (43). The SUR1 sequence contains many such motifs (>10) and future systematic analysis of these signals will identify those that are relevant to channel endocytosis. In addition to endocytosis, KATP channels have also been reported to undergo recycling (44). Consistent with this, we have observed co-localization of internalized channels with the recycling-endosome marker FITC-transferrin. Which signals regulate further sorting of endocytosed channels is also an important question to address in future studies.
In summary, we have developed SUR1 and Kir6.2 tagged with an extracellular α-bungarotoxin binding peptide to follow KATP channels endocytosis by live cell imaging. These tools could be adapted to studying physiological trafficking regulation of plasma membrane KATP channels in isolated islets or even in vivo. Our findings that mutations in the proposed Kir6.2 330YSKF333 motif do not prevent channel endocytosis and that SUR1RKR→AAA alone undergoes endocytosis challenge the previous view that channel endocytosis is solely mediated by the Kir6.2 subunit. They raise new questions on the signaling role of SUR1 in KATP channel trafficking regulation from the plasma membrane, and open up the possibility that mutations in SUR1 may alter endocytic trafficking of KATP channels to cause insulin secretion disease.
Materials and Methods
Molecular Biology
Rat Kir6.2 cDNA is in pCDNAI/Amp vector and N-terminal FLAG-epitope (DYKDDDDK)-tagged SUR1 (fSUR1) in pECE as previously described. A minimal α-bungarotoxin (WRYYESSLEPYPD) binding peptide tag was inserted at the N-terminus of SUR1 (BTX tag-SUR1) in pECE using the polymerase chain reaction and the following primers, forward: 5′-GCTTGTCGACGCCGCCATGTGGCGGTACTACGAGAGCAGCCTGGAGCCCTACCCCACATGCCCTTGGCC-3′ and reverse: 5′-GGCCAAGGGCATGTCGGGGTAGGGCTCAGGCTGCTCTCGTAGTACCGCCACATGGCGGCGTCGACAAGC-3′. Additionally, a 9-amino acid linker (YAYMEKGDL) followed by a minimal-bungarotoxin epitope tag (WRYYESSLEPYPD) was introduced into the turret region of rat Kir6.2 pCDNAI/Amp (BTX+9 Kir6.2) between amino acids L100 and A101 using the polymerase chain reaction and the following primers, forward: 5′-GCATATATGGAAAAAGGAGACCTGTGGCGGTACTACGAGAGCAGCCTGGAGCCCTACCCCGACGCCCCCGGAGAGGGCACCAATGT-3′ and reverse: 5′-ACATTGGTGCCCTCTCCGGGGGCGTCGGGGTAGGGCTCCAGGCTGCTCTCGTAGTACCGCCACAGGTCTCCTTTTTCCATATATGC-3.′ Site-directed mutagenesis was performed using the QuikChange mutagenesis kit (Stratagene). Mutant clones from two or more independent PCR reactions were analyzed and fully sequenced to avoid false results caused by undesired mutations (6, 16).
Electrophysiology
COSm6 cells were co-transfected with cDNAs for BTX tag-SUR1 and Kir6.2 and the green fluorescent protein (to facilitate identification of transfected cells) using Fugene6 (Roche), and plated onto cover slips 24hrs after transfection. Inside-out patch-clamp recordings were made 36-72hrs post-transfection at room temperature using micropipettes (resistance ∼1.5 MΩ) pulled from non-heparinized Kimble glass (Fisher Scientific) on a horizontal puller (Sutter Instrument). Inside-out patches were voltage-clamped with an Axopatch 1D amplifier (Axon Inc.). The bath and pipette solution (K-INT) contained: 140 mM KCl, 10 mM K-HEPES, 1 mM K-EGTA, pH 7.3. Currents were measured at membrane potential of -50 mV (pipette voltage = +50 mV) and inward currents shown as upward deflections.
Western Blotting
COSm6 cells plated in 35mm dishes were transfected with 0.6μg SUR1 and 0.4μg Kir6.2 using 3μl Fugene6 and lysed 48hrs post transfection in 20mM HEPES, 150mM NaCl, 4mM EDTA, 1mM EGTA, 1% Ipegal, 0.1% SDS, 0.04% Deoxycholate, pH-7.2 with complete protease inhibitor (Roche) for 20min at 4°C. Proteins in the cell lysate were separated by 7.5%, 10% or 4-12% gradient SDS-PAGE (BioRad; Invitrogen), transferred to nitrocellulose membranes (GE Amersham), blocked in 6% non-fat milk/TBS and analyzed by incubation with appropriate primary antibodies followed by HRP-conjugated secondary antibodies (GE Amersham), and visualized by enhanced chemiluminescence (Super Signal West Femto; Pierce) using the FluorChem®E Digital Darkroom (Cell Biosciences).
Chemiluminescence Assays
COSm6 cells were transfected with channel subunit cDNAs as described above and assayed 48hrs post transfection. Cells were fixed with 2% paraformaldehyde/PBS for 20min at 4°C and preblocked in PBS/0.5% BSA for 1hr. Cells were then incubated with anti-FLAG antibody (10μg/ml, Sigma, St. Louis, MO, USA) for 1hr, washed three times 20min each in PBS/0.5% BSA, and incubated in HRP-conjugated sheep anti-mouse antibody (GE Amersham, Piscataway, NJ, USA) for 1hr. After four washes 30min each in PBS/0.5% BSA, cells were incubated for 10sec in ELISA Femto luminol solution (Pierce, Rockford, IL, USA) and chemiluminescence was quantified using a TD-20/20 luminometer (Turner Designs, Sunnyvale, CA, USA). Results of each experiment are the average of two dishes. For pulse-chase internalization assays, cells were first labeled with anti-FLAG antibody (10μg/ml, Sigma) for 1hr at 4°C. Cells were chased at 37°C for various times to allow internalization and then fixed and processed as above to obtain chemiluminescence measurements.
Biotinylation Assays
COSm6 cells were plated in 10cm dishes and transfected with 3μg SUR1 and 2μg Kir6.2 with 15μl Fugene6, and subjected to surface biotinylation 36-48hrs post transfection. Surface biotinylation was performed at 4°C by incubation with 1.5mg/ml Sulfo-NHS-SS-Biotin (Pierce, Rockford, IL, USA) in PBS for 20min. Residual free biotin was quenched with 2 washes of 50mM Glycine/PBS 5min each at 4°C. Cells were returned to 37°C and chased for allotted times. Endocytosis was terminated by the addition of ice-cold 4°C 10mM D-glucose/PBS and cells were kept on ice until all time points were reached. Biotinylated proteins remaining at the plasma membrane were kept intact (referred to as unstripped samples) or stripped of the biotin label with two washes of 50mM glutathione buffer (75mM NaOH, 75mM NaCl, 1mM EDTA, 0.1% BSA, pH-9.0) 20min each at 4°C (referred to as stripped samples). Residual glutathione was quenched with 5mg/ml Iodoacetamide/PBS (Sigma, St. Louis, MO, USA) for 5min at 4°C. Cells were lysed in 1ml of extraction buffer (50mM Tris-HCl, 2mM EDTA, 2mM EGTA, 100mM NaCl, 1% Triton X-100, pH-7.4 with complete protease inhibitor) for 30min at 4°C. 1mg total lysate was incubated with 100μl of ∼50% slurry NeutrAvidin Agarose (Pierce, Rockford, IL, USA) overnight at 4°C. Biotinylated proteins were eluted with 2× protein loading buffer for 15min at room temperature and analyzed by Western Blotting using anti-FLAG, anti-SUR1 or anti-Kir6.2 antibodies (19). IgG purified anti-Kir6.2 was from rabbit serum raised against the C-terminus of Kir6.2 (aa 170-390) fused with GST (45). IgG purified anti-SUR1 was from rabbit serum raised against the C-terminal peptide of hamster SUR1 (KDSVFASFVRADK) (27). Densitometry was performed on 16-bit Tif image files using AlphaView® software (Cell Biosciences). Density data was determined using the band-analysis feature and calculated as the background corrected average sum of pixel intensities within a defined region.
Imaging
COS, INS-1 and tsA-201 cells were cultured following standard protocols. All imaging experiments described below were performed on a Zeiss LSM710 3-channel spectral confocal microscope and imaging was done with 63×1.4NA objective (Carl Zeiss, Jena, Germany). All imaging data is from at least 2 independent experiments with at least 10cells/experiment unless otherwise indicated (total n>20 per condition).
Live cell imaging
COS cells were plated onto 35mm dishes and transfected with WT BTX tag-SUR1 and WT or mutant Kir6.2 or BTX tag-SUR1RKR→AAA alone. After additional 24hrs cells were split at the appropriate density onto 18 mm, #1.5 glass cover slips (Warner Instruments, Hamden, CT, USA). Live cell imaging was performed 48hrs post transfection. Cover slips were placed in the imaging chamber (Carl Zeiss, Jena, Germany) and the cell culture media was exchanged to HBSS supplemented with 10mM Hepes. The chamber was placed onto the microscope with a stage top incubator warmed to 37°C (Carl Zeiss, Jena, Germany). TRITC-BTX (Molecular Probes, Eugene, OR, USA) was added directly into the imaging solution at a 1:200 dilution and image acquisition was started immediately. TRITC-BTX was present in the medium throughout the imaging experiment. Images were taken every 15sec for 30min. Untransfected cells were imaged as control to account for potential unspecific background staining. INS-1 cells were infected with WT BTX tag-SUR1 and WT Kir6.2 recombinant adenoviruses as described previously (46). Live cell imaging was carried out as described for COSm6 cells. For experiments with dynasore cells were serum starved for 2 hours and incubated with 80μM dynasore for 10min prior to imaging. Dynasore was added to the imaging solution as well.
BTX pulse-chase labeling
COSm6 cells were transfected and plated as described for live cell imaging. TsA-201 cells were plated the same way but transfected using the Ca2PO4-method. For pulse-chase labeling cells were incubated with TRITC-BTX (Molecular Probes, Eugene, OR, USA) at 1:200 diluted in DMEM at 4°C. After 1hr the dye was replaced with pure DMEM and cells were further incubated at 37°C, fixed at the desired time points and viewed under the microscope. Untransfected cells treated the same way served as control to exclude nonspecific binding of the dye. For co-localization studies with the fluid phase marker, cells were treated as described above but Alexa Fluor 488-conjugated BSA (FITC-BSA, Molecular Probes, Eugene, OR, USA) was included in the chase media at 1mg/ml. For experiments where co-localization with transferrin was examined or transferrin was used as CME marker, 10μg/ml FITC-transferrin (Invitrogen, Carlsbad, CA, USA) was included in the chase media. For co-localization studies with the early endosomal marker EEA1, cells were treated the same way, fixed after 30min chase and stained with mouse anti-EEA1 at 1:1000 (BD Transduction Laboratories, San Jose, CA, USA) and the appropriate secondary antibody. Cells stained with secondary antibody only and untransfected cells served as controls (data not shown).
Inhibition of different endocytic pathways
Treatment of cells with dynasore is described under live cell imaging. Nystatin (25 μg/ml) treatment of cells was carried out as described previously (27) and BTX pulse-chase labeling was performed in the presence of the drug. For treatment with chlorpromazine, cells were pre-incubated with 10μg/ml chlorpromazine in serum-free media for 45min and the BTX pulse-chase assay was carried out in the presence of the drug. Potassium depletion was carried out as described previously (30) and the BTX pulse chase assay was performed in potassium free buffer.
Image analysis
All image analysis was done using Metamorph (Molecular Devices, Downington, PA, USA). For the live cell imaging experiments shown in Fig.1-3, a line scan analysis was used to track the migration of fluorescence signals from cell surface towards the interior of the cell over time. The area of analysis is indicated by the box framed by the two solid lines and the two dotted lines in the image such that most of the area of the cell was covered. The maximum intensity of TRITC-BTX fluorescence was determined by a scan along the dotted line for a set pixel width and the scan repeated across the distance defined by the white lines. The maximum fluorescence intensity detected in each scan was then plotted against the pixel distance across the cell (represented by the white lines). Note this analysis does not quantify the total fluorescence signal associated with the plasma membrane or the space between the membranes but simply detects strong intracellular fluorescence signals associated with the brightest endosomes that develop over time.
For pulse-chase experiments with FITC-BSA co-localization was determined and puncta were counted according to Glynn and McAllister (47). Transferrin co-localization analysis was performed using the co-localization routine of the program. Pictures from the two different channels (488nm and 561nm) were thresholded for light objects. Co-localized objects had to be positive for staining in both channels. Appropriate secondary antibody only stained controls were employed.
Internalization rate of channels was determined by measuring the average intracellular fluorescence intensity of cells after 30min of pulse-chase. Pictures of individual cells were thresholded and a region including the cytosol but excluding the remaining surface stain was drawn for each cell. The average fluorescence intensity of the cytosol was calculated by dividing the integrated fluorescence of the measured region by its size. Values for internalization are expressed as percentage of internalization observed in control cells.
Statistics
Data averages are mean ± SEM unless otherwise stated. Statistical tests for normally and non-normally distributed data (t-test and Man-Whitney rank sum test) were employed. When statistical tests were applied a p value < 0.05 was considered significant.
Supplementary Material
(A) Representative inside-out patch-clamp recordings from COS cells co-transfected with BTX tag-SUR1 and WT Kir6.2 not pretreated (left) or pretreated for 30min with TRITC-BTX at a concentration used in the imaging experiments (1:200) (right). In both cases, currents were readily inhibited by 1mM ATP, similar to those seen in cells expressing non-tagged channels (48) (not shown). Recordings were made at -50mV in symmetrical K-INT solution as described in Materials and Methods and inward currents are shown as upward deflections. (B) Average current amplitude observed in patches from control and BTX-treated cells. The bar represents the mean±standard error of the mean from 12 (control) or 10 (BTX-treated) cells. There is no statistically significant difference between the two groups by Student's-t test (p > 0.05).
COSm6 cells were labeled with TRITC-BTX at 4°C and chased for 30min at 37°C with the marker FITC-BSA included in the chase media. Cells transfected with WT BTX tag-Kir6.2/ SUR1 displayed punctate TRITC-BTX staining (left panel, red, scale bar 10 μm) which colocalized with the fluid phase marker FITC-BSA (middle panel, green) and thus confirming the intracellular nature of the channel staining (see merged picture and inset, right panel). Channel behavior was similar to WT BTX tag-SUR1/ Kir6.2 channels.
All movies were compiled with MetaMorph software and play at 5 frames/sec.
Movie S1. Movie corresponds to Figure 1A. A COS cell expressing BTX tag-SUR1 and WT Kir6.2 shows endocytosis of channels over a 30min time interval. Images were taken every 15 sec for 30min (scale bar 5 μm).
Movie S2. Movie of INS-1 cells expressing BTX tag-SUR1 and WT Kir6.2 corresponding to Figure 1B. Images were taken every 15 sec for 30min (scale bar 5 μm). In both cases (Movie S1 and 1B) internalization of KATP can be visually followed over time as fluorescent puncta budding from the plasma membrane and migrating to the cytosol.
Movie S3. Movie of a COS cell expressing SUR1 WT and BTX tag-Kir6.2. Images were taken every 15 sec for 15min. The BTX tag can be fused to either KATP channel subunit with no difference in internalization behavior (compare to Movie S1, scale bar 10 μm).
Movie S4. 30min movie of COS cells expressing BTX tag-SUR1 and Kir6.2 Y330C corresponding to Figure 2A. Internalization of BTX tag-SUR1/ Kir6.2 Y330C is similar to wild type channels (scale bar 5 μm).
Movie S5. Movie of COS cells expressing BTX tag-SUR1RKR→AAA only. SUR1 internalizes independently from Kir6.2 when the ER-retention signal is mutated (30min movie, scale bar 10 μm). This movie corresponds to figure 6A, top as control for the dynasore treated cell.
Movie S6. Movie of COS cells expressing BTX tag-SUR1RKR→AAA with the drug dynasore in the imaging media. SUR1RKR→AAA internalization is greatly reduced when dynasore, an inhibitor of dynamin was present (30min movie, scale bar 10 μm).
Acknowledgments
We thank the staff, especially Dr. Stefanie Kaech-Petrie, of the Advanced Light Microscopy Core at The Jungers Center (OHSU, Portland, OR, USA) for their expert help with image acquisition and image analysis. We thank Dr. Emily B. Pratt and Dr. Qing Zhou for help with supplementary data. The INS-1E cell line clone 832/13 was kindly provided by Dr. Christopher B. Newgard. Rat Kir6.2 was from Dr. Carol A. Vandenberg. This work was supported by National Institutes of Health grant DK57699 (to S.-L. S.), the March of Dimes Research Grant Foundation grant 1-2001-707 (to S.-L. S.), and a Collins Medical Trust Foundation Grant (to C.E.B.).
Footnotes
Supporting Information: Additional Supporting Information may be found in the online version of this article.
References
- 1.Ashcroft FM. ATP-sensitive potassium channelopathies: focus on insulin secretion. J Clin Invest. 2005;115(8):2047–2058. doi: 10.1172/JCI25495. [DOI] [PMC free article] [PubMed] [Google Scholar]
- 2.Ashcroft FM. The Walter B. Cannon Physiology in Perspective Lecture, 2007. ATP-sensitive K+ channels and disease: from molecule to malady. Am J Physiol Endocrinol Metab. 2007;293(4):E880–889. doi: 10.1152/ajpendo.00348.2007. [DOI] [PubMed] [Google Scholar]
- 3.McTaggart JS, Clark RH, Ashcroft FM. The role of the KATP channel in glucose homeostasis in health and disease: more than meets the islet. J Physiol. 2010 doi: 10.1113/jphysiol.2010.191767. [DOI] [PMC free article] [PubMed] [Google Scholar]
- 4.Lin CW, Lin YW, Yan FF, Casey J, Kochhar M, Pratt EB, Shyng SL. Kir6 2 mutations associated with neonatal diabetes reduce expression of ATP-sensitive K+ channels: implications in disease mechanism and sulfonylurea therapy. Diabetes. 2006;55(6):1738–1746. doi: 10.2337/db05-1571. [DOI] [PubMed] [Google Scholar]
- 5.Haider S, Antcliff JF, Proks P, Sansom MS, Ashcroft FM. Focus on Kir6.2: a key component of the ATP-sensitive potassium channel. J Mol Cell Cardiol. 2005;38(6):927–936. doi: 10.1016/j.yjmcc.2005.01.007. [DOI] [PubMed] [Google Scholar]
- 6.Cartier EA, Conti LR, Vandenberg CA, Shyng SL. Defective trafficking and function of KATP channels caused by a sulfonylurea receptor 1 mutation associated with persistent hyperinsulinemic hypoglycemia of infancy. Proc Natl Acad Sci U S A. 2001;98(5):2882–2887. doi: 10.1073/pnas.051499698. [DOI] [PMC free article] [PubMed] [Google Scholar]
- 7.Kane C, Shepherd RM, Squires PE, Johnson PR, James RF, Milla PJ, Aynsley-Green A, Lindley KJ, Dunne MJ. Loss of functional KATP channels in pancreatic beta-cells causes persistent hyperinsulinemic hypoglycemia of infancy. Nat Med. 1996;2(12):1344–1347. doi: 10.1038/nm1296-1344. [DOI] [PubMed] [Google Scholar]
- 8.Aguilar-Bryan L, Bryan J, Nakazaki M. Of mice and men: K(ATP) channels and insulin secretion. Recent Prog Horm Res. 2001;56:47–68. doi: 10.1210/rp.56.1.47. [DOI] [PubMed] [Google Scholar]
- 9.Taschenberger G, Mougey A, Shen S, Lester LB, LaFranchi S, Shyng SL. Identification of a familial hyperinsulinism-causing mutation in the sulfonylurea receptor 1 that prevents normal trafficking and function of KATP channels. The Journal of biological chemistry. 2002;277(19):17139–17146. doi: 10.1074/jbc.M200363200. [DOI] [PubMed] [Google Scholar]
- 10.Zerangue N, Schwappach B, Jan YN, Jan LY. A new ER trafficking signal regulates the subunit stoichiometry of plasma membrane K(ATP) channels. Neuron. 1999;22(3):537–548. doi: 10.1016/s0896-6273(00)80708-4. [DOI] [PubMed] [Google Scholar]
- 11.Smith AJ, Taneja TK, Mankouri J, Sivaprasadarao A. Molecular cell biology of KATP channels: implications for neonatal diabetes. Expert Rev Mol Med. 2007;9(21):1–17. doi: 10.1017/S1462399407000403. [DOI] [PubMed] [Google Scholar]
- 12.Dunne MJ, Cosgrove KE, Shepherd RM, Aynsley-Green A, Lindley KJ. Hyperinsulinism in infancy: from basic science to clinical disease. Physiol Rev. 2004;84(1):239–275. doi: 10.1152/physrev.00022.2003. [DOI] [PubMed] [Google Scholar]
- 13.Yan FF, Casey J, Shyng SL. Sulfonylureas correct trafficking defects of disease-causing ATP-sensitive potassium channels by binding to the channel complex. The Journal of biological chemistry. 2006;281(44):33403–33413. doi: 10.1074/jbc.M605195200. [DOI] [PubMed] [Google Scholar]
- 14.Hu K, Huang CS, Jan YN, Jan LY. ATP-sensitive potassium channel traffic regulation by adenosine and protein kinase C. Neuron. 2003;38(3):417–432. doi: 10.1016/s0896-6273(03)00256-3. [DOI] [PubMed] [Google Scholar]
- 15.Mankouri J, Taneja TK, Smith AJ, Ponnambalam S, Sivaprasadarao A. Kir6.2 mutations causing neonatal diabetes prevent endocytosis of ATP-sensitive potassium channels. EMBO J. 2006;25(17):4142–4151. doi: 10.1038/sj.emboj.7601275. [DOI] [PMC free article] [PubMed] [Google Scholar]
- 16.McCann CM, Bareyre FM, Lichtman JW, Sanes JR. Peptide tags for labeling membrane proteins in live cells with multiple fluorophores. Biotechniques. 2005;38(6):945–952. doi: 10.2144/05386IT02. [DOI] [PubMed] [Google Scholar]
- 17.Giblin JP, Quinn K, Tinker A. The cytoplasmic C-terminus of the sulfonylurea receptor is important for KATP channel function but is not key for complex assembly or trafficking. Eur J Biochem. 2002;269(21):5303–5313. doi: 10.1046/j.1432-1033.2002.03249.x. [DOI] [PubMed] [Google Scholar]
- 18.Lim A, Park SH, Sohn JW, Jeon JH, Park JH, Song DK, Lee SH, Ho WK. Glucose deprivation regulates KATP channel trafficking via AMP-activated protein kinase in pancreatic beta-cells. Diabetes. 2009;58(12):2813–2819. doi: 10.2337/db09-0600. [DOI] [PMC free article] [PubMed] [Google Scholar]
- 19.Smith AJ, Sivaprasadarao A. Investigation of K(ATP) channel endocytosis and cell surface density by Biotinylation and Western blotting. Methods Mol Biol. 2008;491:79–89. doi: 10.1007/978-1-59745-526-8_6. [DOI] [PubMed] [Google Scholar]
- 20.Smith AJ, Sivaprasadarao A. Investigation of K(ATP) channel endocytosis by immunofluorescence. Methods Mol Biol. 2008;491:69–77. doi: 10.1007/978-1-59745-526-8_5. [DOI] [PubMed] [Google Scholar]
- 21.Harel M, Kasher R, Nicolas A, Guss JM, Balass M, Fridkin M, Smit AB, Brejc K, Sixma TK, Katchalski-Katzir E, Sussman JL, Fuchs S. The binding site of acetylcholine receptor as visualized in the X-Ray structure of a complex between alpha-bungarotoxin and a mimotope peptide. Neuron. 2001;32(2):265–275. doi: 10.1016/s0896-6273(01)00461-5. [DOI] [PubMed] [Google Scholar]
- 22.Moise L, Liu J, Pryazhnikov E, Khiroug L, Jeromin A, Hawrot E. K(V)4.2 channels tagged in the S1-S2 loop for alpha-bungarotoxin binding provide a new tool for studies of channel expression and localization. Channels (Austin) 2010;4(2) doi: 10.4161/chan.4.2.10878. [DOI] [PMC free article] [PubMed] [Google Scholar]
- 23.Macia E, Ehrlich M, Massol R, Boucrot E, Brunner C, Kirchhausen T. Dynasore, a cell-permeable inhibitor of dynamin. Dev Cell. 2006;10(6):839–850. doi: 10.1016/j.devcel.2006.04.002. [DOI] [PubMed] [Google Scholar]
- 24.Nankoe SR, Sever S. Dynasore puts a new spin on dynamin: a surprising dual role during vesicle formation. Trends Cell Biol. 2006;16(12):607–609. doi: 10.1016/j.tcb.2006.10.004. [DOI] [PubMed] [Google Scholar]
- 25.Lee S, Jung KY, Park J, Cho JH, Kim YC, Chang S. Synthesis of potent chemical inhibitors of dynamin GTPase. Bioorg Med Chem Lett. 2010;20(16):4858–4864. doi: 10.1016/j.bmcl.2010.06.092. [DOI] [PubMed] [Google Scholar]
- 26.Mayor S, Pagano RE. Pathways of clathrin-independent endocytosis. Nat Rev Mol Cell Biol. 2007;8(8):603–612. doi: 10.1038/nrm2216. [DOI] [PubMed] [Google Scholar]
- 27.Sun B, Boyanovsky BB, Connelly MA, Shridas P, van der Westhuyzen DR, Webb NR. Distinct mechanisms for OxLDL uptake and cellular trafficking by class B scavenger receptors CD36 and SR-BI. J Lipid Res. 2007;48(12):2560–2570. doi: 10.1194/jlr.M700163-JLR200. [DOI] [PubMed] [Google Scholar]
- 28.Singh RD, Puri V, Valiyaveettil JT, Marks DL, Bittman R, Pagano RE. Selective caveolin-1-dependent endocytosis of glycosphingolipids. Mol Biol Cell. 2003;14(8):3254–3265. doi: 10.1091/mbc.E02-12-0809. [DOI] [PMC free article] [PubMed] [Google Scholar]
- 29.Yumoto R, Nishikawa H, Okamoto M, Katayama H, Nagai J, Takano M. Clathrin-mediated endocytosis of FITC-albumin in alveolar type II epithelial cell line RLE-6TN. Am J Physiol Lung Cell Mol Physiol. 2006;290(5):L946–955. doi: 10.1152/ajplung.00173.2005. [DOI] [PubMed] [Google Scholar]
- 30.Larkin JM, Brown MS, Goldstein JL, Anderson RG. Depletion of intracellular potassium arrests coated pit formation and receptor-mediated endocytosis in fibroblasts. Cell. 1983;33(1):273–285. doi: 10.1016/0092-8674(83)90356-2. [DOI] [PubMed] [Google Scholar]
- 31.Sekine-Aizawa Y, Huganir RL. Imaging of receptor trafficking by using alpha-bungarotoxin-binding-site-tagged receptors. Proc Natl Acad Sci U S A. 2004;101(49):17114–17119. doi: 10.1073/pnas.0407563101. [DOI] [PMC free article] [PubMed] [Google Scholar]
- 32.Levandoski MM, Lin Y, Moise L, McLaughlin JT, Cooper E, Hawrot E. Chimeric analysis of a neuronal nicotinic acetylcholine receptor reveals amino acids conferring sensitivity to alpha-bungarotoxin. The Journal of biological chemistry. 1999;274(37):26113–26119. doi: 10.1074/jbc.274.37.26113. [DOI] [PubMed] [Google Scholar]
- 33.Sanders T, Hawrot E. A novel pharmatope tag inserted into the beta4 subunit confers allosteric modulation to neuronal nicotinic receptors. The Journal of biological chemistry. 2004;279(49):51460–51465. doi: 10.1074/jbc.M409533200. [DOI] [PubMed] [Google Scholar]
- 34.Moser N, Mechawar N, Jones I, Gochberg-Sarver A, Orr-Urtreger A, Plomann M, Salas R, Molles B, Marubio L, Roth U, Maskos U, Winzer-Serhan U, Bourgeois JP, Le Sourd AM, De Biasi M, et al. Evaluating the suitability of nicotinic acetylcholine receptor antibodies for standard immunodetection procedures. J Neurochem. 2007;102(2):479–492. doi: 10.1111/j.1471-4159.2007.04498.x. [DOI] [PubMed] [Google Scholar]
- 35.Rhodes KJ, Trimmer JS. Antibodies as valuable neuroscience research tools versus reagents of mass distraction. J Neurosci. 2006;26(31):8017–8020. doi: 10.1523/JNEUROSCI.2728-06.2006. [DOI] [PMC free article] [PubMed] [Google Scholar]
- 36.Makhina EN, Nichols CG. Independent trafficking of KATP channel subunits to the plasma membrane. The Journal of biological chemistry. 1998;273(6):3369–3374. doi: 10.1074/jbc.273.6.3369. [DOI] [PubMed] [Google Scholar]
- 37.Tammaro P, Girard C, Molnes J, Njolstad PR, Ashcroft FM. Kir6.2 mutations causing neonatal diabetes provide new insights into Kir6.2-SUR1 interactions. Embo J. 2005;24(13):2318–2330. doi: 10.1038/sj.emboj.7600715. [DOI] [PMC free article] [PubMed] [Google Scholar]
- 38.Mason AK, Jacobs BE, Welling PA. AP-2-dependent internalization of potassium channel Kir2.3 is driven by a novel di-hydrophobic signal. The Journal of biological chemistry. 2008;283(10):5973–5984. doi: 10.1074/jbc.M709756200. [DOI] [PubMed] [Google Scholar]
- 39.Antcliff JF, Haider S, Proks P, Sansom MS, Ashcroft FM. Functional analysis of a structural model of the ATP-binding site of the K(ATP) channel Kir6.2 subunit. Embo J. 2005;24(2):229–239. doi: 10.1038/sj.emboj.7600487. [DOI] [PMC free article] [PubMed] [Google Scholar]
- 40.Berlin RD, Oliver JM. Surface functions during mitosis. II. Quantitation of pinocytosis and kinetic characterization of the mitotic cycle with a new fluorescence technique. The Journal of cell biology. 1980;85(3):660–671. doi: 10.1083/jcb.85.3.660. [DOI] [PMC free article] [PubMed] [Google Scholar]
- 41.Schweitzer JK, Burke EE, Goodson HV, D'Souza-Schorey C. Endocytosis resumes during late mitosis and is required for cytokinesis. The Journal of biological chemistry. 2005;280(50):41628–41635. doi: 10.1074/jbc.M504497200. [DOI] [PubMed] [Google Scholar]
- 42.Mammen AL, Huganir RL, O'Brien RJ. Redistribution and stabilization of cell surface glutamate receptors during synapse formation. J Neurosci. 1997;17(19):7351–7358. doi: 10.1523/JNEUROSCI.17-19-07351.1997. [DOI] [PMC free article] [PubMed] [Google Scholar]
- 43.Hu W, Howard M, Lukacs GL. Multiple endocytic signals in the C-terminal tail of the cystic fibrosis transmembrane conductance regulator. Biochem J. 2001;354(Pt 3):561–572. doi: 10.1042/0264-6021:3540561. [DOI] [PMC free article] [PubMed] [Google Scholar]
- 44.Manna PT, Smith AJ, Taneja TK, Howell GJ, Lippiat JD, Sivaprasadarao A. Constitutive endocytic recycling and protein kinase C-mediated lysosomal degradation control K(ATP) channel surface density. The Journal of biological chemistry. 2010;285(8):5963–5973. doi: 10.1074/jbc.M109.066902. [DOI] [PMC free article] [PubMed] [Google Scholar]
- 45.Yan FF, Lin CW, Cartier EA, Shyng SL. Role of ubiquitin-proteasome degradation pathway in biogenesis efficiency of {beta}-cell ATP-sensitive potassium channels. Am J Physiol Cell Physiol. 2005;289(5):C1351–1359. doi: 10.1152/ajpcell.00240.2005. [DOI] [PMC free article] [PubMed] [Google Scholar]
- 46.Lin CW, Yan F, Shimamura S, Barg S, Shyng SL. Membrane phosphoinositides control insulin secretion through their effects on ATP-sensitive K+ channel activity. Diabetes. 2005;54(10):2852–2858. doi: 10.2337/diabetes.54.10.2852. [DOI] [PMC free article] [PubMed] [Google Scholar]
- 47.Glynn MW, McAllister AK. Immunocytochemistry and quantification of protein colocalization in cultured neurons. Nat Protoc. 2006;1(3):1287–1296. doi: 10.1038/nprot.2006.220. [DOI] [PubMed] [Google Scholar]
- 48.Lin YW, Jia T, Weinsoft AM, Shyng SL. Stabilization of the Activity of ATP-sensitive Potassium Channels by Ion Pairs Formed between Adjacent Kir6.2 Subunits. J Gen Physiol. 2003;122(2):225–237. doi: 10.1085/jgp.200308822. [DOI] [PMC free article] [PubMed] [Google Scholar]
Associated Data
This section collects any data citations, data availability statements, or supplementary materials included in this article.
Supplementary Materials
(A) Representative inside-out patch-clamp recordings from COS cells co-transfected with BTX tag-SUR1 and WT Kir6.2 not pretreated (left) or pretreated for 30min with TRITC-BTX at a concentration used in the imaging experiments (1:200) (right). In both cases, currents were readily inhibited by 1mM ATP, similar to those seen in cells expressing non-tagged channels (48) (not shown). Recordings were made at -50mV in symmetrical K-INT solution as described in Materials and Methods and inward currents are shown as upward deflections. (B) Average current amplitude observed in patches from control and BTX-treated cells. The bar represents the mean±standard error of the mean from 12 (control) or 10 (BTX-treated) cells. There is no statistically significant difference between the two groups by Student's-t test (p > 0.05).
COSm6 cells were labeled with TRITC-BTX at 4°C and chased for 30min at 37°C with the marker FITC-BSA included in the chase media. Cells transfected with WT BTX tag-Kir6.2/ SUR1 displayed punctate TRITC-BTX staining (left panel, red, scale bar 10 μm) which colocalized with the fluid phase marker FITC-BSA (middle panel, green) and thus confirming the intracellular nature of the channel staining (see merged picture and inset, right panel). Channel behavior was similar to WT BTX tag-SUR1/ Kir6.2 channels.
All movies were compiled with MetaMorph software and play at 5 frames/sec.
Movie S1. Movie corresponds to Figure 1A. A COS cell expressing BTX tag-SUR1 and WT Kir6.2 shows endocytosis of channels over a 30min time interval. Images were taken every 15 sec for 30min (scale bar 5 μm).
Movie S2. Movie of INS-1 cells expressing BTX tag-SUR1 and WT Kir6.2 corresponding to Figure 1B. Images were taken every 15 sec for 30min (scale bar 5 μm). In both cases (Movie S1 and 1B) internalization of KATP can be visually followed over time as fluorescent puncta budding from the plasma membrane and migrating to the cytosol.
Movie S3. Movie of a COS cell expressing SUR1 WT and BTX tag-Kir6.2. Images were taken every 15 sec for 15min. The BTX tag can be fused to either KATP channel subunit with no difference in internalization behavior (compare to Movie S1, scale bar 10 μm).
Movie S4. 30min movie of COS cells expressing BTX tag-SUR1 and Kir6.2 Y330C corresponding to Figure 2A. Internalization of BTX tag-SUR1/ Kir6.2 Y330C is similar to wild type channels (scale bar 5 μm).
Movie S5. Movie of COS cells expressing BTX tag-SUR1RKR→AAA only. SUR1 internalizes independently from Kir6.2 when the ER-retention signal is mutated (30min movie, scale bar 10 μm). This movie corresponds to figure 6A, top as control for the dynasore treated cell.
Movie S6. Movie of COS cells expressing BTX tag-SUR1RKR→AAA with the drug dynasore in the imaging media. SUR1RKR→AAA internalization is greatly reduced when dynasore, an inhibitor of dynamin was present (30min movie, scale bar 10 μm).