Abstract
The 14-3-3 proteins are a set of seven highly conserved proteins that have recently been implicated in having a role in human tumorigenesis. However, the mechanism by which 14-3-3 proteins may act in this capacity is not well understood. In this study, we examined the expression of one of the 14-3-3 family members, 14-3-3σ since it was shown previously to be aberrantly altered in human tumors. Using quantitative rtPCR and immunohistochemistry, we found that the expression levels of 14-3-3σ were elevated in the majority of human non-small cell lung cancers (NSCLC) we examined. Surprisingly, we found that the 14-3-3σ gene was hypomethylated in lung tumors relative to normal lung tissue suggesting that decreased DNA methylation resulted in increased expression of 14-3-3σ in NSCLC. We also determined the gene copy number for 14-3-3σ in tumor samples and found no significant correlation with elevated mRNA expression. And also no mutations were found in 14-3-3σ gene. Overall, our data suggests that misregulated expression of 14-3-3σ gene may be due to altered methylation status.
Keywords: 14-3-3 expression, Stratifin, Non-small cell lung cancer, Methylation, Tumorigenesis
INTRODUCTION
The family of 14-3-3 proteins comprises of seven isoforms each of which identified by a Greek letter (14-3-3β, γ, ε, η, σ, τ and ζ). They are expressed in a large variety of different tissues and can interact with other cellular proteins by binding to a consensus motif (RSXpS/TXP) that frequently contains a phosphoserine or phosphothreonine (Morrison 2009). Of these isoforms, 14-3-3σ is perhaps the best known and most studied. Its expression is restricted to cells of epithelial origin, in particular stratified epithelia, which led to the designation stratifin (SFN) (Leffers, et al. 1993). In a previous study from our laboratory, we found that 14-3-3σ can suppress transformation induced by ras in NIH3T3 cells (Radhakrishnan and Martinez 2010). It is also the downstream target of p53, consistent with the notion that it has tumor suppressor activity (Hermeking, et al. 1997). Moreover, down regulation of 14-3-3σ was reported in several types of carcinomas including breast cancers (Moreira, et al. 2005), cervical cancers (Sano, et al. 2004), ovarian cancers (Akahira, et al. 2004) and bladder transitional cell carcinomas (Moreira, et al. 2004). In some tissues, there are variations in the expression level of 14-3-3σ between cell types within the tissues. For example, there are two prominent types of thyroid carcinoma, papillary carcinoma (PC) and follicular carcinoma (FC) arising from thyroid follicular cells, which have different biological characteristics. Studies from these tumors showed that 14-3-3σ protein is frequently elevated in PC, but not in FC (Ito, et al. 2003).
There is an increasing body of evidence indicating that 14-3-3σ expression is increased in a variety of malignant tumors. For example, increased expression is observed in tumors such as Scirrhous-type gastric carcinomas (Kuramitsu, et al. 2010), gastric and colorectal cancers (Tanaka, et al. 2004), pancreatic cancers (Okada, et al. 2006; Rodriguez, et al. 2005), lung cancers (Qi, et al. 2005) and papillary carcinomas (Ito, et al. 2003). The expression of 14-3-3σ is also significantly associated with advanced tumor stages in gastric cancers (Muhlmann, et al. 2010). 75% of the tumors originating from urological and gynecological tissues also showed elevated levels of 14-3-3σ (Mhawech 2005).
Numerous studies have shown that hypermethylation of promoter CpG islands correlate with transcriptional inhibition in cancers. However, Feinberg and Vogelstein (Feinberg and Vogelstein 1983) observed hypomethylation of human growth hormone, α-globin and γ-globin genes in cancers although they are hypermethylated in normal cells. After this initial observation, several studies have shown hypomethylation and overexpression of certain genes in several cancers (Cho, et al. 2001; Nakayama, et al. 1998; Rosty, et al. 2002). It has been reported that frequent CpG methylation on 14-3-3σ promoter occurs in several cancers including breast cancer (Ferguson, et al. 2000; Suzuki, et al. 2000; Umbricht, et al. 2001), hepatocellular carcinoma (Iwata, et al. 2000), ovarian (Kaneuchi, et al. 2004) and prostate cancer (Lodygin, et al. 2004), with subsequent gene down regulation. Hence, the alterations of 14-3-3σ expression in several tumors with the extent of 14-3-3σ gene promoter methylation might be an important event for tumorigenesis.
The purpose of the present study was to determine the frequency of 14-3-3σ methylation in NSCLC and to correlate this event with the level of 14-3-3σ gene expression. Here we show that the 14-3-3σ gene is highly elevated in NSCLC at the level of both mRNA and protein and that promoter hypomethylation was significantly associated with increased mRNA in non-small cell lung cancers. These findings suggest that hypomethylation is an important mechanism of 14-3-3σ expression in NSCLC and exhibits tissue specific promoter methylation.
MATERIALS & METHODS
Frozen and paraffin embedded tissues of normal and non-small cell lung tumor tissues were obtained from Cooperative Human Tissue Network, Vanderbilt University Medical Center (Nashville, TN). Samples from 49 patients diagnosed with either Adenocarcinoma or Squamous cell carcinoma were selected based on the tumor type and percentage of tumor cell content (at least 70%) and also 23 normal lung tissues were taken in to the current study. The protocol was approved by the human research committee of University of Arizona.
Real-Time PCR quantitation of mRNA expression for 14-3-3σ
Quantitative real-time PCR was performed to determine gene expression levels in a panel of 49 non-small cell lung carcinomas and 23 normal lung tissues. Primers were designed for 14-3-3σ and GAPDH to test the performance in quantitative real-time PCR, and specific PCR products without detectable primer dimers were selected for analysis. The primers for 14-3-3σ were, forward 5′-GGATCCCACTCTTCTTGCAG-3′ and reverse 5′-CTGTCCAGTTCTCAGCCACA-3′. For GAPDH were, forward 5′-AGGGCCCTGACAACTCTTTT-3′ and reverse 5′-AGGGGTCTACATGGCAACTG-3′. cDNA was synthesized from 2μg of total RNA and used for PCR. PCR was carried out in 50μl reaction mixture containing 25μl of SYBR Green qPCR SuperMix (Invitrogen, USA), 1.5μl of 10μM each forward and reverse primer, 2μl of cDNA and water to 50μl. Thermal cycling conditions were carried out at 50°C for 2 min, 95°C for 2 min, 40 cycles of 95°C for 30 sec and 58°C for 30 sec using the ABI PRISM 7700 Sequence Detection System. All experiments were repeated three times. Data expressed as relative quantification (−ΔCt) as compared to GAPDH; all statistics were performed with ΔCt values. Fold increase of the target gene 14-3-3σ was calculated by 2ΔΔCt and values above 2 fold were considered as overexpression.
Immunohistochemistry of 14-3-3σ
A monoclonal antibody of mouse origin (Santa Cruz, USA) directed against human 14-3-3 protein served as the primary antibody. Five-micrometer thin sections of formalin-fixed tissues were deparaffinized and dehydrated by sequential immersion in three changes of xylene followed by four changes of graded ethanol concentrations. Sections were then rinsed in distilled water. Endogenous peroxidase activity was quenched by immersion in 0.3% hydrogen peroxide in phosphate-buffered saline (PBS) for 30 min at room temperature and subsequently washed three times in PBS. Tissue sections were then incubated in preheated (90°C) citrate solution diluted in PBS 1:10 for 10 min to facilitate unmasking of antigens. After 30 min of cooling, the slides were rinsed three times in PBS for 10 min per rinse. Nonimmune binding of antiserum was blocked by incubating sections for 30 min at room temperature in PBS containing 4% (1:10 dilution) normal goat serum. After rinsing in PBS, the slides were incubated for 45 min with anti-mouse 14-3-3σ antibody (Santa Cruz, CA) and PBS-washed sections were then incubated for 30 min in an anti-mouse-HRP conjugated antibody and again washed in PBS. Slides were developed for 5 min in a solution of 3,3′-diaminobenzidine (50 mg/250 ml) in PBS supplemented with hydrogen peroxide (three drops of 3%). Final steps consisted of additional rinsing in PBS, counterstaining with hematoxylin, clearing, and mounting. All incubations were carried out at room temperature unless otherwise indicated. Positive controls consisted of formalin-fixed, paraffin-embedded sections of a prostate carcinoma. Negative controls for each case were performed in parallel by substituting normal mouse serum for the primary antibody.
Quantitative real-time PCR for gene amplification
Quantitative real-time PCR (qPCR) was performed with DNA extracted from normal and tumor specimens with TaqMan probes for the detection of PCR amplification product. Briefly, primers and probes were designed to amplify specific PCR products of 14-3-3σ and PI3KR1 genes. The primers for 14-3-3σ gene were, forward 5′-CTGGAGATGGGTGTGTGTGT-3, reverse 5′-GAGAGGAAACATGGTCACACC-3 and probe 5′-6-FAM-CGCCAGTGCAAGACCGAGATTGA-TAMRA-3′. For PI3KR1, forward 5′-AAGTCTTAAGTTTGGGTTGAGTCG-3, reverse 5′-TAATGATTGACCAAGCTTTTATGC-3 and probe 5′-6-FAM-TAATGATTGACCAAGCTTTTATGC-TAMRA-3′, where PI3KR1 was used as a reference gene, as it is unaltered in non-small cell lung cancer (Massion, et al. 2002). PCR amplification was performed in a 25μl reaction volume, under the following conditions: Each real-time qPCR reaction mixture contained 20ng of DNA, 12.5μl of Platinum Quantitative PCR SuperMix-UDG (Invitrogen, USA), 0.75μl of 10μM gene-specific forward and reverse primers, 0.25μl of 10μM fluorescent probe and water to 25μl. Thermal cycling conditions were carried out at 50°C for 2 min, 95°C for 2 min, 40 cycles of 95°C for 30 sec and 58°C for 30 sec using the ABI PRISM 7700 Sequence Detection System. Samples were run on a 2% agarose gel to ensure that only a single amplicon was produced. The PCR was performed in duplicate for each studied sample. The primers were tested to ensure amplification of single discrete bands. Relative quantification using the comparative CT (−ΔCT) method was used for statistical analysis.
DNA Methylation Analysis using MassARRAY
Genomic DNA was extracted from normal tissues (n=12) and lung tumor tissues (n=24) using proteinase K, followed by phenol/chloroform extraction and ethanol precipitation. Sodium bisulfite (NaBS) treated genomic DNA was prepared using EZ Bisulfite DNA Clean-up™ Kit (Zymo Research, Orange, CA). NaBS treated DNA (5ng) was seeded into a region specific PCR reaction incorporating a T7 RNA polymerase sequence as described by the manufacturer (Sequenom, San Diego, CA). Resultant PCR product was then subjected to in-vitro transcription and RNase A cleavage using the MassCLEAVE T-only kit, spotted onto a Spectro CHIP array, and analyzed using the MassARRAY Compact System MALDI-TOF mass spectrometer (Sequenom, San Diego, CA). Each NaBS treated DNA sample was processed in two independent experiments. Data were analyzed using EpiTyper software (Sequenom, San Diego, CA) and the R-script “Analyze Sequenom Function” using methods described previously (Coolen, et al. 2007). Primer sequences were designed in the region of chr1:27,062,586–27,063,118 by EpiDesigner (www.epidesigner.com) and the sequences are, Forward 5′-aggaagagagTGTTGGGTTTGTTGGATAGTTATTT-3 and Reverse 5′-cagtaatacgactcactatagggagaaggctATAAAACCTCCCACCCCATACTAAT-3′.
Statistical analysis
Statistical analysis was performed by Analysis of Variance (ANOVA). The ΔCt values were used for the statistical analysis of gene amplification and mRNA expression in NSCLC. The Tukey’s multiple comparison was used to test the statistical significance between normal and tumor tissues. P value <0.05 was considered as statistically significant.
RESULTS
14-3-3σ mRNA and protein levels are increased in lung tumors
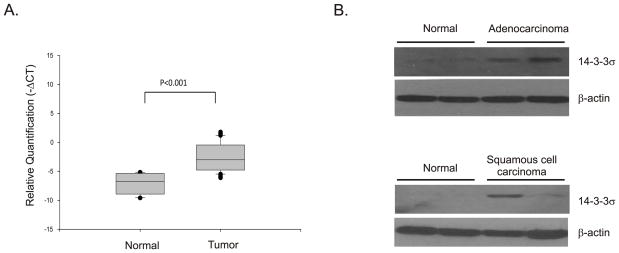
We began by measuring the levels of 14-3-3σ in mRNA extracted from frozen tumor tissues using real time quantitative PCR. 14-3-3σ mRNA was detected in 67% of the lung tumor tissues examined using this method. The 14-3-3σ expression level was elevated in tumor tissues compared with paired normal lung tissue (p<0.001) (Figure 1A). We divided our tumor specimens into Squamous cell carcinoma and Adenocarcinoma and examined 14-3-3σ mRNA expression levels in each tumor type. However, our analysis showed no difference between the two tumor types (data not shown).
Figure 1. Expression of 14-3-3σ is increased in human lung tumors.
(A) Total RNA was extracted from frozen specimens of normal and tumor tissues and the quantity of 14-3-3σ was determined using quantitative RT-PCR. Relative quantification (−ΔCT) values were determined by comparison with GAPDH. The box plots depict relative quantities of 14-3-3σ in normal and tumor tissues. p-values are for comparison of the levels of 14-3-3σ mRNA in tumor specimens with normal tissue and is calculated using ΔCt values. (B) Protein extracts prepared from the same tumor samples as in A were fractionated on SDS-PAGE protein gels, blotted and probed for 14-3-3σ protein using mouse monoclonal 14-3-3σ antibody (sc-100638, Santa Cruz, CA). Typical results for four normal and four tumor specimens are shown. β-actin was used as a loading control.
Because 14-3-3σ is down regulated in tumors of the breast, ovary, endometrium and prostate (Mhawech 2005) and is in contradiction to our studies we sought to confirm our results by examining protein levels. Western blotting conducted with a subset of the tumors confirmed that the levels of 14-3-3σ were elevated (Figure 1B). Hence, the elevated levels of mRNA also resulted in elevated levels of protein.
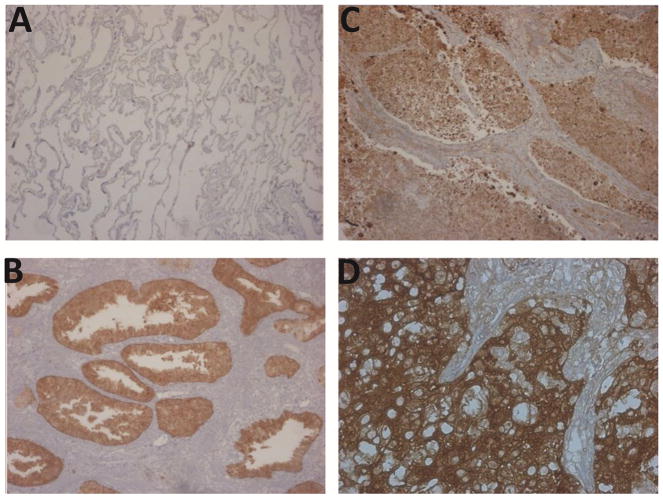
We also examined 14-3-3σ protein levels in tumors using immunohistochemistry on formalin fixed paraffin embedded normal and tumor specimens. As expected, low levels of 14-3-3σ protein were observed in normal lung tissue which showed only weak staining for 14-3-3σ (Figure 2A) compared with a prostate adenocarcinoma specimen which was used as a positive control (Figure 2B). As can be seen in the figure (Figures 2C and 2D), the staining for 14-3-3σ in the lung tumor specimens was strong, similar to the prostate tumor specimen, and was especially intense in the tumor cells. Moreover, the staining occurred in both the cytoplasm and nuclei of these cells. We examined a total of 11 tumors and of these eight (72%) specimens showed strong positive staining. Collectively, our results suggest that 14-3-3σ protein levels are elevated in non-small cell lung cancers.
Figure 2. Immunostaining of 14-3-3σ protein in non small cell lung cancer (NSCLC).
Expression of 14-3-3σ protein in normal human lung and cancer epithelium was analyzed by immunohistochemistry on paraffin-embedded lung tumors using mouse monoclonal 14-3-3σ antibody as described in Methods. Sections were counterstained with hematoxylin. (A) Normal lung tissue, (B) prostate tumor (positive control); (C & D) non-small cell lung cancers. Magnification is 100x.
The 14-3-3σ gene is amplified in NSCLC
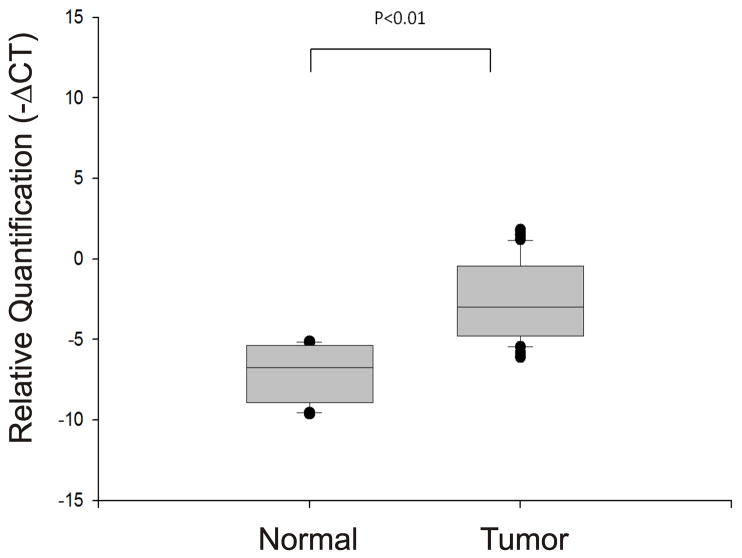
Since our initial data indicated that 14-3-3σ was highly expressed in lung cancers, we next sought to determine whether gene amplification might play a role in its expression. We tested for amplification of the 14-3-3σ gene using quantitative PCR. The relative quantity of 14-3-3σ gene was determined by comparison with the PI3KR1 gene. As can be seen in figure 3 there was a significant (p<0.01) although modest increase in 14-3-3σ gene copy number. Since the gene quantity data was derived using the same set of tumor specimens as was used to derive the expression data, we were able to test whether 14-3-3σ gene copy number correlated with 14-3-3σ mRNA expression. Unexpectedly, linear regression analysis from ΔCt values of mRNA and gene copy number from tumor samples that we selected showed no significant association (Pearson correlation coefficient 0.235; p<0.120) between increased 14-3-3σ DNA copy number and increased 14-3-3σ mRNA level. Hence, the increased levels of 14-3-3σ RNA could not be accounted for by amplification of the 14-3-3σ gene.
Figure 3. The 14-3-3σ gene is amplified in human lung tumors.
Genomic DNA was extracted from normal and tumor tissues and the relative quantity of 14-3-3σ DNA determined using quantitative PCR from equal quantities of DNA. The box plot depicts the relative gene amplification of 14-3-3σ and it is normalized against PI3KR1 (p85alpha regulatory subunit of PI3K) since the latter is unaltered in NSCLCs. The relative quantity of 14-3-3σ DNA (−ΔCt) was used to analyze statistical change between normal and tumor tissues. The p values shown were determined using Tukey’s multiple comparison.
One possible explanation for the altered 14-3-3σ expression levels is that the gene may acquire mutations during tumorigenesis. To test for this possibility we sequenced the entire 14-3-3σ DNA in lung tumors and compared this with the sequence in the NCBI database. However, we found no changes in the sequence of the 14-3-3σ gene in any of the tumors that we examined. Taken together, these data demonstrate that 14-3-3σ gene is not mutated in human lung tumors. Therefore, elevated expression of 14-3-3σ cannot be attributed to either gene amplification or gene mutations.
Increased 14-3-3σ expression correlates with DNA hypomethylation
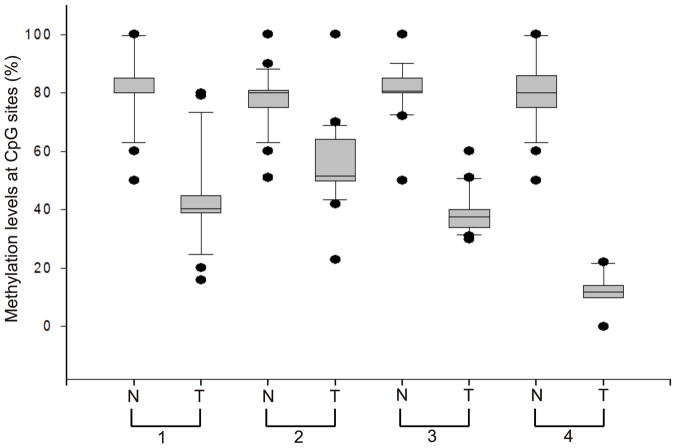
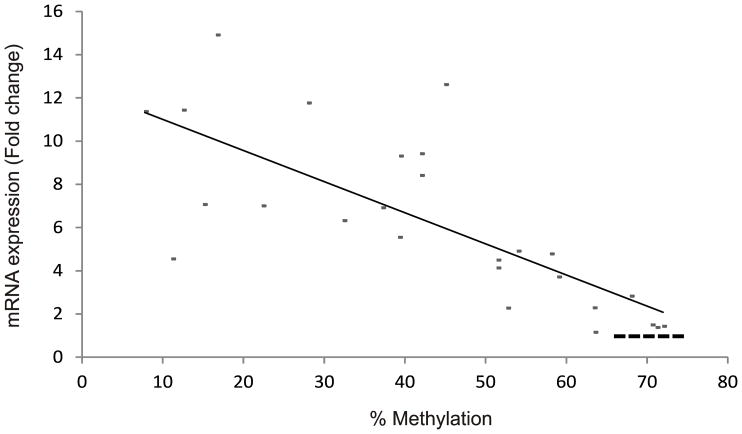
14-3-3σ has been implicated in carcinogenesis and is recognized as a tumor-suppressor gene where loss of expression is proposed to occur by gene silencing because of increased methylation of the promoter region (Umbricht, et al. 2001). The 14-3-3σ gene contains a CpG island within the first and only exon, suggesting that this may be an important regulatory region. Bhatia et al. (Bhatia, et al. 2003) have shown that 14-3-3σ is commonly methylated in normal and malignant lymphoid cells. Consequently, we examined the methylation status of 27 CpG dinucleotides including those located within the CpG island which were mapped in a previous report (Ferguson, et al. 2000). Our study showed hypermethylation of CpG island in 14-3-3σ gene in normal tissues but that it was hypomethylated in our lung tumor specimens having elevated levels of 14-3-3σ RNA (Figure 4 and 5). The extent of the change in methylation at the promoter was quite variable and ranged from 8 to 75%. Methylation in normal tissue ranged from 65 to 75%. There was a universal trend toward reduced methylation in tumors. We then compared the extent of methylation and levels of gene expression (Figure 5) and found a significant correlation between increased expression and reduced methylation in the 14-3-3σ promoter (Spearman’s correlation coefficient 0.551, p<0.01). These results indicate that methylation of the 14-3-3σ promoter is reduced during lung tumorigenesis and suggests that 14-3-3σ mRNA expression may be enhanced by this.
Figure 4. DNA methylation in 14-3-3σ gene in NSCLC.
Human DNA from normal and lung tumor specimens was analyzed for DNA methylation within the 14-3-3σ gene. Sodium bisulfite (NaBS) treated genomic DNA was amplified by PCR and then DNA methylation was determined using MassARRAY. The experiments were repeated twice and the methylation values describe the average percent methylation of the entire amplicon analyzed. A representative figure showing the percentage of methylation at each CpG dinucleotide within the 14-3-3σ promoter in both normal and tumor tissues of four different sets.
Figure 5. Relationship between 14-3-3σ mRNA expression and its promoter methylation in human lung tumors.
The extent of methylation determined for our tumor specimens was compared with the level of 14-3-3σ expression determined for the same set of tumors from Figure 2. The semi log scatter plot graph shows the fold changes (2−ΔΔCt) in the level of 14-3-3σ on the y-axis. Methylation is shown on the x-axis. The linear regression from 24 tumor samples compares percentage of methylation verses levels of 14-3-3σ mRNA. The dotted straight line at the lower right end of the graph indicates the methylation level in normal tissues with mRNA level as one fold.
DISCUSSION
In this study, we have shown that expression of 14-3-3σ is uniformly elevated in human non-small cell lung cancers. The mRNA expression of 14-3-3σ is elevated with a corresponding increase in protein expression in the tumors. This is consistent with our previous report (Qi, et al. 2005). We examined tumors for 14-3-3σ gene amplification which is a common event in tumor formation and is associated with over expression of the amplified gene (Albertson 2006). However, statistical analysis shown no significant correlation with elevated levels of gene expression. Hence, it is unlikely that gene amplification accounts for the up regulation of 14-3-3σ expression.
So what is the mechanism that leads to increased 14-3-3σ expression in lung tumors? One possibility is that changes in methylation of the gene’s promoter may determine expression levels in tumor cells. It is widely accepted that the 14-3-3σ promoter is silenced as a consequence of hypermethylation of the promoter (Ferguson, et al. 2000; Suzuki, et al. 2000; Umbricht, et al. 2001). The downregulation of 14-3-3σ expression through hypermethylation has also been observed in a variety of other human tumors including hepatocellular carcinoma (Iwata, et al. 2000), salivary gland adenoid cystic carcinoma (ACC) and mucoepidermoid carcinoma (Uchida, et al. 2004), and oral squamous cell carcinomas (Gasco, et al. 2002). This is consistent with the proposal that 14-3-3σ functions as a tumor suppressor and is consistent with our observation that 14-3-3σ can suppress the transforming activity of ras and myc in focus formation assays (Radhakrishnan and Martinez 2010). However, we and others have also demonstrated that 14-3-3σ expression is increased in tumors of other tissues (Ito, et al. 2003; Mhawech 2005; Muhlmann, et al. 2010; Okada, et al. 2006; Qi, et al. 2005; Rodriguez, et al. 2005; Tanaka, et al. 2004). One potential explanation for this might be that the 14-3-3σ gene in tumors showing elevated expression levels is mutated. However sequencing the 14-3-3σ gene revealed an absence of mutations indicating that tumors contained increased amounts of the wild-type protein. This raises the question of why is it that the expression of this putative tumor suppressor is tolerated and even enhanced, but repressed in other tumors. Two possibilities suggest themselves. First, it may be that the function of 14-3-3σ is tissue specific. Perhaps the protein functions to suppress proliferation in breast epithelium and thus is silenced in tumors from this tissue, but may promote proliferation in lung tissue resulting in selection of tumor cells with elevated expression in tumors from this tissue. Another possibility is that 14-3-3σ function is altered as a consequence of the proteins that it is available to interact with in breast verses lung tumors. 14-3-3σ and the other 14-3-3 proteins exert their actions through their ability to interact with other cellular proteins. The complement of proteins in tumors is undoubtedly altered during tumorigenesis. Hence, it may be that 14-3-3σ acts differently because of the distinct molecular environment in tumors that originate from different tissues. Hence, the path that leads to neoplastic transformation in breast tissue may be distinct from the path that leads to lung tumors. In support of this it should be noted that methylation of the 14-3-3σ promoter in NSCLC is the reverse of what has been reported for breast.
In conclusion, this study has increased our understanding of the expression of 14-3-3σ protein in lung cancer and suggests possible functional roles for these proteins in lung tumorigenesis. The 14-3-3σ protein has been localized in normal human tissues. Therefore, it is highly likely that 14-3-3σ normally expressed in epithelial cells could become overexpressed during neoplastic transition. Although the function of this protein in lung tumorigenesis is still under debate, our findings may provide new insight into how 14-3-3σ is involved in lung tumorigenesis.
Acknowledgments
We would like to acknowledge the Cooperative Human Tissue Network for providing the lung tumor samples and Dr. Raymond Nagle for lending his expertise in confirming the pathology of our tumor samples. These studies were supported by a grant to JDM from the NIH (CA107510) and a Cancer Center Support Grant to the Arizona Cancer Center (CA02374).
References
- Akahira J, Sugihashi Y, Suzuki T, Ito K, Niikura H, Moriya T, Nitta M, Okamura H, Inoue S, Sasano H, et al. Decreased expression of 14-3-3 sigma is associated with advanced disease in human epithelial ovarian cancer: its correlation with aberrant DNA methylation. Clin Cancer Res. 2004;10(8):2687–93. doi: 10.1158/1078-0432.ccr-03-0510. [DOI] [PubMed] [Google Scholar]
- Albertson DG. Gene amplification in cancer. Trends Genet. 2006;22(8):447–55. doi: 10.1016/j.tig.2006.06.007. [DOI] [PubMed] [Google Scholar]
- Bhatia K, Siraj AK, Hussain A, Bu R, Gutierrez MI. The tumor suppressor gene 14-3-3 sigma is commonly methylated in normal and malignant lymphoid cells. Cancer Epidemiol Biomarkers Prev. 2003;12(2):165–9. [PubMed] [Google Scholar]
- Cho M, Uemura H, Kim SC, Kawada Y, Yoshida K, Hirao Y, Konishi N, Saga S, Yoshikawa K. Hypomethylation of the MN/CA9 promoter and upregulated MN/CA9 expression in human renal cell carcinoma. Br J Cancer. 2001;85(4):563–7. doi: 10.1054/bjoc.2001.1951. [DOI] [PMC free article] [PubMed] [Google Scholar]
- Coolen MW, Statham AL, Gardiner-Garden M, Clark SJ. Genomic profiling of CpG methylation and allelic specificity using quantitative high-throughput mass spectrometry: critical evaluation and improvements. Nucleic Acids Res. 2007;35(18):e119. doi: 10.1093/nar/gkm662. [DOI] [PMC free article] [PubMed] [Google Scholar]
- Feinberg AP, Vogelstein B. Hypomethylation distinguishes genes of some human cancers from their normal counterparts. Nature. 1983;301(5895):89–92. doi: 10.1038/301089a0. [DOI] [PubMed] [Google Scholar]
- Ferguson AT, Evron E, Umbricht CB, Pandita TK, Chan TA, Hermeking H, Marks JR, Lambers AR, Futreal PA, Stampfer MR, et al. High frequency of hypermethylation at the 14-3-3 sigma locus leads to gene silencing in breast cancer. Proc Natl Acad Sci U S A. 2000;97(11):6049–54. doi: 10.1073/pnas.100566997. [DOI] [PMC free article] [PubMed] [Google Scholar]
- Gasco M, Sullivan A, Repellin C, Brooks L, Farrell PJ, Tidy JA, Dunne B, Gusterson B, Evans DJ, Crook T. Coincident inactivation of 14-3-3sigma and p16INK4a is an early event in vulval squamous neoplasia. Oncogene. 2002;21(12):1876–81. doi: 10.1038/sj.onc.1205256. [DOI] [PubMed] [Google Scholar]
- Hermeking H, Lengauer C, Polyak K, He TC, Zhang L, Thiagalingam S, Kinzler KW, Vogelstein B. 14-3-3 sigma is a p53-regulated inhibitor of G2/M progression. Mol Cell. 1997;1(1):3–11. doi: 10.1016/s1097-2765(00)80002-7. [DOI] [PubMed] [Google Scholar]
- Ito Y, Miyoshi E, Uda E, Yoshida H, Uruno T, Takamura Y, Miya A, Kobayashi K, Matsuzuka F, Matsuura N, et al. 14-3-3 sigma possibly plays a constitutive role in papillary carcinoma, but not in follicular tumor of the thyroid. Cancer Lett. 2003;200(2):161–6. doi: 10.1016/s0304-3835(03)00282-9. [DOI] [PubMed] [Google Scholar]
- Iwata N, Yamamoto H, Sasaki S, Itoh F, Suzuki H, Kikuchi T, Kaneto H, Iku S, Ozeki I, Karino Y, et al. Frequent hypermethylation of CpG islands and loss of expression of the 14-3-3 sigma gene in human hepatocellular carcinoma. Oncogene. 2000;19(46):5298–302. doi: 10.1038/sj.onc.1203898. [DOI] [PubMed] [Google Scholar]
- Kaneuchi M, Sasaki M, Tanaka Y, Shiina H, Verma M, Ebina Y, Nomura E, Yamamoto R, Sakuragi N, Dahiya R. Expression and methylation status of 14-3-3 sigma gene can characterize the different histological features of ovarian cancer. Biochem Biophys Res Commun. 2004;316(4):1156–62. doi: 10.1016/j.bbrc.2004.02.171. [DOI] [PubMed] [Google Scholar]
- Kuramitsu Y, Baron B, Yoshino S, Zhang X, Tanaka T, Yashiro M, Hirakawa K, Oka M, Nakamura K. Proteomic differential display analysis shows up-regulation of 14-3-3 sigma protein in human scirrhous-type gastric carcinoma cells. Anticancer Res. 2010;30(11):4459–65. [PubMed] [Google Scholar]
- Leffers H, Madsen P, Rasmussen HH, Honore B, Andersen AH, Walbum E, Vandekerckhove J, Celis JE. Molecular cloning and expression of the transformation sensitive epithelial marker stratifin. A member of a protein family that has been involved in the protein kinase C signalling pathway. J Mol Biol. 1993;231(4):982–98. doi: 10.1006/jmbi.1993.1346. [DOI] [PubMed] [Google Scholar]
- Lodygin D, Diebold J, Hermeking H. Prostate cancer is characterized by epigenetic silencing of 14-3-3sigma expression. Oncogene. 2004;23(56):9034–41. doi: 10.1038/sj.onc.1208004. [DOI] [PubMed] [Google Scholar]
- Massion PP, Kuo WL, Stokoe D, Olshen AB, Treseler PA, Chin K, Chen C, Polikoff D, Jain AN, Pinkel D, et al. Genomic copy number analysis of non-small cell lung cancer using array comparative genomic hybridization: implications of the phosphatidylinositol 3-kinase pathway. Cancer Res. 2002;62(13):3636–40. [PubMed] [Google Scholar]
- Mhawech P. 14-3-3 proteins--an update. Cell Res. 2005;15(4):228–36. doi: 10.1038/sj.cr.7290291. [DOI] [PubMed] [Google Scholar]
- Moreira JM, Gromov P, Celis JE. Expression of the tumor suppressor protein 14-3-3 sigma is down-regulated in invasive transitional cell carcinomas of the urinary bladder undergoing epithelial-to-mesenchymal transition. Mol Cell Proteomics. 2004;3(4):410–9. doi: 10.1074/mcp.M300134-MCP200. [DOI] [PubMed] [Google Scholar]
- Moreira JM, Ohlsson G, Rank FE, Celis JE. Down-regulation of the tumor suppressor protein 14-3-3sigma is a sporadic event in cancer of the breast. Mol Cell Proteomics. 2005;4(4):555–69. doi: 10.1074/mcp.M400205-MCP200. [DOI] [PubMed] [Google Scholar]
- Morrison DK. The 14-3-3 proteins: integrators of diverse signaling cues that impact cell fate and cancer development. Trends Cell Biol. 2009;19(1):16–23. doi: 10.1016/j.tcb.2008.10.003. [DOI] [PMC free article] [PubMed] [Google Scholar]
- Muhlmann G, Ofner D, Zitt M, Muller HM, Maier H, Moser P, Schmid KW, Amberger A. 14-3-3 sigma and p53 expression in gastric cancer and its clinical applications. Dis Markers. 2010;29(1):21–9. doi: 10.3233/DMA-2010-0722. [DOI] [PMC free article] [PubMed] [Google Scholar]
- Nakayama M, Wada M, Harada T, Nagayama J, Kusaba H, Ohshima K, Kozuru M, Komatsu H, Ueda R, Kuwano M. Hypomethylation status of CpG sites at the promoter region and overexpression of the human MDR1 gene in acute myeloid leukemias. Blood. 1998;92(11):4296–307. [PubMed] [Google Scholar]
- Okada T, Masuda N, Fukai Y, Shimura T, Nishida Y, Hosouchi Y, Kashiwabara K, Nakajima T, Kuwano H. Immunohistochemical expression of 14-3-3 sigma protein in intraductal papillary-mucinous tumor and invasive ductal carcinoma of the pancreas. Anticancer Res. 2006;26(4B):3105–10. [PubMed] [Google Scholar]
- Qi W, Liu X, Qiao D, Martinez JD. Isoform-specific expression of 14-3-3 proteins in human lung cancer tissues. Int J Cancer. 2005;113(3):359–63. doi: 10.1002/ijc.20492. [DOI] [PubMed] [Google Scholar]
- Radhakrishnan VM, Martinez JD. 14-3-3gamma induces oncogenic transformation by stimulating MAP kinase and PI3K signaling. PLoS One. 2010;5(7):e11433. doi: 10.1371/journal.pone.0011433. [DOI] [PMC free article] [PubMed] [Google Scholar]
- Rodriguez JA, Li M, Yao Q, Chen C, Fisher WE. Gene overexpression in pancreatic adenocarcinoma: diagnostic and therapeutic implications. World J Surg. 2005;29(3):297–305. doi: 10.1007/s00268-004-7843-0. [DOI] [PubMed] [Google Scholar]
- Rosty C, Ueki T, Argani P, Jansen M, Yeo CJ, Cameron JL, Hruban RH, Goggins M. Overexpression of S100A4 in pancreatic ductal adenocarcinomas is associated with poor differentiation and DNA hypomethylation. Am J Pathol. 2002;160(1):45–50. doi: 10.1016/S0002-9440(10)64347-7. [DOI] [PMC free article] [PubMed] [Google Scholar]
- Sano T, Shimooka H, Weixa P, Segawa A, Jian Z, Motegi A, Nakayama H, Oyama T, Nakajima T. Immunohistochemical expression of 14-3-3 sigma protein in various histological subtypes of uterine cervical cancers. Pathol Int. 2004;54(10):743–50. doi: 10.1111/j.1440-1827.2004.01747.x. [DOI] [PubMed] [Google Scholar]
- Suzuki H, Itoh F, Toyota M, Kikuchi T, Kakiuchi H, Imai K. Inactivation of the 14-3-3 sigma gene is associated with 5’ CpG island hypermethylation in human cancers. Cancer Res. 2000;60(16):4353–7. [PubMed] [Google Scholar]
- Tanaka K, Hatada T, Kobayashi M, Mohri Y, Tonouchi H, Miki C, Nobori T, Kusunoki M. The clinical implication of 14-3-3 sigma expression in primary gastrointestinal malignancy. Int J Oncol. 2004;25(6):1591–7. [PubMed] [Google Scholar]
- Uchida D, Begum NM, Almofti A, Kawamata H, Yoshida H, Sato M. Frequent downregulation of 14-3-3 sigma protein and hypermethylation of 14-3-3 sigma gene in salivary gland adenoid cystic carcinoma. Br J Cancer. 2004;91(6):1131–8. doi: 10.1038/sj.bjc.6602004. [DOI] [PMC free article] [PubMed] [Google Scholar]
- Umbricht CB, Evron E, Gabrielson E, Ferguson A, Marks J, Sukumar S. Hypermethylation of 14-3-3 sigma (stratifin) is an early event in breast cancer. Oncogene. 2001;20(26):3348–53. doi: 10.1038/sj.onc.1204438. [DOI] [PubMed] [Google Scholar]


