Abstract
High-quality magnetic resonance imaging (MRI) requires precise control of the transmit radio-frequency field. In parallel excitation applications such as transmit SENSE, high RF power linearity is essential to cancel aliased excitations. In widely-employed class AB power amplifiers, gain compression, cross-over distortion, memory effects, and thermal drift all distort the RF field modulation and can degrade image quality. Cartesian feedback (CF) linearization can mitigate these effects in MRI, if the quadrature mismatch and DC offset imperfections inherent in the architecture can be minimized.
In this paper, we present a modified Cartesian feedback technique called “frequency-offset Cartesian feedback” (FOCF) that significantly reduces these problems. In the FOCF architecture, the feedback control is performed at a low intermediate frequency rather than DC, so that quadrature ghosts and DC errors are shifted outside the control bandwidth. FOCF linearization is demonstrated with a variety of typical MRI pulses. Simulation of the magnetization obtained with the Bloch equation demonstrates that high-fidelity RF reproduction can be obtained even with inexpensive class AB amplifiers. Finally, the enhanced RF fidelity of FOCF over CF is demonstrated with actual images obtained in a 1.5 T MRI system.
Index Terms: Cartesian feedback, control systems, MRI, linearization, RF power amplifiers
I. Introduction
Accurate control of the radio-frequency (RF) field in Magnetic Resonance Imaging (MRI) is necessary to provide high-quality imaging capabilities.
Precise control can be difficult to achieve, given the recent trends toward higher fields, transmit array technology, and more complex excitation waveforms [1–5].
To ensure linearity, MRI amplifiers typically employ power backoff, resulting in high cost and decreased efficiency. At high frequencies, wavelength effects [6] and increased RF power needs compound these technical challenges: high power components of widely-employed class AB power amplifiers can heat, causing drift of the output impedance, gain and phase, which can ultimately degrade RF pulse fidelity. Along with higher field, accelerated RF excitations employing transmit SENSE [7–10] place significant demands on RF amplifier linearity and envelope bandwidths. These pulses are almost noise-like with high peak to average power levels and become more susceptible to distortion from power amplifier memory effects [11]. If neglected, the RF distortion introduced by the MRI power amplifier can result in degradation of the image quality. Cartesian feedback is a potentially useful technique to deal with this problem. Cartesian feedback was proposed for communication systems in the 1980s by Petrovic [12–13] to reduce distortion in RF power amplifiers, owing to the adaptability of this technique to many modulation schemes. In MRI and NMR, Cartesian feedback was recently adopted by Hoult [14–15], who proposed the technique to control coil-to-coil interactions in transmit arrays. A drawback of Cartesian feedback is, however, its sensitivity to phase or amplitude mismatches and DC offsets in the feedback path. If mismatches and DC-offsets are not carefully minimized— at a cost of substantial engineering effort—they can cause in-band aliasing and leakage in the output spectrum of the power amplifier. In MRI, the aliasing and leakage can create artifacts such as excitation of slice ghosts during RF slice selection.
To address the issue of MRI power amplifier distortion without the drawbacks of classic Cartesian feedback (CF), we have developed frequency-offset Cartesian feedback (FOCF) [16–18]. While classic Cartesian feedback employs matched baseband low-pass error amplifiers centered at DC, the FOCF architecture employs a complex-bandpass (polyphase) error amplifier that shifts the control bandwidth to a low positive intermediate frequency (IF). This enables a significant relaxation of component specifications, and circuit complexity, without impairing the linearization performance of the feedback loop.
In this paper, we present the MRI FOCF transmitter and autocalibration system, and demonstrate key performance attributes with a variety test loads and with MRI double band slice selective imaging sequences.
II. Nature of Amplifier Distortion and Effects in MRI
An ideal amplifier has a linear transfer characteristic, in which the output signal Sout is a scalar multiple of the input signal by gain factor k and time delay τ:
| (1) |
In reality, all practical amplifiers are characterized by amplitude (AM-AM) non-linearity, fAM(), between input and output, by amplitude to phase nonlinearity, fPM(), resulting in AM-PM conversion [19], and by nonlinear phase dispersion with frequency. The combination of these phenomena creates the distorted output signal:
| (2) |
MRI systems have typically used simple look-up table corrections based upon single tone calibrations [20] to correct for these nonlinearities. However, AM-AM, AM-PM and phase dispersion are not immutable but vary with changes in the environment and with the operating frequency of the amplifier. Typical changes that influence the power amplifier behavior are fluctuations in the biasing conditions and temperature. Memory effects, which include dynamic thermal changes in a transistor within a single RF pulse, unintended supply rail modulation, and semiconductor trapping, further complicate the distortion process [21].
In communication systems, power amplifier distortion is usually characterized by metrics such as 1 dB compression testing, two-tone testing, and QAM constellation testing. While these non-linearity measures are still very useful, in MRI, standardized RF pulse analysis by Bloch simulation and imaging can directly quantify slice profile distortion arising from amplifier nonlinearity.
III. Cartesian Feedback
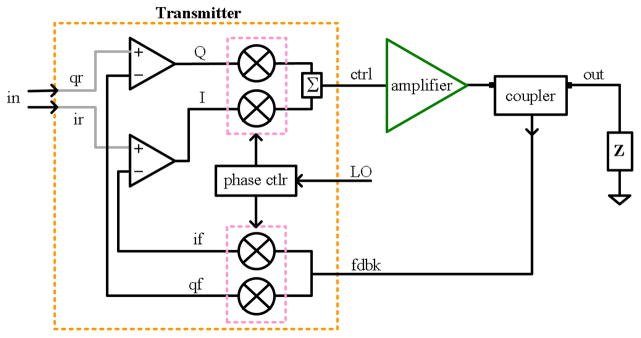
The basic Cartesian feedback architecture, shown in Fig. 1, employs negative feedback control of the in-phase and quadrature signal components. The forward path includes a matched pair of low-pass loop error amplifiers, a quadrature up-conversion mixer, a power amplifier and the load. The feedback path includes a coupler sampling the output, and quadrature down-conversion mixers. The up and down mixers are phase aligned by a local oscillator (LO) phase shifter, to maximize phase margin and loop stability. Under closed loop conditions, the quadrature down-converted feedback components, if and qf, are subtracted from the quadrature baseband reference inputs, ir, and qr. This difference is amplified by the loop error amplifiers, to create the loop control signal, I+jQ, which, after quadrature up-conversion, is the pre-distorted signal necessary to drive and linearise the power amplifier.
Fig. 1.
Basic architecture of the classic Cartesian feedback method.
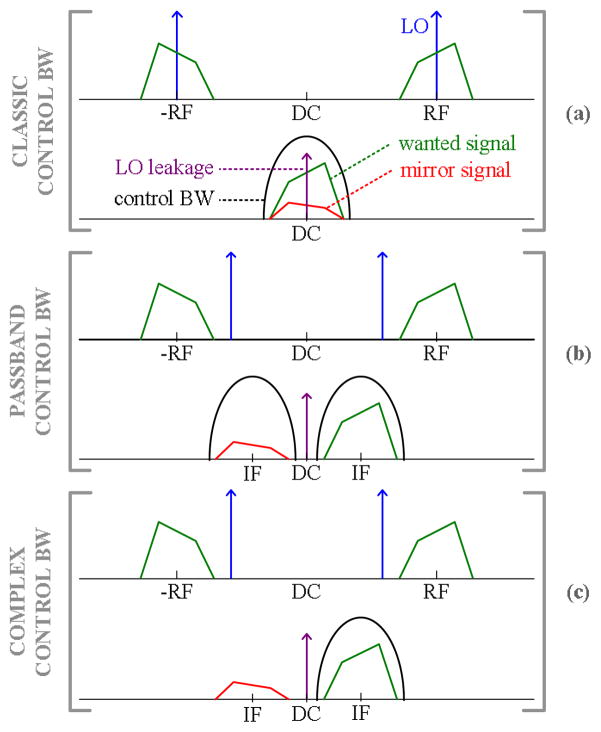
The Cartesian feedback path is really just a quadrature detection stage, a scheme well known to the MRI community for its propensity for quadrature ghosts and DC artifact generation in images. A CF transmitter will be sensitive to feedback path imperfections including mixer non-linearity, DC-offsets, and amplitude and phase matching of the quadrature detection mixers. Up-conversion mixer linearity is not as critical. These feedback spectral errors are diagramed in Fig. 2a. Since the non-ideality responsible for this unwanted behavior is in the feedback path, it will not be compensated by the loop operation once the loop is closed [13]. Consequently, in-band aliasing and LO leakage will occur at the output spectrum of the power amplifier [19], and during slice selection, these effects would excite ghost slices.
Fig. 2.
(a) Classic Cartesian feedback employs quadrature detection of the PA output. Quadrature mismatch ghosts, LO leakage and DC offsets alias into the control band. (b) A low IF bandpass eliminates DC/LO effects but generates two control bands. Quadrature mismatches are still aliased. (c) The FOCF scheme uses a complex bandpass to eliminate leakage and aliasing created by DC-offset and quadrature mismatches.
Traditional CF centers the control bandwidth at DC. A plausible alternative could employ matched bandpass error amplifiers with feedback centered at a low IF as in Fig. 2b. This scheme would reject LO leakage within the control bandwidth, but would still produce aliasing of the quadrature mirror signals. Even worse, two high gain control bands are generated at positive and negative frequency IF bands. Feedback compensation and closed loop stability would be difficult to achieve.
IV. Frequency-Offset Cartesian Feedback
Frequency-offset Cartesian feedback also centers the control bandwidth at a low IF, but instead uses a complex bandpass difference amplifier. This creates only a single high gain control band centered at the positive IF as in Fig. 2c. Since subtraction and amplification of reference and feedback signals occur selectively at this low positive IF band, DC-offset and quadrature mismatches will be rejected and will not translate into aliasing and leakage at the linearized output spectrum of the power amplifier. The FOCF approach has similarities to a high IF single-sideband variant introduced by Voyce in 1989 [22].
In FOCF, we synthesize a complex bandpass response with active polyphase amplifiers [23–25]. This amplifier asymmetrically cross-couples two low pass differential amplifiers. The polyphase amplifier transfer function H(ω) between complex output (the loop control signal) I+jQ and the complex input (the loop error signal) (ir – if) + j(qr – qf), is:
| (6) |
where K, ωc, and ωo are the peak gain, center frequency, and half width of the baseband signal band, respectively. It is the response of a single pole low pass filter shifted by ωc away from 0 rad/s. Since the coupling from Q-i is the opposite sign of I-q, a quadrature +/− 90 degree phase relationship representing positive or negative input frequencies leads to constructive or destructive interference in the outputs, and enhanced selectivity of positive frequencies.
The classic Cartesian feedback scheme is converted to FOCF by a simple substitution of active polyphase difference amplifiers for the classic matched difference amplifiers. The loop control bandwidth moves away from DC (at baseband) and the local oscillator frequency (at RF), so that the undesired frequencies that would be created by both quadrature errors and DC-offsets are outside this bandwidth. Now, even if quadrature errors and offsets are not stringently minimized, they do not impair the linearization performance within the Cartesian feedback control bandwidth.
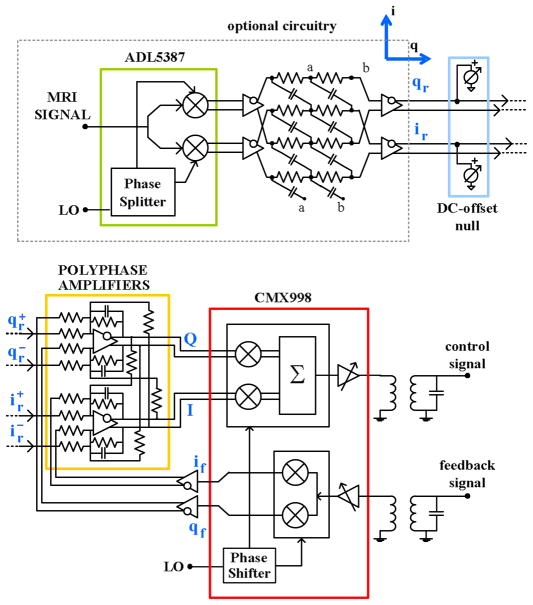
Fig. 3 shows a simplified block-diagram of our prototype frequency-offset Cartesian feedback transmitter based on polyphase loop-error amplifiers. The transmitter includes all the essential blocks to control an external power amplifier (with the sole exception of the coupler that samples the power amplifier output voltage or current). Its main blocks are the polyphase amplifiers, synchronous mixers with phase shifter, and optional image reject circuitry to generate a pair of quadrature differential reference signals (ir, qr) from the MRI small input signal. The image reject stage uses asymmetric polyphase filters in which each RC bank introduces a negative frequency notch at f=−1/2πRC. Digital serial control is provided for: (a) adjusting the loop phase, (b) enabling the up-mixer and down-mixer, and (c) selecting the up-mixer and down-mixer gains. Manual control with on-board trimmers is provided for adjusting the DC-offsets. Additional circuitry and details of this implementation are described in [18].
Fig. 3.
Simplified schematic of frequency-offset Cartesian feedback transmitter with optional image reject down-converter.
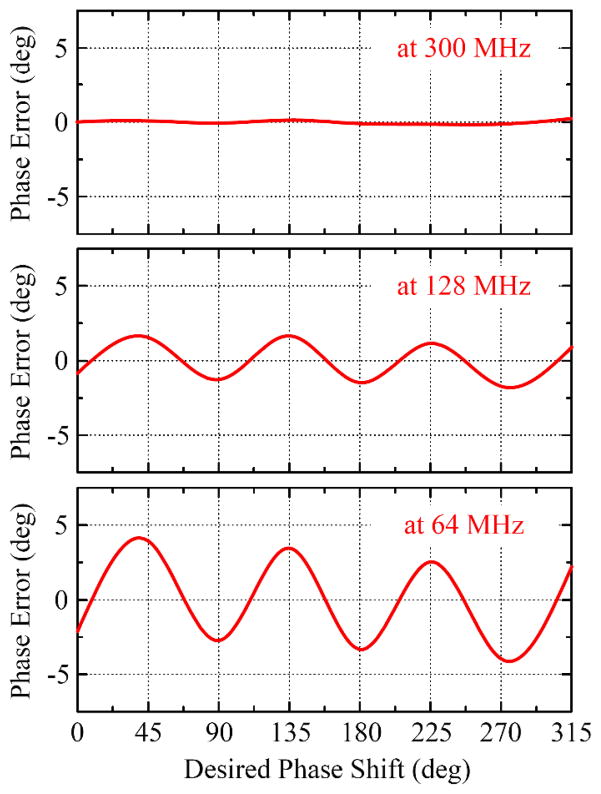
As shown in Fig. 3, the mixers and phase shifter of the transmitter are those of the CMX998 (CML Microcircuits, Winston-Salem, NC). The circuit nominally covers the RF range from 100 MHz to 1 GHz. On the low-side of the range, this specification was initially a concern since it could have prevented the use of the transmitter with RF power amplifiers for 1.5 T MRI systems; however, using the EV998 evaluation board provided by the same manufacturer, we have demonstrated that the circuit can operate down to 40 MHz. In particular, the circuit guarantees good control of the system phase margin, which ensures stability, near 64 MHz. As shown in Fig. 4, the measured phase shift deviation from the programmed value is less than ± 4º. Within the nominal operating range, this deviation is much lower and equal to ± 2º at 128 MHz and ± 0.2º at 300 MHz.
Fig. 4.
The phase shift deviation from the programmed LO phase shift value was under 4 degrees at 64 MHz, 2 degrees at 128 MHz, and 0.2 degrees at 300 MHz
An essential feature of our FOCF system is that it contains a LO reference oscillator whose output controls both the reference down-conversion circuitry and the CMX998 mixers, to ensure phase-locking between reference and output signals.
V. Methods
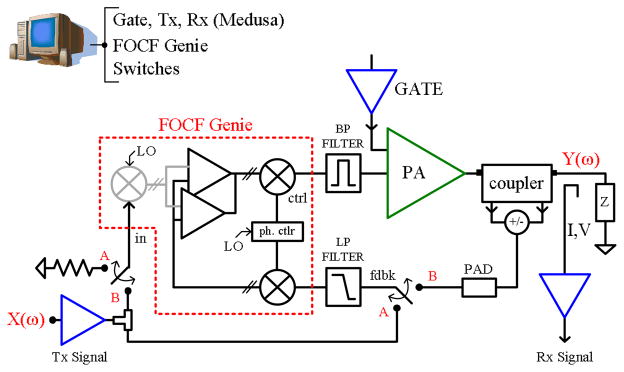
To demonstrate linearization of RF power amplifiers for MRI, we used the frequency-offset Cartesian feedback transmitter to implement the auto-calibration system architecture schematically shown in Fig. 5.
Fig. 5.
The frequency-offset Cartesian feedback system incorporates RF SPDT switches to inject a test signal and perform an autocalibration.
In addition to the transmitter and the power amplifier (loaded by a transmit coil or dummy load), the frequency-offset Cartesian feedback system includes a bandpass filter, a coupler with attenuators and combiners (optional), and a Medusa console [26] developed in our lab.
The system also includes an automated RF switching network for the autocalibration of the loop, that is, for the automatic measurement and setting of the phase shift that guarantees the stability of the closed loop system. At the beginning of each experiment, the system is in open-loop configuration and the bulk phase shift is measured and then negated by controlling the phase shift circuitry of the CMX998 via a software interface. After this operation, the RF switches toggle the system from the open-loop to the closed-loop configuration and the system works stably.
A bandpass filter (model SBP-60+ by Minicircuits) is added at the input of the power amplifiers to eliminate the multiple harmonic outputs created by the up-mixers since these are easily amplified by our wideband power amplifier. The feedback input also includes a low pass filter to reject noise and signal aliasing by the downmixers. Without the filters, the signals replicated by the mixer harmonics of the LO would be amplified and could create multi-frequency feedback paths, with potential risk of instability.
The transmission line forward voltage, Vf, or reflected voltage, Vr, or both are sampled by a Werlatone C7149 high-power (200 W), wide bandwidth (60–600 MHz) bidirectional coupler with attenuation coefficient equal to 20±0.5 dB over the entire range. As an alternative, we also constructed a custom coupler [27] that approximately samples total transmission line voltage, Vo, and current, Io. This latter device, based upon a Bruene coupler, has a coupling coefficient of approximately −40 dB at 64 MHz. The relationship between the electrical variables provided by the two couplers is described by:
| (7) |
| (8) |
In testing, we use either a power 50Ω dummy load, or a transmit only surface coil with an integrated 1:1 transformer current sensor in the resonant loop [28]. Finally, VAT-series attenuator pads (by Minicircuits) ranging from −3dB to −30dB are placed in series with the coupler outputs, and 0 or 180 degree combiners (ZFSC-2-1+, ZFSCJ-2-1 by Minicircuits) create a feedback signal that is the sum (or, difference) of the coupler’s outputs Vf+/−Vr.
A Medusa console is built from an extensible set of intelligent RF and gradient modules, including local synchronization logic, a Direct Memory Access (DMA) engine, and a 2-megabyte waveform buffer, which provide the core functionality required by MRI. While developed for parallel imaging applications, such as a vector modulated transmit array system [26], Medusa provides an RF reference signal to the transmitter, coherent reception and analysis of the feedback signal prior to the CMX998 down-mixer, synchronous gating of the power amplifier and control of the RF switches to toggle the system configuration between open-and closed-loop. Medusa can be controlled entirely via PC, using a MatLab (Mathworks, Natick, MA) interface.
A. Loop Analysis
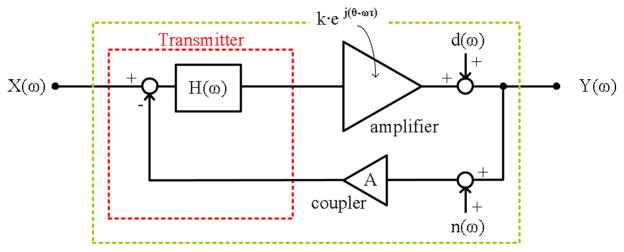
As in the case of any other negative feedback method, the analysis of the frequency-offset Cartesian feedback loop starts with a calculation of the loop gain. For analysis purposes, the quadrature modulators and demodulators can be assumed to be ideal, and frequency conversion allows the loop gain analysis to be referred to the low-IF range. Any distortion can be considered as an additive error. Moreover, the mixer harmonics and image aliasing can be considered as additive errors. With this assumption, the forward gain of the loop is comprised of the gain in the low-frequency error amplifiers, H(ω), the gain and group delay at the RF frequency of the power amplifier, ke−jωτ, and a loop phase rotation, ejθ. The feedback gain consists of only the attenuation A of the coupler, as well as of combiners and any added attenuator pads; A is obtained with passive components and thus is usually constant over a wide bandwidth and within the down-mixer input limits. These essential blocks of the FOCF loop are shown in Fig. 6.
Fig. 6.
Loop gain blocks of FOCF system.
The loop gain, which ultimately controls the level of linearization of the RF power amplifier, is thus,
| (9) |
and the output control variable is
| (10) |
where X(ω) is the reference input, d(ω) is noise and distortion in the forward path, and n(ω) is noise and distortion in the reverse path.
If the conditions for stability of the loop are met and Ak|H(ω)| is much greater than unity, then
| (11) |
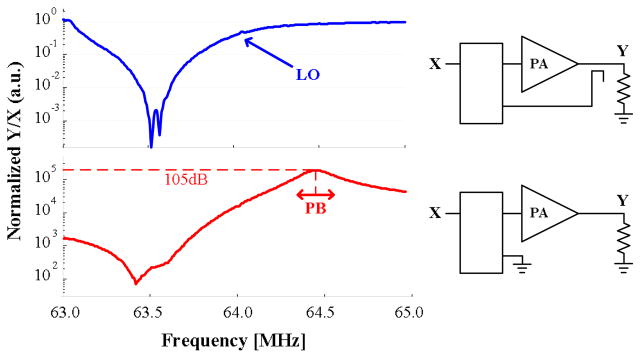
In the closed-loop system, the amplification of the reference input X(ω) to the output Y(ω) is determined by the total feedback attenuation only. Fig. 7 shows the normalized gain between input X(ω) and output Y(ω) of our FOCF system in both open-loop (i.e., when the feedback input is disconnected) and closed-loop configuration. As can be seen, the closed-loop amplification is a constant value determined by the wideband coupler and feedback attenuators only. The two complex notches at 63.5 MHz are synthesized by the image reject mixer that generates the pair of quadrature reference signals (ir, qr) from the MRI signal X(ω); these notches eliminate the negative frequencies which are opposite the IF control band frequencies and generated by the ADL5387 down-converter.
Fig. 7.
Gain (Y/X) of the frequency-offset Cartesian feedback system in open loop (bottom) and closed-loop (top) configurations. The two complex notches at 63.5 MHz are synthesized by the passive polyphase filter following the down-converter of the reference generation circuitry, to enhance the ability of the circuitry to reject undesired image components opposite the control frequency band.
The noise and distortion d(ω) produced by the forward path blocks (including the non-linear power amplifier and mixers) are reduced by a factor equal to the loop gain. The noise and distortion n(ω) produced by the blocks in the feedback path, instead, directly corrupt the output of the closed system. For this reason, minimizing any source of noise and distortion in the feedback path is extremely important.
For the closed loop transmission to be determined by the coupler coefficient only, the conditions for stability of the loop must be met. As in the classic Cartesian feedback system, the conditions for stability are as follows: the phase adjuster must be set to cancel any constant phase shift (phase rotation) around the loop (i.e., force θ equal to 0) and the loop phase margin, pm, should be at least 45º. The phase margin is the difference between the phase of G(ω) and 180º (or 180º) at the frequency ω=ωpm where the loop gain drops to unity. In a frequency-offset Cartesian feedback system, the separation between ωpm and ωc (the center frequency of the polyphase complex band) is thus the minimum desired half-width of the control bandwidth. The contributions (and limitations) to the loop gain of the frequency-offset Cartesian feedback system are shown in Table 1 for a variety of gain settings in our tests. With a polyphase gain of about 70V/V, the system was characterized by a loop gain magnitude in the range of 10 (17 dB below 70) to 20 (11 dB below 70), and with stable control bandwidth of 50 kHz to 100 kHz.
Table I.
Gain and Max In/Out of the Loop Main Components
| Component | Gain [dB] | Max Input [dBm] | Max Output [dBm] |
|---|---|---|---|
| Polyphase Amp. | 36(1) | - - | 13.5 |
| Up-Mixer | −32 to −2 | +4 | +0(2) |
| Down-Mixer | −5 to +24 | +7(3) | +4 |
| BP Filter | −3 | - - | - - |
| Power Amp. | +60 | - - | +53 |
| Coupler | −40 to −20 | - - | - - |
| Combiner | −3 | - - | - - |
| Pad | −40 to −10 | - - | - - |
Gain, maximum input, and maximum output values of the main components of the frequency-offset Cartesian feedback system shown in Fig. 6. The limited input/output power capabilities of the mixers made high values of feedback attenuation necessary, which was obtained with the use of pads in series with the coupler. Notes:
Peak gain at the center of the control bandwidth;
Includes the on-board filters for matching and D-to-S conversion;
Valid at minimum available gain (−5 dB). Typical operating settings: gain 0±3 dB, maximum input +2±3 dBm.
VI. Results
We have demonstrated the ability to linearize RF power amplifiers for MRI in a series of experiments. Our first experiments demonstrate that AM-AM, and AM-PM distortion are substantially reduced, both in the case of controlling the power amplifier output voltage and in the case of controlling the coil current directly. Then, we demonstrate significantly improved amplitude and phase fidelity for sinc pulses and for wide bandwidth spatial saturation VSS pulses [29] for use in MR imaging. Using the Bloch equations, we then show how the improved pulse fidelity translates to a substantially improved magnetization profile. Finally, we performed experiments on a GE 1.5T Signa MRI to demonstrate the effect of the linearization enhancement on the actual image. Imaging was performed with the FOCF and classic CF configurations to demonstrate circuit artifact elimination by FOCF.
A. Reduced AM-AM and AM-PM Distortion
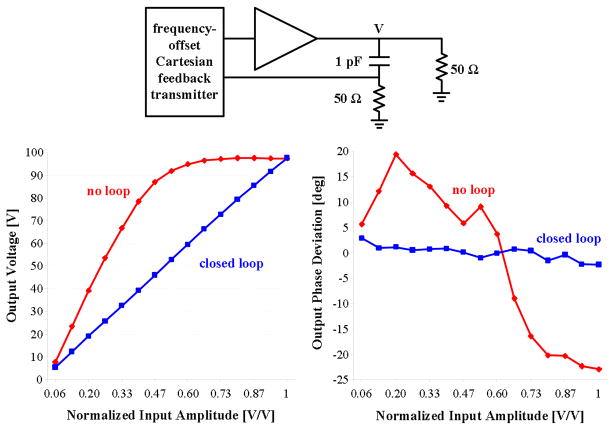
For the first fundamental test, we characterized the reduction in AM-AM, and AM-PM distortion of an RF power amplifier when the feedback variable was a sample of the total voltage output, Vo, obtained with our custom-made coupler. In this experiment, the load to the 200 W, 60 dB power amplifier was a 50 Ω dummy load; we drove the reference input of the transmitter with a sinusoid of fixed frequency and increasing amplitude.
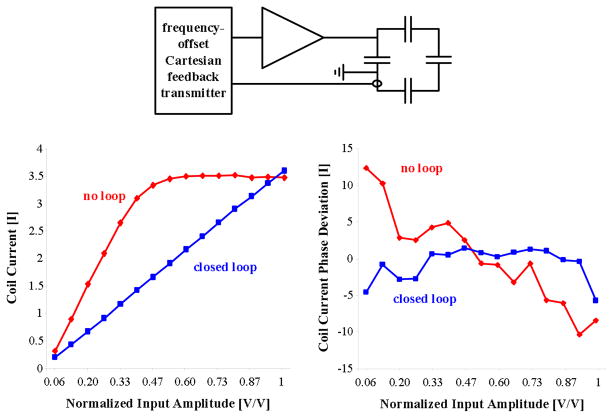
Fig. 8 compares the amplitude and phase distortion obtained with the power amplifier driven directly and with the feedback system in place, up to the regime of full compression of the power amplifier. Both amplitude and phase distortion are reduced by about 23 dB (7%). This improvement is equal to the loop gain magnitude of the system in the configuration used for this particular experiment.
Fig. 8.
Amplitude and phase distortion without and with control. The RF feedback signal is a sample of the power amplifier output voltage.
The test was repeated using a loaded transmit-only surface coil with feedback provided by the coil current transducer (Fig. 9). The maximum current that could be driven in the coil by the power amplifier was about 3.5 A. After linearization, the amplitude distortion is reduced by about 20 dB (i.e. the AM-AM, AM-PM distortion after linearization is about 10% the original amplifier distortion). Also, the phase distortion is reduced by the same amount, but only within 20% and 90% of the output range: the plot of phase distortion shows a reduced linearization performance near the minimum and maximum limits of the power amplifier operating range.
Fig. 9.
Amplitude and phase distortion without and with control. The RF feedback signal is a sample of the coil current in the resonant loop.
This result highlights the issue of using a tuned versus broadband load with Cartesian feedback. The dummy load presented a constant impedance over the entire feedback bandwidth so that the +/−20 degree swing in amplifier phase with power level was the sole contributor to phase margin degradation. In contrast, the transmit coil impedance closely matches a parallel LCR load, and contributes a variable phase shift over the feedback bandwidth, which further degrades the phase margin of the feedback system. The autocalibration set the fixed loop phase shift and stability conditions for ideal operation in the middle of the output power range. The decrease in phase margin is not sufficient to cause oscillation; however, it appears to impact distortion reduction.
B. Linearization of a Sinc Pulse and VSS Pulse
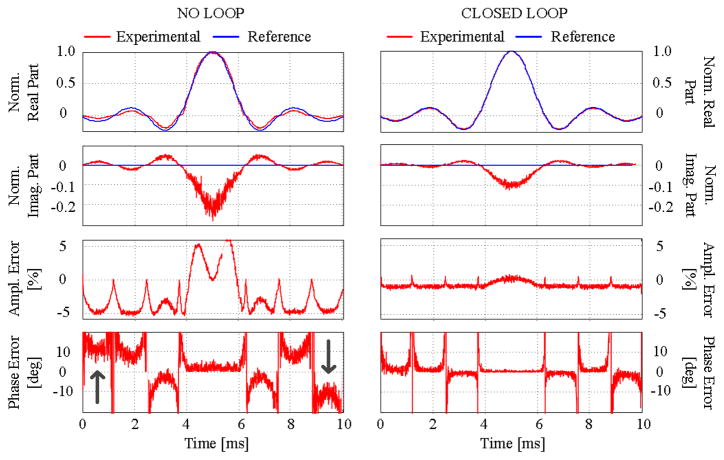
A sinc pulse is a typical MRI RF waveform that performs slice selection when accompanied by a one-dimensional, linear magnetic field gradient. The slice profile should approximate the Fourier transform of a sinc, namely a rectangular profile, if the power amplifier is highly linear. Distortion will create out-of-slice artifacts, reducing the image quality. The two upper panels of Fig. 10 show the real and imaginary parts, respectively, of the measured output sinc pulse produced by only the power amplifier (left) and by the amplifier after FOCF linearization (right). A small phase shift in the RF loopback created the nonzero imaginary parts here. The ideal reference signal is overlaid on both plots. The two lower panels of Fig. 10 show the amplitude and phase distortion before and after linearization
Fig. 10.
Amplitude and phase distortion of a Sinc pulse: comparison between reference signal and measured signal obtained with the power amplifier driven directly (left) and with the same amplifier after addition of the FOCF control loop (right). The first two upper panels show real and imaginary parts of the signal; the bottom two, amplitude and phase errors. The arrows point to memory effects in the phase error plot before feedback linearization is applied.
Over a factor of 10 attenuation of both amplitude and phase distortion is demonstrated by these plots. That both types of distortion can be successfully reduced is of particular significance in MRI. Much like single sideband modulation in communications, MRI uses linear modulation schemes to excite magnetization. Low AM-AM distortion and low AM-PM phase distortion are critical.
The FOCF system also reduces memory effects. Memory effects are evident in the two lower panels of Fig. 10, lacking feedback linearization (No Loop). Here amplitude and phase distortion are not only functions of the input signal amplitude and phase: instead, tracing a virtual line in the middle of the time window results in two asymmetric waveforms that differ, for example, by both peak amplitude error (5% vs. 6%) and peak phase error (+10º and −10º, respectively). After linearization, these errors are equally reduced; this is a result that look-up table correction could not demonstrate.
Although a sinc pulse is widely used in MRI, its modulation and envelope bandwidth is usually very limited. To challenge the effectiveness of FOCF linearization for more complicated shapes, we assessed a Very Selective Saturation (VSS) pulse.
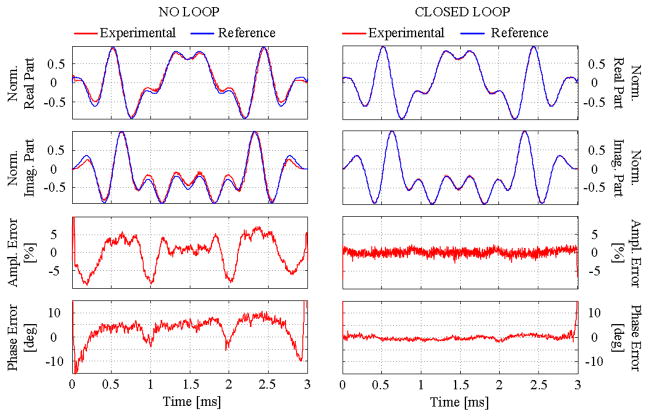
Unlike a linear-phase slice-selective excitation pulse, VSS pulses typically have a nonlinear phase profile to reduce the peak power requirements, effectively spreading the energy throughout the entire pulse duration. Despite their short duration and small in-band equi-ripple (equal amplitude), they possess large excitation bandwidths and narrow transition bands (sharper edge profiles) that are useful, for example, to reduce chemical shift misregistration. The VSS pulse used in this test had a 5 kHz excitation bandwidth. Fig. 11 shows the results of this test. Much like the sinc pulse results, the VSS fidelity was dramatically improved. Uncorrected amplitude errors of +/−5% and phase errors of +/−10 degrees were reduced to noise levels.
Fig. 11.
Amplitude and phase distortion of a VSS pulse: comparison between reference signal and measured signal obtained with the power amplifier driven directly (left) and with the same amplifier after addition of the control loop (right). The first two upper panels show real and imaginary parts of the signal; the bottom two, amplitude and phase errors.
C. Effect of Linearization Enhancement on Magnetization
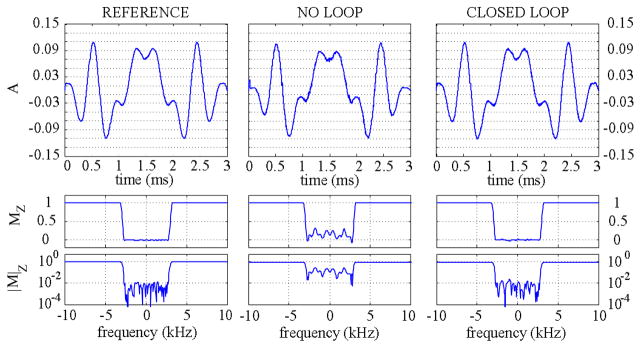
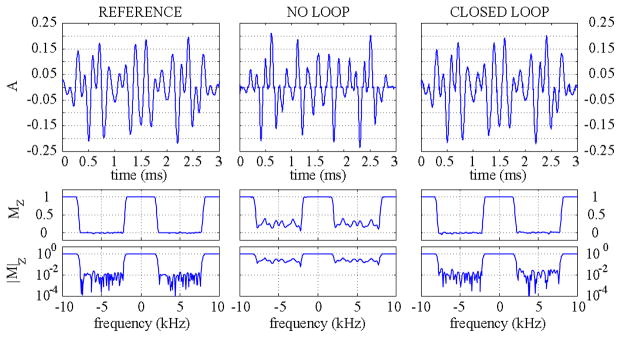
Using Bloch equation analysis, we calculated and compared the simulated magnetization for the ideal reference, distorted, and linearized VSS pulse of Fig. 11. As illustrated in Fig. 12, the desired suppression bandwidth is severely distorted by the amplifier non-linear behavior, and is faithfully reproduced when the FOCF system is in place.
Fig. 12.
Effect on the magnetization of a VSS pulse: comparison between reference, distorted, and linearized.
We then increased the bandwidth of the VSS pulse by applying a sinusoidal modulation at the frequency fm (ranging from 5 to 70 kHz), which creates two suppression bands in the magnetization profile separated by fm. Fig. 13, as in Fig. 12, compares the magnetization profile for the particular case of fm equal to 5 kHz. Good linearization performance was achieved for fm up to 70 kHz.
Fig. 13.
Effect on the magnetization of a 5-kHz-modulated VSS pulse: comparison between reference, distorted, and linearized PA waveforms.
D. Imaging Results
All MRI tests were performed on a GE Signa 1.5T MRI scanner using a GE Tx/Rx quadrature head coil with integrated quadrature hybrid. To demonstrate the FOCF system, we excited the coil with a 200 W RF power amplifier constructed from a Communications-Concepts AR313 class AB power stage, but biased closer to Class B (hence increased cross-over distortion). The power amplifier and feedback system were placed in the scanner console room. In these tests, the feedback was a power-combined sum of the Werlatone coupled Vf and Vr signals. We added our own PIN diode quadrature T/R switch which added the appropriate transmit or receive isolation, and dummy 50 ohm terminations, as needed, to the hybrid outputs during the transmit or receive intervals. The preamp was a 64 MHz design from Advanced Amplifier Research, and was connected via a 25dB gain stage to the MEDUSA receiver for imaging. The head coil was loaded by a cylindrical phantom of 4.7 in diameter and 8 in length. In addition, we placed a shielded pickup loop at the edge of the coil to directly sample the RF field. The pickup loop was connected directly to the MEDUSA receiver during transmit loopback to sample the actual transmitted pulse.
MR imaging results could then be compared with direct RF loopback of the field. All images were 128×256, 25 cm FOV and TR of 1s or 200 ms. The pulse sequence was a spin echo sequence using sagittal slice excitation and axial slice refocusing. The sagittal excite pulses selected 1 cm slices using an 8 ms Hamming windowed sinc pulse of time bandwidth 8. For dual slice tests, the sinc was cosine modulated at 1500 Hz to create slice offsets at +/− 1.5 cm. For single 1 cm slice tests, either 0 cm or −1.5 cm offsets were used. The spin echo pulse always refocused a 2.5 cm slice in the axial direction at iso-center using an 8 ms windowed sinc pulse of time-bandwidth 4.
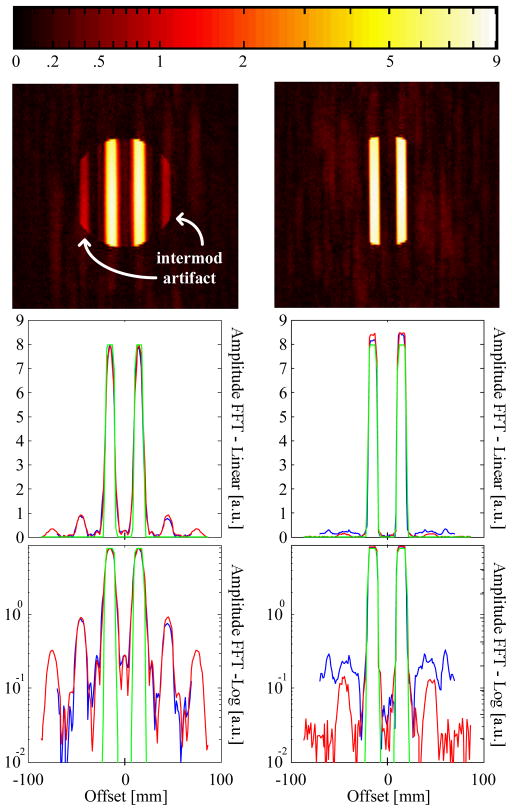
Fig. 14-top compares the dual slice MR image obtained before adding the FOCF control system (left) to the MR image obtained after (right). Both images were identically windowed by a log(1+|y|) function to compress the image dynamic range Each of the linear and logarithmic subplots of Fig. 14 (left: without FOCF, right: with FOCF) compares a 25-line MRI projection (blue), with the FFT’d RF loopback (red) (scaled both vertically and in the frequency direction to match the readout spatial dimension), and the ideal numerical waveform (green), (also processed in the same way as the RF loopback). Our nominal flip angles were around 30 degrees, satisfying the small tip-angle criteria and giving excellent agreement between the MRI profiles and the RF Fourier transform. As shown, artifacts are created in the phantom image by the 3rd order intermodulation products of the RF power amplifier. These artifacts are substantially suppressed after addition of the FOCF system. Also, the slice profiles become much sharper. Residual nonlinearity is still generated, most likely by the PIN diode T/R switch, and by the MRI image-reject down-converter reference stage, both of which are outside the control loop.
Fig. 14.
Comparison of dual slice MR images before (left) and after (right) the addition of the FOCF control system to a 63.9 MHz power amplifier at the 1.5 T MRI system. The linear and log plots compare mathematical (green) and RF loopback FFT waveform (red) with physical slice select projections (blue) for each acquisition. The artifacts created by the 3rd order intermodulation products of the RF power amplifier are substantially suppressed by the action of the loop.
In a second part of our imaging experiments, we converted the FOCF transmitter to classic Cartesian feedback (CF) by removing the cross-coupling resistors of the polyphase loop error amplifier. The loop amplifier simplifies to a matched differential amplifier pair and the control bandwidth becomes centered at DC. The DC offset of the original FOCF transmitter was about 30 mV; after removal of the cross-coupling, we minimized the DC offset using on-board trimmers to about 5 mV first, and to less than 1 mV later.
Fig. 15 compares single slice MR images at −1.5cm offset obtained without feedback linearization (a), with FOCF having about 30 mV DC offset (b), and with CF having less than 1 mV DC offset (c). These images used 1s TR and show that both FOCF and CF nicely linearize the slice profile. The image obtained with FOCF is free from any artifact, despite the presence of a significantly higher DC offset. Image d (TR=200 ms) and e (TR=1 s) used CF linearization and a higher 5 mV DC offset. An artifact created by the leaky LO is now clearly visible and one can appreciate how the extent of the artifact matches the diameter of the phantom. By comparison, RF receive “zipper” artifacts would span the entire phase encode dimension. Moreover, since the LO is not phase-locked, the phase drift per TR acts as a phase-encode causing the LO-line artifact to shift as a function of TR. Very accurate minimization of the DC offset by trimming of the onboard components makes it possible to almost eliminate the leaky LO artifact created by the CF system. However, DC drift can have a temporal dependence, and automated calibrations must first reject DC offsets inserted in the feedback down-conversion stage that do not reflect the LO signal level at the PA output. The FOCF approach is robust to these effects.
Fig. 15.
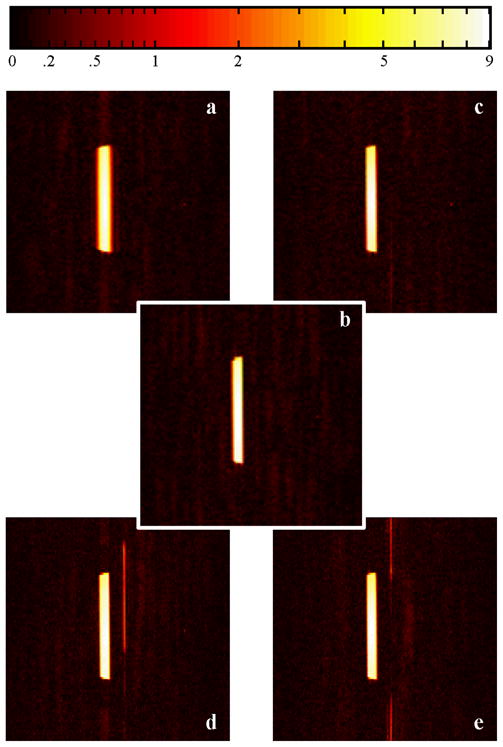
Comparison of MR images obtained without control system (a), with 30 mV DC offset FOCF (b), and with less than 1 mV DC offset CF (c). The image obtained with FOCF is free from any artifact, despite the presence of a significantly higher DC offset. Image d (TR=200ms) and e (TR=1s) use CF linearization and a higher 5 mV DC offset. The leaky LO creates visible artifacts in the CF image obtained with 5 mV DC offset (d, with TR=200 ms and e, with TR=1 s); the phase drift per TR acts as a phase-encode causing the LO-line artifact to shift as a function of TR.
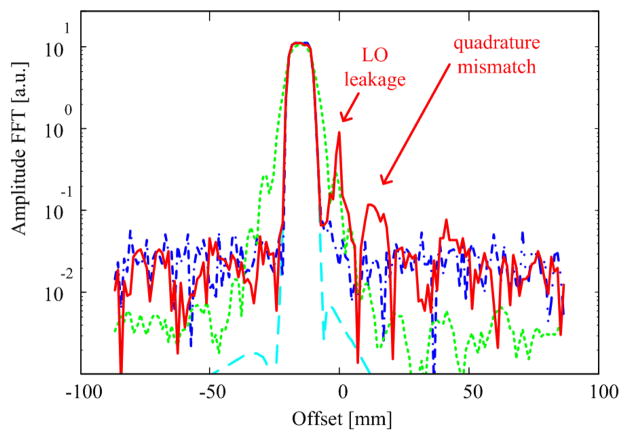
In addition to LO artifact, we were expecting ghost slices to appear in the CF images if quadrature mismatches existed in the feedback loop. Lower intensity ghost slices were noticeable in some of our results, such as in the plots in Fig. 16. Fig. 16 compares the mathematical ideal profile (cyan) with FFT RF loopback results (scaled to match slice spatial dimensions) for the FOCF profile (blue), the CF profile (red; DC offset was 5 mV), and the original profile obtained without feedback control (green). The arrows point to a ghost slice equi-distant to the right of the LO in the CF profile, which occupies the spectral location where the quadrature artifact will appear. This artifact should scale linearly with the RF slice amplitude unless arms of the quadrature path become asymmetrically overdriven. In testing, this ghost did indeed appear to be independent of LO leakage level. A second possibility is 3rd order intermodulation between the slice and high LO leakage. If so, the ghost amplitude would occupy the same frequencies but should scale with the square of the LO signal and linearly with the slice signal. This was not observed. Our image SNR (around 100 typically) was still too low for this artifact to show in imaging.
Fig. 16.
Comparison of FFT RF loopback results scaled to match slice spatial dimensions. Cyan, dashed: numerical ideal profile. Blue, dot-dashed: FOCF profile (30 mV DC offset); Green, dotted: NO CF profile; Red, solid: CF profile (5 mV DC offset). Clearly FOCF and CF linearize the profile–but the CF plot shows LO leakage, and what appears to be a quadrature ghost slice to the right of the LO.
VII. Discussion
We have shown that frequency-offset Cartesian feedback linearization can generate the high-fidelity RF waveforms demanded by MRI systems. Memory effects and other power amplifier nonlinearities will create errors in transmit array systems, such as inaccurate pulse reproduction, incomplete cancellation of aliased excitations in transmit SENSE, and variable coil-to-coil coupling due to output impedance modulation with power level. Other medical applications that employ spatial power combining, such as RF hyperthermia phased arrays [30], can likely benefit. In comparison to the classic Cartesian feedback method, frequency-offset Cartesian feedback can improve array performance by preventing bulk excitation artifacts from RF leakage. Polyphase control amplifiers and a shift to a low positive IF control band are the enabling attributes of this architecture.
In comparison to other linearization techniques such as polar feedback [31] and predistortion [32], Cartesian feedback has a number of advantages that make it potentially ideal for application to MRI. In comparison to polar feedback, this technique is applicable to any type of RF pulse envelope and any type of envelope modulation. In comparison to predistortion, a behavioral model of temporal distortion is unnecessary. However, since Cartesian feedback schemes must satisfy stability constraints, the linearization bandwidth is less than that achievable by predistortion methods. The FOCF technique does offer very high flexibility in the choice of RF feedback signal. For example, a sample of the voltage, or current, or combination of the two at the RF power amplifier output can be used for feedback and linearization, without any substantial change to the hardware configuration. Our bench test also demonstrated direct coil current control.
Though demonstrated at 1.5T, the FOCF electronics are fully capable of operating with RF power amplifiers of virtually any existing MRI system. Indeed, the CMX998 IC that operates the up/down-conversion from the RF band to the IF band is specified to work at RF frequencies up to 1 GHz; the polyphase loop error amplifier and other IF circuitry need not change for the application to higher field strengths. To change the operating RF band, one need only change the onboard local oscillator frequency that feeds the reference input down-converter and the CMX998 (or an external LO source can be used). If the LO is direct digitally synthesized, real-time frequency hopping and LO tracking of the control bandwidth with the signal band become feasible. This may have application to multi-nuclear imaging, multi-slice imaging, and high bandwidth 2D excitations. A similar capability can exist if the center frequency ωc of the polyphase loop error amplifier is tunable. This is feasible in switched-capacitor IC implementations for the polyphase passive components, or with digital potentiometers. Expansion of the control loop bandwidth is also possible with polyphase versions of lead/lag compensation.
The dual-band VSS pulse and dual-slice sinc pulses were tested because they introduced rapid envelope changes creating significant phase/amplitude cross-over distortion when FOCF was absent. In contrast, many NMR composite pulses fix the amplitude, using only phase steps, to avoid AM-AM and AM-PM distortion. With FOCF, the phase or amplitude step response time will be similar to a single time-constant low pass system and inversely related to closed loop bandwidth. A second issue is RF droop, which is a simple form of memory effect.. Our amplifier supply could support 100% current demand CW, so this effect was minor and easily linearized. In pulse amplifiers, where capacitors provide a significant amount of the short term supply current, composite pulses, and adiabatic pulses using rotary echoes (eg BIR-4), will be susceptible to RF droop. FOCF should be very effective in mitigating this effect in pulse amplifier designs.
In our current FOCF implementation, more work is needed to improve dynamic range and noise performance. Currently, the maximum input power of the CMX998 down-mixer is significantly lower than the typical MRI RF output power; very high attenuation is needed in the feedback path to avoid saturating the feedback input port of the device. This high attenuation, however, increases the sensitivity to wideband noise in the feedback down-mixer. To reduce this sensitivity, future customized FOCF designs may benefit from a selection of higher dynamic range mixers and an alternate down-conversion scheme. For example, our image reject down-converter mixers are somewhat redundant given that the feed back down-converter mixer performs a similar role. In one scheme, Voyce [22] proposed to subtract the feedback and reference signals at RF, but with the loop error signal down-converted and amplified at a high IF. If FOCF subtracted the feedback and reference at RF before down-conversion, then under closed loop conditions, only a small signal would exist at this mixer. A similar RF subtraction technique was at the core of a Cartesian Feedback architecture proposed by Porco and Melton [33] of Motorola, Inc.
VIII. Conclusion
We have demonstrated the linearization performance of a new frequency-offset Cartesian feedback method (based on polyphase difference amplifiers) applied to the RF power amplifiers used in MRI. Frequency-offset Cartesian feedback allows high flexibility in the choice of feedback control signal, including the power amplifier output current or voltage, or, the RF coil current. This flexibility, in turn, translates into the applicability of the linearization method to MRI parallel transmit technology. The frequency-offset Cartesian feedback system has auto-calibration capabilities to automatically search for the stability conditions before each use of the system.
Our experiments show that the distortion of the RF power amplifier is reduced by the loop gain of the system, which in our experiments was up to 26 dB. This performance was demonstrated on the bench on a variety of typical MRI pulses, including sinc pulses and VSS pulses. In these cases, the magnetization profile obtained with the Bloch simulation showed that high fidelity RF reproduction can be obtained even with appreciable RF power amplifier distortion.
The linearization performance of the frequency-offset Cartesian feedback system was also demonstrated in a 1.5 T MR imaging suite. We demonstrated a significant reduction of both the artifacts and slice profile blurring created by the power amplifier nonlinearity. Finally, comparison of the imaging results obtained with the frequency-offset, low-IF control bandwidth and with the classic, baseband control bandwidth demonstrated the superior robustness of our method to the DC offset and quadrature mismatches in the loop. We conclude that frequency offset Cartesian feedback provides a viable means to engineer low-cost, high-fidelity RF power amplifiers for MRI.
Acknowledgments
This work was supported in part by the grants: NIH R01EB008108, R33CA118276, and R21EB007715.
The authors would like to thank Prof. Thomas Lee at the Stanford Microwave Integrated Circuits Laboratory, Stanford University, CA for his valuable comments on our research.
Biographies

Marta G. Zanchi received the B.S. degree in biomedical engineering and the M.S. degree in electrical engineering from Politecnico Di Milano, Italy, in 2003 and 2005, respectively. In 2010, she graduated with a Ph.D. degree in electrical engineering from Stanford University, Stanford, CA for her work on control feedback techniques in MRI.
She received the Politecnico Di Milano highest student honor in 2006 and two fellowships from Stanford University in 2006 and 2009. Since 2008, she holds a certificate in entrepreneurship and an award from the Stanford Graduate School of Business in Stanford University.
Dr. Zanchi is currently working with the business development group at LitePoint Corporation in Sunnyvale, CA.

Pascal Stang received a B.S. degree from Santa Clara University in 1998, and M.S. degree from Stanford University in 2005, both in electrical engineering.
He has taught embedded systems and mechatronics courses at Stanford and Santa Clara University, respectively, and is active in the fields of medical imaging, robotics & controls, and small satellite design. He is currently working towards a Ph.D degree at the Stanford University Magnetic Resonance Systems Research Lab, California, USA

Adam Kerr received the Ph.D. degree in Electrical Engineering from Stanford University in 1998.
He was an employee of ArrayComm, Inc., a world-leader in smart-antenna wireless products from 1998 to 2004, ending as a Vice-President in Engineering.
Dr. Kerr currently works as both a Sr. Research Engineer with the Magnetic Resonance Systems Research Lab in Electrical Engineering at Stanford University and at HeartVista, Inc., a company he co-founded to produce a software package for comprehensive cardiac MRI examinations. He co-founded in 2006. His main research interests are RF pulse design for MRI and real-time cardiac MRI.

John M. Pauly received the PhD degrees in electrical engineering at Stanford University, California, USA in 1989. He is a Professor of electrical engineering at Stanford University. His main research interests are in MRI, and the use of MRI for guiding minimally invasive interventional procedures.
He teaches classes in image reconstruction for medical imaging, as well as RF pulse design for MRI at Stanford. He holds 42 U.S. patents and has authored and co-authored 110 journal articles.
Dr. Pauly is a Member of the IEEE and is Associate Editor of IEEE Transactions on Medical Imaging.

Greig C. Scott received the BASc (Honours) degree in electrical engineering from the University of Waterloo in 1986, and the MASc and PhD degrees in electrical engineering at the University of Toronto, Canada in 1989 and 1993 respectively.
He is a Sr. Research Engineer with the magnetic resonance systems research lab (MRSRL) in electrical engineering at Stanford University, and has served as a consultant to several interventional device companies. His main research interests are MRI instrumentation, and electromagnetic imaging techniques for RF safety and MR-guided therapy.
Contributor Information
Marta Gaia Zanchi, Email: mgzanchi@stanfordalumni.org, LitePoint Corporation, CA 94085 USA. (phone: 408-456-5000; fax: 408-456-0106).
Pascal Stang, Email: pstang@gmail.com, Electrical Engineering Department, Stanford University, Stanford, CA 94305 USA. (phone: 650-724-3626; fax: 650-723-8473).
Adam Kerr, Email: akerr@stanford.edu, Electrical Engineering Department, Stanford University, Stanford, CA 94305 USA. (phone: 650-725-9906; fax: 650-723-8473).
John Mark Pauly, Email: pauly@stanford.edu, Electrical Engineering Department, Stanford University, Stanford, CA 94305 USA. (phone: 650-723-4569; fax: 650-723-8473).
Greig Cameron Scott, Email: greig@mrsrl.stanford.edu, Electrical Engineering Department, Stanford University, Stanford, CA 94305 USA. (phone: 650-724-3639; fax: 650-723-8473).
References
- 1.IMV Medical Information Division. Latest IMV Market Report Shows Continued Demand for High Field MRI Systems. 2007 Jan; [Online]. Available: http://www.imvinfo.com.
- 2.Norris DG. High Field Human Imaging. Journal of Magnetic Resonance Imaging. 2003;18(5):519–529. doi: 10.1002/jmri.10390. [DOI] [PubMed] [Google Scholar]
- 3.Pruessmann KP. Parallel Imaging at High Field Strength: Synergies and Joint Potential. Topics in Magnetic Resonance Imaging. 2004;15(4):237. doi: 10.1097/01.rmr.0000139297.66742.4e. [DOI] [PubMed] [Google Scholar]
- 4.Schirmer T, JRA, Hurd RE, Sailasuta N, Tropp J, Le Roux P. Chemical Shift Error and Artifact Reduction in CSI Using Very Selective Saturation Pulses. Proceedings of the 6th International Society for Magnetic Resonance in Medicine Scientific Meeting & Exhibition; Sydney, Australia. April 1998; p. 1877. [Google Scholar]
- 5.Ladd ME. High-Field-Strength Magnetic Resonance: Potential and Limits. Topics in Magnetic Resonance Imaging. 2007;18(2):139. doi: 10.1097/RMR.0b013e3180f612b3. [DOI] [PubMed] [Google Scholar]
- 6.Schick F. Whole-body MRI at High Field: Technical Limits and Clinical Potential. European Radiology. 2005;15(5):946–959. doi: 10.1007/s00330-005-2678-0. [DOI] [PubMed] [Google Scholar]
- 7.Katscher U, Bornert P, Leussler C, Van Den Brink JS. Transmit Sense. Magnetic Resonance in Medicine. 2003;49(1):144–150. doi: 10.1002/mrm.10353. [DOI] [PubMed] [Google Scholar]
- 8.Ullmann P, Junge S, Wick M, Ruhm W, Hennig J. Experimental Verification of Transmit SENSE with Simultaneous RF-Transmission on Multiple Channels. Proceedings of the 13th International Society for Magnetic Resonance in Medicine Scientific Meeting & Exhibition; Miami, Fl. May 2005; p. 15. [DOI] [PubMed] [Google Scholar]
- 9.Zhu Y. Parallel excitation with an array of transmit coils. Magnetic Resonance in Medicine. 2004;51(4):775–784. doi: 10.1002/mrm.20011. [DOI] [PubMed] [Google Scholar]
- 10.Zhang Z, Yip CY, Grissom W, Noll DC, Boada FE, Stenger VA. Reduction of Transmitter B1 Inhomogeneity with Transmit SENSE Slice-Select Pulses. Magnetic Resonance in Medicine. 2007;57(5):842–847. doi: 10.1002/mrm.21221. [DOI] [PMC free article] [PubMed] [Google Scholar]
- 11.Grissom WA, Kerr AB, Stang PP, Scott GC, Pauly JM. Minimum Envelope Roughness Pulse Design For Reduced Amplifier Distortion in Parallel Excitation. Magnetic Resonance in Medicine. doi: 10.1002/mrm.22512. to be published. [DOI] [PMC free article] [PubMed] [Google Scholar]
- 12.Petrovic V. VHF SSB Transmitter Employing Cartesian Feedback. Proceedings of the IEE Conference on Telecommunications, Radio and Information Technology; Birmingham, UK. May 1984; pp. 161–165. [Google Scholar]
- 13.Dawson J, Lee TH. Feedback Linearization of RF Power Amplifiers. Norwell, MA: Kluwer Academic Publishers; 2004. [Google Scholar]
- 14.Hoult D, Kolansky G, Kripiakevich D, King SB. The NMR multi-transmit phased array: a Cartesian feedback approach. Journal of Magnetic Resonance. 2004;171:64–70. doi: 10.1016/j.jmr.2004.07.020. [DOI] [PubMed] [Google Scholar]
- 15.Hoult D, Foreman D, Kolansky G. Overcoming high-field RF problems with non-magnetic Cartesian feedback transceivers. Magnetic Resonance Materials in Physics, Biology and Medicine. 2008 Mar;21(1–2):15–29. doi: 10.1007/s10334-007-0089-8. [DOI] [PubMed] [Google Scholar]
- 16.Zanchi MG, Pauly JM, Scott GC. Frequency Offset Cartesian Feedback Control System for MRI Power Amplifier. Proceedings of the 17th International Society for Magnetic Resonance in Medicine Scientific Meeting & Exhibition; Honolulu, HI. April 2009; p. 398. [Google Scholar]
- 17.Zanchi MG, Stang P, Pauly JM, Scott GC. On Stability and Performance of Frequency-Offset Cartesian Feedback for RF Power Amplifiers of MRI Transmitter Arrays. presented at 18th International Society for Magnetic Resonance in Medicine Scientific Meeting & Exhibition; Stockholm, Sweden. 2010. [Google Scholar]
- 18.Zanchi MG, Pauly JM, Scott GC. Frequency-Offset Cartesian Feedback Based on Polyphase Difference Amplifiers. IEEE Transactions on Microwave Theory and Techniques. 2010;58(5):1297–1308. doi: 10.1109/TMTT.2010.2045579. [DOI] [PMC free article] [PubMed] [Google Scholar]
- 19.Kenington P. High Linearity RF Amplifier Design. Norwood, MA: Artech House; 2000. [Google Scholar]
- 20.Chan FP. Method and means for correcting RF amplifier distortion in magnetic resonance imaging. 5,140,268. US Patent. 1992 Aug 18;
- 21.Cripps SC. Advanced Techniques In RF Power Amplifier Design. Norwood, MA: Artech House; 2002. [Google Scholar]
- 22.Voyce KG, McCandless JH. Power Amplifier Linearization Using IF Feedback. IEEE Transactions on Microwave Theory and Techniques. 1989;1:863–866. [Google Scholar]
- 23.Marshall CB. Active Polyphase Filters. 4 723 318. US Patent. 1988 Feb 2;
- 24.Crols J, Steyaert MSJ. CMOS Wireless Transceiver Design. Norwell, MA: Kluwer Academic Publishers; 1997. [Google Scholar]
- 25.Crols J, Steyaert MSJ. Low-IF Topologies for High-Performance Analog Front Ends of Fully Integrated Receivers. IEEE Trans on Circuits and Systems II: Analog and Digital Signal Processing. 1998 Mar;45(3):269–282. [Google Scholar]
- 26.Stang P, Conolly S, Pauly J, Scott G. MEDUSA: A Scalable MR Console for Parallel Imaging. Proceedings of the 15th International Society for Magnetic Resonance in medicine Scientific Meeting & Exhibition; Berlin, Germany. 2007. p. 925. [Google Scholar]
- 27.Scott G, Stang P, Kerr A. A Load Pull/Hot S22 Analyzer for Transmit Array Amplifiers. Proceedings of the 17th International Society for Magnetic Resonance in Medicine Scientific Meeting & Exhibition; Honolulu, Hawaii. 2009. p. 3025. [Google Scholar]
- 28.Stang P, Zanchi MG, Grissom W, Kerr A, Pauly J, Scott G. RF Sensor Considerations for Input Predistortion Correction of Transmit Arrays. Proceedings of the 17th International Society for Magnetic Resonance in Medicine Scientific Meeting & Exhibition; Honolulu, HI. April 2009; p. 420. [Google Scholar]
- 29.Tran TKC, Vigneron DB, Sailasuta N, Tropp J, Le Roux P, Kurhanewicz J, Nelson S, Hurd R. Very Selective Suppression Pulses for Clinical MRSI Studies of Brain and Prostate Cancer. Magnetic Resonance in Medicine. 2000;43:23–33. doi: 10.1002/(sici)1522-2594(200001)43:1<23::aid-mrm4>3.0.co;2-e. [DOI] [PubMed] [Google Scholar]
- 30.Fenn AJ, King GA. Adaptive Radiofrequency Hyperthermia-phased Array System for improved cancer therapy: phantom target measurements. International Journal of Hyperthermia. 1994;10(2):189–208. doi: 10.3109/02656739409009343. [DOI] [PubMed] [Google Scholar]
- 31.Petrovic V, Gosling W. Polar Loop Transmitter. Electronics Letters. 1979;15(10):286–287. [Google Scholar]
- 32.Stang PP, Kerr A, Grisson W, Pauly JM, Scott GC. Vector Iteration Predistortion: an Auto-Calibration Method for Transmit Arrays. Proceedings of the 17th International Society for Magnetic Resonance in Medicine Scientific Meeting & Exhibition; Honolulu, HI. April 2009; p. 395. [Google Scholar]
- 33.Porco R, Melton R. Motorola Technical Developments. Vol. 38 Motorola, Inc; Schaumburg, IL: Jun, 1999. Digitally Referenced RF Feedback Cartesian Loop. [Google Scholar]


