Abstract
The effect of crude oil on the growth of legumes (Calopogonium muconoides and Centrosema pubescens) and fate of nitrogen-fixing bacteria in wetland ultisol was investigated using standard cultural techniques. The results revealed observable effects of oil on soil physico-chemistry, plant growth and nodulation as well as on densities of heterotrophic, hydrocarbonoclastic and nitrogen fixing bacteria. The effects however varied with different levels (0.5%, 1%, 5%, 10%, 15% and 20%) of pollution. Ammonium and nitrate levels were high in the unpolluted soil but decreased with increase in pollution levels. Nitrite was not detected in contaminated soil probably due to the reduction in numbers of nitrogen fixers, from 5.26 ± 0.23 × l06cfu/g in unpolluted soil to 9.0 ± 0.12 × 10⁵ and 2.2 ± 0.08 × l05 cfu/g in soils with 5% and 20% levels of pollution respectively. The contaminated soil also exhibited gross reduction in the nodulation of legumes. A range of 13–57 nodules was observed in legumes from polluted soil against 476 nodules recorded for plants cultured on unpolluted soil. The heterogeneity of the microbial loads between oil-polluted and unpolluted soil were statistically significant (p < 0.05, ANOVA). Positive significant relationships were observed between the levels of hydrocarbons and the densities of heterotrophic bacteria (r = 0.91) and that of hydrocarbon utilizing bacteria (r = 0.86). On the other hand, relationships between the densities of nitrogen fixing bacteria and total hydrocarbons content was negative (r = −0.30) while positive relationships were recorded between the densities of different microbial groups and treatment periods except at 15% and 20% pollution levels. The LSD tests revealed highly significant differences (p < 0.001) in the physiological groups of soil microorganisms at all levels of pollution. The results imply that crude oil seriously affects rhizosphere microbial growth in legumes. Among the bacterial species isolated, Clostridium pasteurianum, Bacillus polymyxa and Pseudomonas aeruginosa exhibited greater ability to degrade hydrocarbons than Azotobacter sp, Klebsiella pneumoniae and Derxia gummusa while Nitrosomonas and Nitrobacter had the least degradability. A continuous monitoring of the environment is advocated to prevent extinction of nitrogen-fixing bacteria and total loss of soil fertility attributable to petroleum hydrocarbon contamination in the Niger Delta ultisol.
Keywords: Fate, Nitrogen-fixing, Bacteria, Crude oil polluted wetland
A wetland is an environment at the interface between terrestrial ecosystem and aquatic systems. This makes them different from each yet highly dependent on both (Mitsch and Gosselink 1986). They are generally richer in mineral salts due to water supply from the surroundings via runoff and/or ground water. Nitrogen is a common soil nutrient element required in large quantity by plants. Many plant species in diverse habitat usually contain 1–3% nitrogen on dry weight bases. The growth of higher plants in many ecosystems is limited by nitrogen supply. Nitrogen is largely made available to plant in form of ammonium or nitrate ion by the activities of soil microorganisms through the process of nitrogen fixation. These microorganisms are the nitrifying bacteria. The diazotrophs form symbiotic relationship with the roots of host plants (Harrison 2003). They include Rhizobium, Bacillus, Azotobacter, Beijerinckia, Pseudomonas, Derxia gumosa, Mycobacterium, Nitrosomonas and Nitrobacter species. The root system of higher plants especially legumes is associated not only with inanimate environment comprising organic and inorganic substances but also a vast community of metabolically active microorganisms referred to as rhizosphere organisms (Rovira and Davey 1975; Alexander 1977). Interactions between the macro and micro-organisms in the rhizosphere can be of considerable significance for crop production and soil fertility (Rovira and Davey 1975). The bacteria depend on the legumes for basic nutrients needed to sustain their life functions. The nitrogen-fixing capacity of legumes stabilizes the soil nitrogen and organic carbon content in the root zone to a greater extent than crops grown alone. However, in an experiment to measure the nitrogen accumulated by plants grown in solution culture and small field plots at Ibadan in Nigeria, Agboola and Fayemi (1972) reported that cowpea (Vigna unguiculata), green grain (Vigna radiata)and Calopo (Calopogonium mucunoides) can accumulate nitrogen at rates in excess of 300 kg within 12–14 weeks.
Contamination of soil by crude oil could lead to a depression of microbial density and activities even in case of relatively light contamination (Odu1972a, b).The extent of the effects depends on the original soil properties and the plant exposed to contaminated soil. Hence, if leguminous plant is planted on a crude oil-contaminated soil, the activities of the nitrogen-fixing bacteria may be retarded. The oil also inhibits the action of the enzyme “nitrogenase”, thereby disrupting the process of protein synthesis. This would eventually result in inability of the plants to thrive and survive in the affected ecosystem. However, in a survey of 15 oil-contaminated site, Gadin and Syratt (1975) reported that leguminous plants were the dominant flora; indicating a selective advantage of plants with a symbiotic nitrogen fixing potential. Ile (1997) showed that a low (0.75%) level of oil in soil improved the growth and nodule development of soya beans. This improvement could be attributed to nitrogen fixation or the additional nutrients released from the activities of the tolerant organisms. Assessing microbial response to pollution stress may provide basic information for the improvement of microbial activities in order to promote soil fertility and plant growth. There is a paucity of information in Nigeria on the fate of nitrogen-fixing bacteria in crude oil-contaminated wetlands. This study therefore investigates the fate of nitrogen-fixing bacteria in leguminous plants grown at different levels of crude oil-polluted wetland soil.
Materials and Methods
The soil samples used in the study were collected from wetland soil sites where there are no recorded cases of crude oil contamination. The soil was obtained within the vicinity of Ikot Obio Nko stream in Ibesikpo-Asutan Local Government Area of Akwa Ibom State. The prevalent species of legumes, Calopogonium muconoides and Centrosema pubescens, both members of the family Leguminosae and sub-family Faboideae found in the wetland sites were selected for the study.
Surface (0–10 cm depth) soil samples obtained from the wetland were air dried and passed through a 2 mm sieve. Particle size distribution of the soil samples were analyzed by combination of wet sieving and hydrometer techniques (Bouyoucos 1962) using calgon as the dispersing agent. The soil organic carbon content was determined by dichromate wet oxidation methods of Walkey and Black (1934). Total nitrogen was determined by Kjeldahl digestion methods of Bray and Kurtz (1945). Exchangeable bases were extracted with 1 mol of Ammonium acetate (NH4OAC pH7). Potassium and sodium in the extracts were determined by Flame photometric technic (AOAC 1975), while calcium and magnesium were determined by Versemate EDTA titration methods (Jackson 1962). Soil pH was determined in water using a Pye Unicam pH meter (AOAC 1975) and electrical conductivity, determined as described by Jackson (1962).Metals in soil were determined by the perchloric acid digestion method as described by Udo (1986) and the concentration of the metals measured with Unican Solar System 919 Atomic Absorption Spectrophotometer (AAS) (Udosen 1991).
Precisely 10 kg of the wetland soil was weighed and placed separately in seven 2 × 2 ft porous—bottomed wooden boxes which were used for the cultivation of the legumes. Two sets experimental microcosms were prepared, each for the two different species of legumes (Calopogonium muconoides and Centrosema pubescens) examined. Ten stands of each legume were transplanted on each wooden box and the number of nodules on the test plants was noted before they were transplanted into the wooden boxes. The plants were watered adequately on daily basis with stream water to maintain a permanently wet environment and allowed to adapt and grow in vitro, forming new buds and leaves before polluting the soil with graded doses of crude oil. The test plants separately cultured in wetland soil contained in six of the seven porous bottomed boxes were simulated with Bonny Light crude oil to attain 0.5%, 1%, 5%, 10%, 15% and 20% levels of pollution. The seventh box which was not contaminated with crude oil served as control. The plants were observed daily for weeks after soil simulation with crude oil, and using a ‘destructive approach’ the legumes were harvested after every 2 weeks to examine the effects of pollution on the plants.The plants were observed daily for weeks after soil simulation with crude oil and the effects of pollution on the plants were noted at the various levels of pollution. Using a ‘destructive approach’ the legumes were harvested after every 2 weeks and the number of nodules estimated.
The rhizosphere microorganisms of the legumes were enumerated within 24 h of collection by the viable plate count method using surface spreading technique (Zuberer 1994). At each sampling, three samples of rhizosphere soil (plant root plus adhering soil) were carefully obtained per plant from each treatment, pooled and a 10 g sub-sample was ground in a sterile mortar. Supernatant suspensions of the sub-samples were prepared by dissolving the soil in 100 mL of sterile distilled water and then subjecting it to ten-fold serial dilution. Volumes (0.1 mL) of the desired aliquotes were plated on appropriate media. The total heterotrophic bacterial counts of the rhizosphere soil samples were estimated on nutrient agar after 48 h of incubation at room temperature (28 ± 2°C). The densities of hydrocarbon—degrading bacteria in soil samples was determined using the modified mineral salt agar of Mills et al. (1978). The vapour phase transfer method described by Amanchukwu et al. (1989) was employed to estimate the population of hydrocarbon utilizing bacteria. Plates were enumerated after incubation at room temperature (28 ± 2°C) for 5 days. On the other hand the Ashby nitrogen—free agar was utilized for the enumeration and isolation of nitrogen fixing bacteria.
Pure cultures of the bacterial isolates were examined for their colonial appearance and thereafter subjected to the following tests: Gram’s staining, catalase, citrate utilization, motility, urease, methyl red, voges-proskauer and sugar fermentation profiles. The procedures described by Cowan (2003) and Holt et al. (1994) were adopted.
Results and Discussion
The results of the physico-chemical parameters monitored during the study period are presented in Tables 1, 2 and 3. There was a continuous decrease in the soil pH, electrical conductivity, and total nitrogen and available phosphorous in the crude oil-polluted soils when compared to values obtained from the unpolluted soil (0%), (Table 1). The values ranged from 5.5 to 6.9, 5.9 to 6.7 μS/cm−1, 0.12 to 0.26% and 10.66 to 49.99 mg/kg, respectively, with increase in pollution levels from 0.5% to 20% (w/v). Conversely, organic matter and total hydrocarbon contents increased with increase in pollution level. Values of the exchangeable cations and acidity of soil at different pollution levels were not consistent. Table 2 shows that the concentration of lead, nickel, zinc, iron and manganese increased with corresponding increase in pollution levels. It ranges from 2.10 to 4.0, 0.10 to 0.50, 4.22 to 6.92, 4.0 to 9.0 and 4.50 to 8.60 mg/kg, respectively. The least concentrations of metals were detected in unpolluted soil (control). The values recorded were 2.0, 4.0, 4.0 and 4.2 mg/kg for lead, zinc, iron and manganese, respectively. Cobalt and nickel were not detected in the unpolluted soil, whereas cobalt was detected in soil polluted with 0.5%, 1% and 5% of crude oil. Nitrate-nitrogen (No3–N) showed a decrease in the polluted soil sample from 0.5 to 0.02 mg/kg and from 0.43 to 0.11 mg/kg at 0.5% to 20% levels of pollution, respectively during the period. However, the control soil sample contained a very high amount of the ammonium-nitrogen (0.8 mg/kg) and nitrate-nitrogen (7.28 mg/kg) while nitrite-nitrogen (No2–N) was not detected in the polluted and control soils.
Table 1.
Physico-chemical properties of the crude oil polluted wetland soil
| Parameters | Percentage of crude oil pollution | ||||||
|---|---|---|---|---|---|---|---|
| Soil particles | Control | 0.5% | 1% | 5% | 10% | 15% | 20% v/v |
| (1) Sand (%) | 90.20 | 90.80 | 91.80 | 92.40 | 90.00 | 89.90 | 90.00 |
| (2) Silt (%) | 3.80 | 3.00 | 3.20 | 3.40 | 4.00 | 4.10 | 4.30 |
| (3) Clay (%) | 6.00 | 6.20 | 5.00 | 4.20 | 6.00 | 6.00 | 5.70 |
| pH | 6.90 | 6.50 | 6.40 | 6.10 | 5.80 | 5.60 | 4.50 |
| Conductivity μS/cm−1 | 6.70 | 6.40 | 6.30 | 6.30 | 6.20 | 6.10 | 5.90 |
| Organic matter (%) | 0.040 | 0.070 | 0.129 | 0.111 | 0.158 | 0.146 | 0.176 |
| Total nitrogen (%) | 0.26 | 0.25 | 0.22 | 0.15 | 0.14 | 0.12 | 0.12 |
| Available phosphorus (mg/kg) | 44.99 | 22.66 | 15.99 | 15.33 | 10.66 | 10.66 | 13.99 |
| Total hydrocarbon | 0.00 | 2,300 | 2,750 | 3,900 | 4,950 | 5,060 | 5,200 |
| Exchangeable cations (Cmol/kg) | |||||||
| Calcium | 2.34 | 2. 04 | 1.00 | 1.20 | 1. 04 | 2.60 | 1.90 |
| Magnesium | 1.00 | 1.00 | 0.50 | 0.60 | 0.60 | 0.70 | 0.70 |
| Sodium | 0.05 | 0.06 | 0.06 | 0.07 | 0.06 | 0.07 | 0.05 |
| Potassium | 0.10 | 0.10 | 0.13 | 0.09 | 0.06 | 0.13 | 0.08 |
| Exchangeable acidity | 2.00 | 2.10 | 2.00 | 2.00 | 2.20 | 2.40 | 2.40 |
| ECEC | 5.49 | 5.66 | 3.69 | 3.96 | 4.32 | 5.90 | 5.13 |
| BS% | 63.57 | 62.88 | 45.79 | 49.49 | 49.07 | 59.32 | 53.22 |
Table 2.
Metals loads of crude oil-polluted wetland soil
| Parameters (mg/kg) | Percentage pollution | ||||||
|---|---|---|---|---|---|---|---|
| 0% (Control) | 0.5% | 1% | 5% | 10% | 15% | 20% | |
| Lead (Pb) | 2.0 ± 0.2 | 2.1 ± 0.4 | 6.6 ± 0.11 | 3.0 ± 0.06 | 3.72 ± 0.8 | 3.9 ± 0.4 | 4.0 ± 0.06 |
| Cobalt (Co) | ND | 0.2 ± 0.07 | 0.10 ± 0.2 | 0.10 ± 0.13 | ND | ND | ND |
| Nickel (Ni) | ND | 0.10 ± 0.2 | 0.12 ± 0.13 | 0.33 ± 0.8 | 0.4 ± 0.04 | 0.45 ± 0.7 | 0.50 ± 0.3 |
| Zinc (Zn) | 4.0 ± 0.2 | 4.22 ± 0.11 | 4.58 ± 0.2 | 6.1 ± 0.06 | 6.47 ± 0.2 | 6.88 ± 0.06 | 6.92 ± 0.04 |
| Iron (Fe) | 4.0 ± 0.2 | 4.15 ± 0.06 | 5.1 ± 0.06 | 6.2 ± 0.8 | 6.8 ± 0.2 | 8.75 ± 0.4 | 9.0 ± 0.08 |
| Manganese (Mn) | 4.2 ± 0.1 | 4.5 ± 0.8 | 5.0 ± 0.4 | 6.0 ± 0.13 | 6.5 ± 0.060 | 7.8 ± 0.8 | 8.6 ± 0.2 |
ND Not detected
Table 3.
Nitrogenous salts (ammonium, nitrite and nitrate) levels in oil-polluted wetland soil
| Level of pollution (%) | NH4 +–N (mg 100 g−1) | NO2–N (mg 100 g−1) | NO3–N (mg 100 g−1) |
|---|---|---|---|
| 0 | 0.8 ± 0.1 | ND | 7.2830 ± 0.002 |
| 0.5 | 0.5 ± 0.2 | ND | 0.4357 ± 0.014 |
| 1 | 0.3 ± 0.1 | ND | 0.3558 ± 0.008 |
| 5 | 0.2 ± 0.1 | ND | 0.2688 ± 0.011 |
| 10 | 0.09 ± 0.02 | ND | 0.1752 ± 0.006 |
| 15 | 0.05 ± 0.02 | ND | 0.1548 ± .0.004 |
| 20 | 0.02 ± 0.01 | ND | 0.1139 ± 0.016 |
ND Not detected
The response of the different physiological groups of organisms in the rhizosphere of Centrosema pubescens and Calopogonium mucunoides to crude oil pollution in wetland soil are illustrated in Figs 1, 2 and 3. The results revealed that the rhizospheres of both legumes grown in polluted and unpolluted wetland soil habour diverse species of microorganisms. However, higher densities of heterotrophic and nitrogen-fixing bacteria were found in the rhizosphere of legumes cultured in unpolluted wetland. On the other hand, the density of hydrocarbonoclastic bacteria was higher in polluted soil than the unpolluted soil by 10%. The total heterotrophic bacterial counts obtained ranged from 8.22 to 9.78 × 10⁶ cfu/g. The rhizosphere of legumes exposed to 0.5% pollution level recorded the least observable population density of hydrocarbon utilizing bacteria while 20% pollution level showed the highest result. The results also show that the initial bacterial densities of 8.77 and 8.68 × 10⁶cfu/g recorded for Centrosema pubescens and Calopogonium mucunoides in unpolluted soil later reduced to 8.40 and 8.22 × 10⁶ cfu/g when exposed to crude oil contamination only to increase again with time to 9.78 and 9.59 × 10⁶ cfu/g, respectively, over time. The hydrocarbonoclastic bacterial counts obtained for both legumes ranged from 5.60 to 7.74 × 10⁵ cfu/g. The density of the oil degraders in the plants rhizosphere increases overtime, even in soils with the highest level (20%) of contamination. In contrast, the unpolluted soil had lower densities of crude oil degraders. Mean densities of 4.46 and 4.26 × 10⁵cfu/g were recorded for Centrosema pubescens and Calopogonium mucunoides, respectively. Statistical relationship between the variables was established using the methods of Sokal and Rohlf (1995), Frank and Althoen (1995). A positive significant (r = 0.91 at p = 0.05) relationship was observed between the levels of hydrocarbons and the densities of heterotrophic bacteria in the polluted soil. Similar observation (r = 0.86) was recorded between hydrocarbons and densities of hydrocarbon utilizing bacteria although a negative but insignificant (r = −0.30) relationship was established between hydrocarbons and nitrogen fixing bacteria (Fig. 4).
Fig. 1.
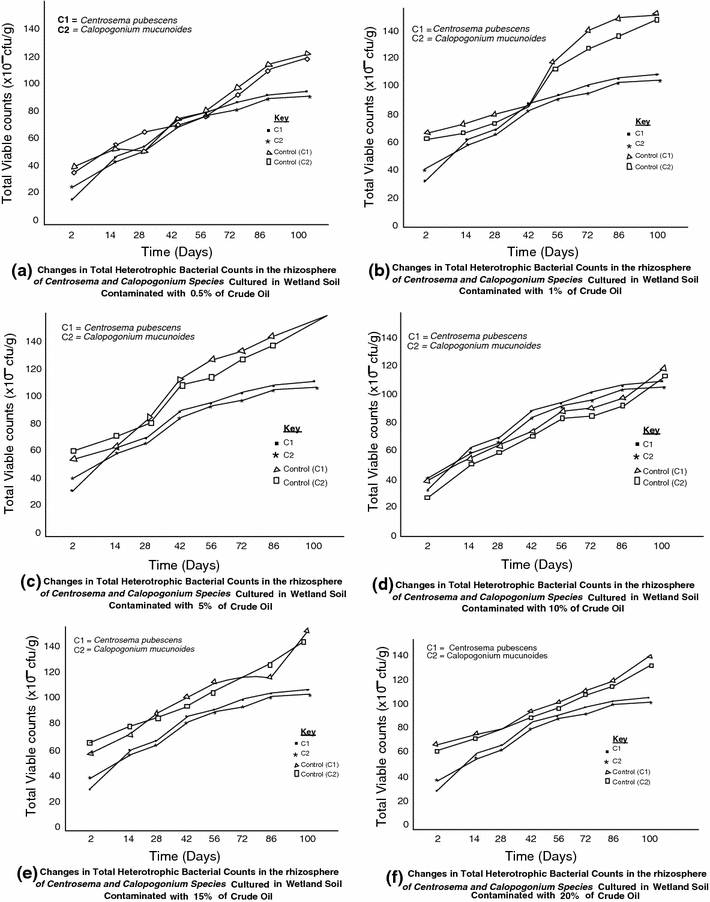
Densities of heterotrophic bacteria at different level of crude oil pollution
Fig. 2.
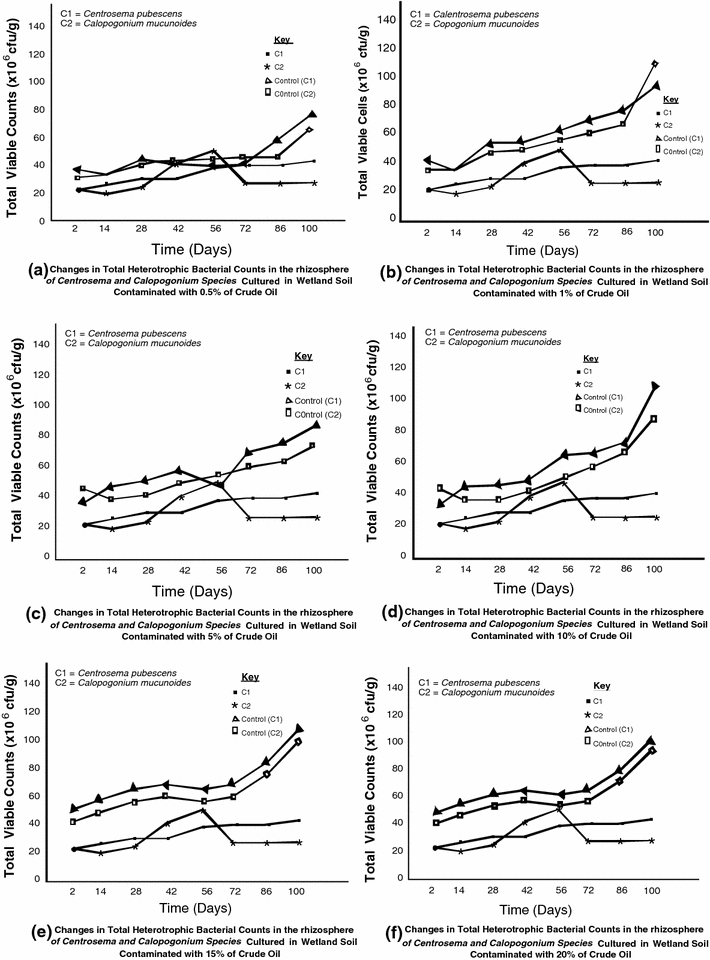
Densities of hydrocarbonoclastic bacteria at different level of crude oil pollution
Fig. 3.
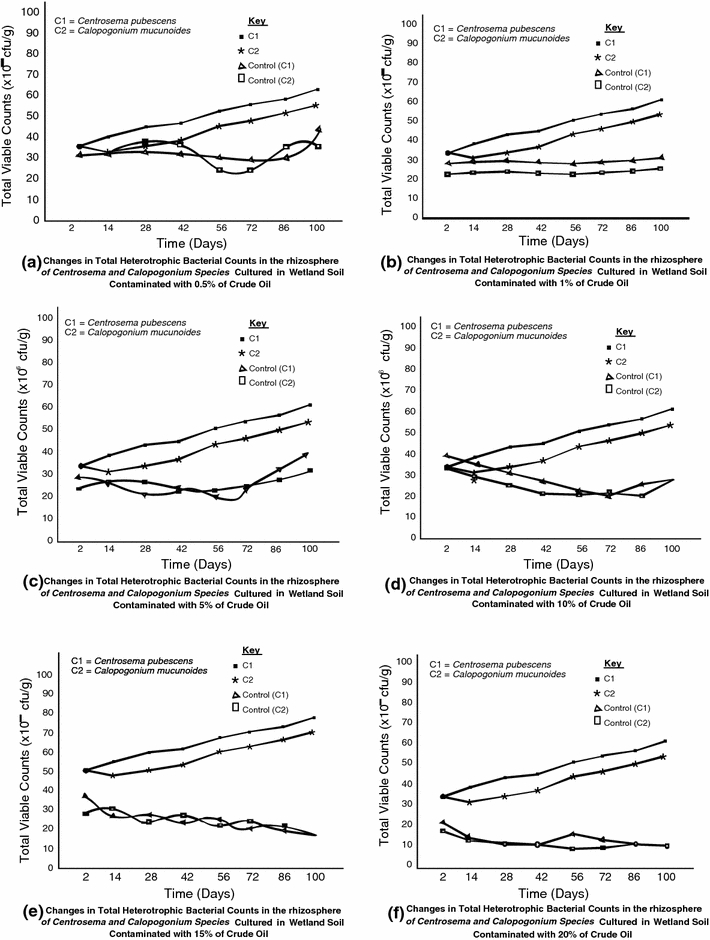
Densities of Nitrogen-fixing bacteria at different level of crude oil pollution
Fig. 4.
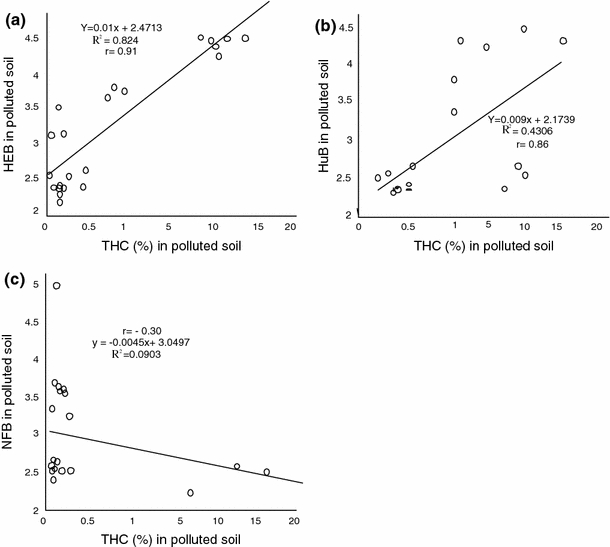
Relationship between total hydrocarbon content and the different groups of microorganisms in polluted soil. a Heterotrophic bacteria (HEB). b Hydrocarbon utilizing bacteria (HUB). c Nitrogen fixing bacteria (NFB)
Pearson’s linear plots showed that the different groups of micro-organisms exhibited variable levels of sensitivity to different levels of oil pollution. At 0.5% pollution levels, positive significant relationships were established for heterotrophic bacteria (r = 0.66), hydrocarbon utilizing bacteria (r = 0.60) and nitrogen fixing bacteria (r = 0.58) viable plate counts and days of treatment (Fig. 5). Similar results were obtained at 1% pollution level. However. Figs. 6 and 7, showed that heterotrophic bacteria exhibited very weak positive relationships at 15% (r = 0.46) and 20% (r = 0.29) pollution levels while nitrogen fixing bacteria (NFB) were negatively affected (r = −0.56) and (r = −0.43) by increase in treatment period at 15% and 20% pollution levels, respectively.
Fig. 5.
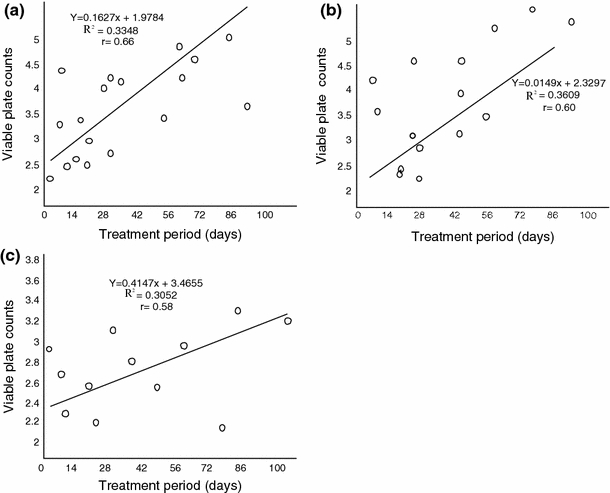
Relationship between viable plate counts (Log10 cfg−1) and treatment period at 5% pollution level. a Heterotrophic bacteria (HEB). b Hydrocarbon utilizing bacteria (HUB). c Nitrogen fixing bacteria (NFB)
Fig. 6.
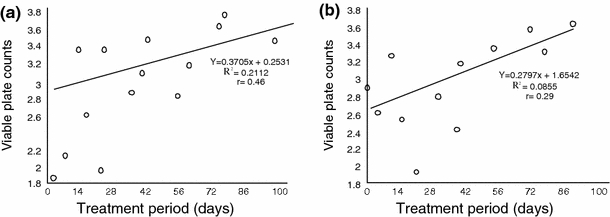
Relationship between viable plate counts (Log10 cfg−1) and treatment period (days) at 15% pollution level. a Heterotrophic bacteria (HEB). b Nitrogen fixing bacteria (NFB)
Fig. 7.
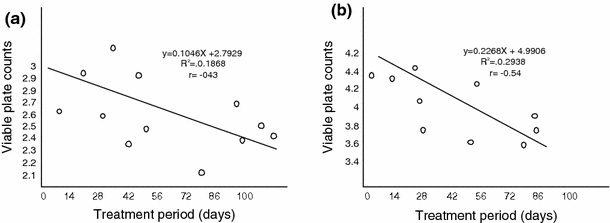
Relationship between viable plate counts (Log10 cfg−1) and treatment period (days) at 20% pollution level. a Heterotrophic bacteria (HEB). b Nitrogen fixing bacteria (NFB)
Changes in the rhizosphere microbial loads of the legumes varied between the two species of legumes tested. Variation was also noticed between legumes grown in polluted and the unpolluted soils. Microbial activities were generally higher in the unpolluted wetland soil. This observation supports the fact that the rhizosphere of higher plant is associated not only with an inanimate environment which is composed of organic and inorganic substances but also with a vast community of metabolically active micro-organisms (Rovira and Davey 1975; Alexander 1977). The number of microorganisms in the rhizosphere of Centrosema pubescens was greater than that of Calopogonium mucunoides which may be the reason why Centrosema can accumulate nitrogen at rate in excess and fixed an average nitrogen of 259 kg N/ha/year as reported by Odu et al. (1971) whereas Calopogonium mucunoides fixed an average nitrogen of 202 kg N/ha/year as reported by (Agboola and Fayemi 1972). Our study also revealed that heterotrophic bacterial isolates were dominant in both polluted and unpolluted soil compared to other physiological groups of micro-organisms, probably because heterotrophic bacteria are more numerous in soil. Some of them are fast growing and capable of utilizing a wide variety of organic compounds including hydrocarbons for survival (Stainer et al. 1976). However, hydrocarbonoclastic bacteria that were few in unpolluted soil suddenly increased when crude oil was introduced to the soil. This may be due to the fact that hydrocarbonoclastic (hydrocarbon degrading) microbial populations normally increase following the addition of oil to soil (Atlas 1981). Nevertheless, the reverse is the case in nitrogen fixing and nitrifying bacterial isolates. It was observed that, the increase in the level of pollution result in decrease in the number of nitrogen fixer and nitrifiers with time.
Expectedly, nitrogen-fixing bacteria were found in the rhizosphere of the legumes. The densities of the diazotrophs ranged from 0.85 to 2.30 × 10⁵ cfu/g. Legumes exposed to the highest (20%) level of pollution haboured the least population of nitrogen fixers. The unpolluted soil supported the highest counts of 5.44 and 5.08 × 10⁵ cfu/g in Centrosema pubescens and Calopogonium mucunoides, respectively. Although crude oil affected the multiplicity of the diazotrophs, the seven species of nitrogen fixing bacteria characterized exhibited variable degrees of oil degrading capabilities (Table 4). The screen test for the oil degrading capability of the isolates show the strong hydrocarbon degrading potential of Clostridium pasteurianum, Bacillus polymyxa, Azotobacter sp and Pseudomonas aeruginosa within the first 10 days of exposure. While Pseudomonas aeruginosa, Clostridium pasteurianum and Bacillus polymyxa maintained their strong oil degrading potential under prolong exposure to oil in wetlands, majority of the diazotrophs including strong degraders such as Azotobacter sp, as well as Derxia gummusa, Nitrosomonas and Nitrobacter with moderate hydrocarbonoclastic potential appeared to have lost their degrees of degradability. It is obvious that only certain nitrogen-fixers possess the ability to grow on media entirely free or very low in nitrogen sources as reported by Macura and Kune 1976).This fact supports the result observed in this study that Bacillus polymyxa, Azotobacter sp, Clostridium pasteurianum and Pseudomonas aeruginosa grew heavily on crude oil as the sole source of carbon and energy.
Table 4.
Crude oil-degrading capabilities of the nitrogen-fixing bacteria isolated from the wetland soil
| Incubation period | |||
|---|---|---|---|
| 1–10 days | 11–21 days | 21–30 days | |
| Clostridium pasteurianum | +++ | +++ | +++ |
| Bacillus polymyxa | +++ | +++ | +++ |
| Azotobacter sp | +++ | +++ | ++ |
| Pseudomonas aeruginosa | +++ | +++ | +++ |
| Derxia gummusa | ++ | ++ | ++ |
| Nitrosomonas sp | ++ | + | + |
| Nitrobacter sp | ++ | + | + |
+ Scanty growth, ++ Moderate growth, +++ heavy growth
The response of symbiotic nitrogen-fixing bacteria to petroleum hydrocarbon contamination in wetland soil has been determined. The great diversity in the distribution of hydrocarbonoclastic nitrogen-fixers underscores the fact that this physiological group of organisms is naturally distributed in the soil. The diverse species of bacteria isolated from oil-polluted soil could be attributed to changes in the physicochemical parameters such as the oil pH, conductivity, and organic matter and metal contents of the soil. There was a decrease in the pH of the wetland soil on contamination with crude oil. This may be due to production of acidic intermediates such as phenolic acid, organic acid, esters and fatty acid (Fenchal and Blackburn 1979; Odu 1981) through the biological activities in soil. The prevailing pH has a profound influence on the abundance of microorganisms especially the diazotrophs. The low counts of nitrogen fixing bacteria may be due to the fact that nitrifying bacteria grow best in soils with neutral to alkaline pH (6.6–8.0) and may be remarkably retarded at pH of 4.5–4.0 (Fenchal and Blackburn 1979). Therefore, decrease in the pH of the soil caused by oil pollution would result in a reduction in number of nitrifying bacteria.
In wetland soils, the rate of fixation is frequently determined by soil moisture. Grains are significant when little water is available but the rate and magnitude of the process would increase as moisture becomes abundant. Basically, there is usually a decrease in available moisture content of polluted soil. This is possibly because the volatile portion of the oil tends to evaporate while the heavier components migrate downwards under the force of gravity (Akomeo 1981). During its movement downward, the oil displaces and pushes the water down into the soil. The oil therefore occupied the soil interstices resulting in reduced moisture content of the polluted soil. There is usually an increase in total hydrocarbon content. Therefore, contaminated soils do not only have excessive carbon load but may be physiologically “dry” despite the wetly nature of wetlands. These attributes may affect the soil oxidation–reduction potential as a result of the decomposition and assimilation processes that take place when saturated hydrocarbons penetrate the soil (Toogood 1977). This affects some organisms positively and others negatively because increase in hydrocarbonoclastic and heterotrophic bacteria is found in polluted soil even some nitrogen-fixing bacteria proliferate but the reverse is the case in nitrifying bacteria (ammonia-oxidizing and nitrite-oxidizing bacteria). This is because nitrifying bacteria are sensitive to the elevated levels of metals (Table 2) and organic molecules (Okpokwasili and Odokuma 1994). Although organic matter per se does not constitute an inhibitor, its decomposition may require inorganic nitrogen and O2 thus depleting supplies of available ammonium and oxygen for nitrifiers and nutrients for plant growth. Certain alteration in soil dynamic state may induce corresponding negative changes in the growth pattern of microbes involved in mineralization and oil degradation. For example, nitrogen is limiting to degradation of oil by microbes because nitrogen and phosphorous availability are sometimes impeded by the presence of petroleum hydrocarbons. In the present study it was apparent that increased in the percentage of oil pollution from 0.5% to 20% resulted in decreased in amount of nitrogen and phosphorous available from 0.25% to 0.12% and 22.66 to 13.99 mg/kg.
This study has also shown that contamination of wetland soil with crude oil increases the amount of lead, iron, zinc, cobalt and nickel (Table 2), which may affect both the plant and microorganisms. Molybdenum, iron, calcium and cobalt are critical for the fixation reaction. They are all implicated in N2 metabolism by Azotobacter, Clostridium, Berjierinckia, algae and Klebsiella. However, their specific requirement for metabolism is often difficult to establish because iron and cobalt are less required for growth on fixed compound of nitrogen. Micro-organisms that assimilate N2 have the ability to utilize ammonium and sometimes nitrate and other combined forms of nitrogen. Ammonium salts are preferentially required and often at a greater rate than molecular nitrogen. Therefore, the presence of ammonium may inhibits nitrogen fixation because bacteria use the nitrogen salt rather than N2 from the atmosphere. In crude oil contaminated wetland soil, the ammonium-nitrogen level is not consistent probably because of its volatility while nitrite is unstable and readily converted to nitrate. For nitrate-nitrogen, the oil–free soil sample had the highest level confirming the fact that an oil-polluted soil is a nitrogen-limited environment as reported by Deni and Penninckx (1999).
The present study has revealed that symbiotic nitrogen fixing bacteria associated with legumes in wetlands are very sensitive to crude oil pollution. Most affected is the hydrocarbon degrading capability of the nitrifiers (Nitrosomonas and Nitrobacter) although the ability of the free nitrogen fixers (e.g. Azotobacter sp, Bacillus polymyxa and Pseudomonas aeruginosa) to degrade crude oil was not affected. They effectively grew and utilize crude oil as the sole source of carbon and energy. Hence these nitrogen fixing bacteria can enhance bioremediation of crude oil-polluted soil. This study has also revealed that although the diazotrophs are generally inhibited by oil pollution, some tolerant species even in small densities could enhance oil degradation in wetland soils.
Open Access
This article is distributed under the terms of the Creative Commons Attribution Noncommercial License which permits any noncommercial use, distribution, and reproduction in any medium, provided the original author(s) and source are credited.
References
- Agboola AA, Fayemi AAA. Fixation and excretion of nitrogen by tropical legumes. Agron J. 1972;64(4):409–412. doi: 10.2134/agronj1972.00021962006400040001x. [DOI] [Google Scholar]
- Akomeo UO (1981) A study of the effects of oil spills on ground water. The petroleum industry and the Nigerian environment. In: Proceedings of 1981 international seminar NNPC, Lagos
- Alexander M. Introduction to soil microbiology. 2. New York: Wiley; 1977. pp. 225–270. [Google Scholar]
- Amanchukwu SG, Obafemi A, Okpokwasili GC. Hydrocarbon degradation and utilization of a palm-wine yeast isolate. FEMs Microbiol Lett. 1989;57:151–154. doi: 10.1111/j.1574-6968.1989.tb03290.x. [DOI] [Google Scholar]
- AOAC . Methods of soil analysis. Association of official analytical chemists. 12. Washington: Association of official analytical chemists; 1975. [Google Scholar]
- Atlas RM. Microbial degradation of petroleum hydrocarbon: an environmental perspective. Microb Rev. 1981;45:180–209. doi: 10.1128/mr.45.1.180-209.1981. [DOI] [PMC free article] [PubMed] [Google Scholar]
- Bouyoucos GJ. Hydrometer method improved for making particle size analysis of soil. Agron J. 1962;54:464–465. doi: 10.2134/agronj1962.00021962005400050028x. [DOI] [Google Scholar]
- Bray RH, Kurtz LT. Determination of total organic and available forms of phosphorous in soils. Soil Sci. 1945;59:39–54. doi: 10.1097/00010694-194501000-00006. [DOI] [Google Scholar]
- Cowan ST. Cowan and Steels’ manual for the identification of medical bacteria . England: Cambridge University Press; 2003. [Google Scholar]
- Deni J, Penninckx MJ. Nitrificaion and autotrophic nitrifying bacteria in a hydrocarbon polluted soil. Appl Environ Microbial. 1999;65:4008–4020. doi: 10.1128/aem.65.9.4008-4013.1999. [DOI] [PMC free article] [PubMed] [Google Scholar]
- Fenchal T, Blackburn TH. The nitrogen circle. In: Fenchel T, editor. Bacteria and mineral cycling. London: Academic Press; 1979. pp. 76–79. [Google Scholar]
- Frank H, Althoen SC (1995) Statistics: concepts and applications. University of Cambridge Press, Cambridge, 854 pp
- Gadin C, Syratt WJ. Biological aspects of land rehabilitation. Environ Pollut. 1975;8:107–112. doi: 10.1016/0013-9327(75)90020-8. [DOI] [Google Scholar]
- Harrison JA (2003) The nitrogen cycle: of microbes and men. Visionlearning Vol. EAS-2(4). Vision@visionlearning.com, Visionlearning, Inc.
- Holt JG, Krieg NR, Sneath PHA, Stanley JT, William ST (1994) Bergey’s manual for determinative bacteriology, 9th edn. Williams and Wilkins Publisher, Baltimore, p 787
- Ile OP. Plant nutrition for sustainable production and environment. Netherlands: Kluwer Academic Publishers; 1997. pp. 751–752. [Google Scholar]
- Jackson ML. Soil chemical analysis. New Jersey: Prentice-Hall, Englewood Cliffs; 1962. pp. 110–112. [Google Scholar]
- Macura L, Kune F. Foliar microbiol. Praune. 1976;6:398–407. [Google Scholar]
- Mills LA, Breuil C, Colwell RR. Enumeration of petroleum degrading marine and estuarine microorganisms by the most probable-number method. Can J Microbiol. 1978;24:552–557. doi: 10.1139/m78-089. [DOI] [PubMed] [Google Scholar]
- Mitsch WJ, Gosselink JG. Wetlands. New York: Van Nostrand Reinhold; 1986. p. 539. [Google Scholar]
- Odu CTI. Microbiology of soil contaminated with petroleum hydrocarbons I. Extent of contamination and some soils and microbial properties after contamination. J Inst Petrol (London) 1972;20(1):2–8. [Google Scholar]
- Odu CTI. Microbiology of soils contaminated with petroleum hydrocarbons II. Natural reclamation and rehabilitation of soils affected. J Inst Petrol (London) 1972;20(1):77–92. [Google Scholar]
- Odu CTI (1981) Degradation and weathering of crude oil under tropical conditions. The petroleum industry and nigerian environment. In: Proceedings of International seminar, NNPC, Lagos, pp 143–153
- Odu CTI Fayemi AAA, Ogunwal JA. Effect of pH on the growth, nodulation and nitrogen fixation of Centrosoma pubescens and Stylosanthesgracillis. J Sci Food Agric. 1971;22:57–59. doi: 10.1002/jsfa.2740220203. [DOI] [Google Scholar]
- Okpokwasili GC, Odokuma LO. Tolerance of nitrobacter to toxicity of some Nigerian crude oils. Bull Environ Contam Toxicol. 1994;53:388–393. doi: 10.1007/BF00197826. [DOI] [PubMed] [Google Scholar]
- Rovira AO, Davey P. Biology of the rhizosphere. In: Burges A, Losy FR, editors. Soil microbiology. New York: Academic Press; 1975. pp. 419–499. [Google Scholar]
- Sokal RR, Rohlf FJ. Biometry. New York: Colt Freeman and Company; 1995. [Google Scholar]
- Stainer RJ, Adelberg EA, Ingraham JL. The microbial world. 4. New Jersey: Prentice Hall, Englewood Cliffs; 1976. [Google Scholar]
- Toogood SA (1977) Effects of oils spills on physical properties of soils. In: Reclamation of agricultural soil after oil spills. Part 2 University of Alberta, Edmonton, pp 108–118
- Udo A (1986) Laboratory manual of agronomic studies in soil, plant and microbiology. Department of Agronomy, University of Ibadan, Ibadan, Nigeria, 833 pp
- Udosen ED (1991) Aqua: terrestrial environmental pollution studies of inorganic substances from two industrial firms in Akwa Ibom State. Ph.D. Thesis, University of Calabar, 575 pp
- Walkey A, Black IAL. An examination of the Degtjeref£ method for determining soil organic matter and a proposed modification of the chromic and titration method. Soil Sci. 1934;37:29–38. doi: 10.1097/00010694-193401000-00003. [DOI] [Google Scholar]
- Zuberer DA. Recovery and enumeration of viable bacteria. In: Weaver RW, Angle JS, Bottomly PJ, editors. Methods of soil analysis, Part 2. Microbial and biochemical properties. Madison: Soil Society of American Books; 1994. pp. 119–144. [Google Scholar]


