

Abstract
Spinal cord injury (SCI) is medically and socioeconomically debilitating. Currently, there is a paucity of effective therapies that promote regeneration at the injury site, and limited understanding of mechanisms that can be utilized to therapeutically manipulate spinal cord plasticity. MicroRNAs (miRNAs) constitute novel targets for therapeutic intervention to promote repair and regeneration. Microarray comparisons of the injury sites of contused and sham rat spinal cords, harvested 4 and 14 days following SCI, showed that 32 miRNAs, including miR124, miR129, and miR1, were significantly down-regulated, whereas SNORD2, a translation-initiation factor, was induced. Additionally, 3 miRNAs including miR21 were significantly induced, indicating adaptive induction of an anti-apoptotic response in the injured cord. Validation of miRNA expression by qRT-PCR and in situ hybridization assays revealed that the influence of SCI on miRNA expression persists up to 14 days and expands both anteriorly and caudally beyond the lesion site. Specifically, changes in miR129-2 and miR146a expression significantly explained the variability in initial injury severity, suggesting that these specific miRNAs may serve as biomarkers and therapeutic targets for SCI. Moreover, the pattern of miRNA changes coincided spatially and temporally with the appearance of SOX2, nestin, and REST immunoreactivity, suggesting that aberrant expression of these miRNAs may not only reflect the emergence of stem cell niches, but also the reemergence in surviving neurons of a pre-neuronal phenotype. Finally, bioinformatics analysis of validated miRNA-targeted genes indicates that miRNA dysregulation may explain apoptosis susceptibility and aberrant cell cycle associated with a loss of neuronal identity, which underlies the pathogenesis of secondary SCI.
Keywords: spinal cord contusion, microRNA, dysregulation, neuronal plasticity, cell cycle failure, secondary SCI
1
Current understanding of the mechanisms underlying spinal cord injury (SCI) is limited, and traditional therapeutic methods lack a molecular approach to prevent the loss of sensory function and paralysis. Effective rehabilitation will require a multifaceted therapeutic strategy that promotes tissue regeneration, reduces cell death in the secondary injury zone, and improves native function through behavioral training. To accomplish this, it is imperative to uncover the upstream genetic regulators responsible for coordinating the acute inflammatory and apoptotic responses driving secondary spinal cord injury, in addition to the chronic inflammation resulting from uncontrollable nociceptive stimulation, that impairs functional recovery through reduction of spinal cord plasticity (Grau et al., 2004; Grau et al., 2006; Hook et al., 2009). Therapeutic manipulation of these mechanisms, as well as other novel genetic and biochemical pathways, could represent effective treatments for improving functional recovery, minimizing pathological damage, and attenuating neuropathic pain.
Other investigators have previously reported that altered gene expression significantly contributes to the pathogenesis of secondary SCI (Nesic et al., 2002; Bareyre and Schwab, 2003; De Biase et al., 2005), but there is limited knowledge of the regulatory networks that control gene expression. MiRNAs are short, ∼22 nucleotide non-coding small RNAs that regulate gene expression by controlling protein translation or destabilizing mRNA transcripts (Alvarez-Garcia and Miska, 2005; Zamore and Haley, 2005). Individual miRNAs coordinate the expression of several hundred protein-coding genes, to affect a specific biological endpoint. In addition, many miRNAs exhibit remarkable phylogenetic similarities, and often complete evolutionary conservation (Lee et al., 2007), which is ideal for studying their effects and clinical relevance in animal models, such as Rattus norvegicus. Consequently, miRNAs may constitute one therapeutic target to alter the cellular proteome in the damaged spinal cord, to promote repair and regeneration. Initial reports on miRNA dysregulation following SCI have outlined expression changes in numerous miRNAs at time points ranging from 1 hr to 7 days; however, these analyses were strictly limited to the injury site, primarily focused on inflammatory and apoptotic mediated changes that dominate the early response to injury, and only reported localization patterns for miR124a and miR223 (Liu et al., 2009; Nakanishi et al., 2010).
The current study focused on a time course ranging from 24 hours to 14 days post-SCI, to evaluate the relationship between miRNA expression and functional recovery following trauma. We also examined miRNA changes both rostral and caudal to the injury site, as significant changes in rostral/caudal gene expression have also been observed in response to a spinal cord contusion (De Biase et al., 2005). Likewise, we analyzed the functional roles of genes known to be regulated by significant miRNAs to determine the possible global effects of SCI-mediated miRNA dysregulation. Finally, we investigated the temporal relationship between miRNA profiles and expression patterns of biomarkers that indicate reemerging plasticity and loss of cellular identity following SCI.
2. Experimental Procedures
2.1 Subjects
The subjects were male Sprague–Dawley rats (Rattus norvegicus) obtained from Harlan (Houston, TX). The rats were approximately 90-110 days old (300-350 g), and were individually housed in Plexiglas bins [45.7 (length) × 23.5 (width) × 20.3 (height) cm] with food and water continuously available. To facilitate access to the food and water, extra bedding was added to the bins after surgery and long mouse sipper tubes were used so that the rats could reach the water without rearing. Bladders were manually expressed in the morning (8-9:30 a.m.) and evening (6-7:30 p.m.) until subjects regained bladder control, which was operationally defined as three consecutive days with an empty bladder at the time of expression. Rats were maintained on a 12-hr light/dark cycle. All procedures described in these experiments were reviewed and approved by the Texas A&M University Laboratory Animal Care Committee.
2.2 Surgery
Subjects received a contusion injury using the Multicenter Animal Spinal Cord Injury Study (MASCIS) Impactor device (Gruner, 1992; Constantini and Young, 1994). Subjects were anesthetized with isoflurane (5%, gas). Once a stable level of anesthesia was achieved the inspired concentration of isoflurane was lowered to 2-3% and an area extending approximately 4.5 cm above and below the injury site was shaved and disinfected with iodine. A 7.0 cm incision was made over the spinal cord. Next, two incisions were made on either side of the vertebral column, extending about 3 cm rostral and caudal to the T12-T13 segment. The dorsal spinous processes at T12-T13 were removed (laminectomy), and the spinal tissue exposed. The dura remained intact. The vertebral column was fixed within the MASCIS device, and a moderate injury was produced by allowing the 10-g impactor (outfitted with a 2.5 mm tip) to drop 12.5 mm. T12-T13 level contusion models have been routinely used by members of our group to define spinal cord learning circuits and molecular mechanisms involved with recovery of function (e.g., (Ferguson et al., 2008; Brown et al., 2011; Hook et al., 2011)). Lesions at this level result in well-defined and replicable sensory-motor deficits, and we therefore chose to utilize contusion at this level to also examine changes in miRNA expression. Contusions at the T12-T13 level resulted in mean BBB (Basso, Beattie, and Bresnahan scale (Basso et al., 1995)) score of 2.75 +/- 0.49 (mean +/- SEM), indicating significant loss of locomotor function. There were no statistically significant differences in BBB scores between the various contusion groups. Sham controls received a laminectomy, but the cord was not contused with the MASCIS device. Following surgery, the wound was closed using Michel clips. To help prevent infection, subjects were treated with 100,000 units/kg Pfizerpen (penicillin G potassium) immediately after surgery and again 2 days later. For the first 24 hours after surgery, rats were placed in a recovery room maintained at 26.6 °C. To compensate for fluid loss, subjects were given 2.5 ml of saline after surgery. Subjects were given about 20-24 hr to recover from surgery, and during recovery, additional saline was given to maintain hydration.
2.3 Assessment of Locomotor Function
Locomotor behavior was assessed for up to 14 days post-surgery using the BBB scale in an open enclosure (99 cm in diameter, 23 cm deep). Baseline motor function was assessed on the day following surgery. Because rodents often remain motionless (freeze) when introduced to a new apparatus, subjects were acclimated to the observation fields for 5 min per day, for 3 days prior to surgery. Each subject was placed in the open field, observed for 4 min, and scored for locomotor behavior using the procedure developed by Basso et al. (1995). Care was taken to ensure that the investigators' scoring behavior had high intra- and inter- observer reliability (all r's > 0.89), and that they were blind to the subject's experimental treatment.
2.4 Isolation of RNA for Microarray and qRT-PCR Quantification
Subjects were anesthetized 24 hrs, 4 days, or 14 days after injury and a 1 cm long segment of the spinal cord from the lesion center, as well as 1 cm rostral and caudal to the injury epicenter, was removed and flash-frozen in liquid nitrogen. Specimens were crushed and RNA was isolated using the TRIzol (Invitrogen; Carlsbad, CA) protocol. MiRNA was then quantified using a Bioanalyzer 2100 (Agilent Technologies; Carmel, IN) and stored at -80 °C.
2.5 MiRNA Microarray Labeling and Hybridization
MiRNA expression of contused and sham spinal cords were compared using dual channel arrays on a HS 400 Pro hybridization platform (TECAN; Research Triangle Park, NC). Extracted miRNA from all sham controls were pooled in equal concentrations to eliminate outliers from control expression, and compared to each contused and sham sample individually. Dye swapping was utilized to eliminate bias, and a total of 12 arrays were hybridized according to the EXIQON miRCURY™ locked nucleic acid (LNA) microRNA Array Power Labeling kit protocol. After hybridization, arrays were scanned using a GenePix 400B scanner (Molecular Devices; Union City, CA), and the scanner gain and sensitivity was set so that the overall ratio of Cy3 to Cy5 intensity across the array was set at 1. Array features that were irrelevant to the analysis such as blank spots, Cy3 control features, and miRNA features for all species except rat, human, and mouse, were removed before statistical analyses. Data were exported to and analyzed for significance using GeneSifter software (Geospiza; Seattle, WA). Significantly expressed miRNAs were grouped according to fold change in expression and by genome clustering.
2.6 Quantitative RT-PCR for miRNA
Microarray data was validated with quantitative reverse transcription (qRT)-PCR for miRNAs, based on the protocol of the miRCURY™ LNA microRNA Universal RT-PCR system (EXIQON; Woburn, MA). RNA samples were converted to cDNA, and qRT-PCR was performed using a MyiQ™ Single-Color Real-Time PCR Detection System (Bio-Rad, Hercules, CA). Forward and reverse primers (EXIQON; Woburn, MA) for hsa-miR124, hsa-miR223, hsa-miR1, hsa-miR21, hsa-miR129-2, hsa-miR129-1, and hsa-miR146a, were used for PCR amplification, and real time data was normalized using U6 RNA. Relative miRNA expression was determined by calculating the mean difference between cycle threshold of the miRNA from the U6 small nuclear RNA (U6SNB) normalized control for each sample [Δ cycle threshold (ΔCT)] within each sample group (samples with same miRNA ID, time, and condition parameters) and expressed as -ΔCT for relative change in expression. Sample means that were greater than ± 2 standard deviations from the mean ΔCT, or ± 3 standard deviations from the mean ΔCT after exclusion, were considered outliers and removed from the analysis. Of the 425 data points in 84 groups used in the analysis, only 17 data points were excluded according to this criteria, and no more than one data point in any individual experimental group was excluded. Fold change in miRNA expression was determined by calculating the difference between the mean ΔCTs of contused and sham sample groups at the same time point and spinal cord location (ΔΔCT), and expressed as fold-change (2-ΔΔCT).
2.7 In situ hybridization & immunofluorescence analyses
For immunofluorescence and in situ hybridization analyses, 24 hrs, 4 days or 14 days after injury subjects were deeply anesthetized with pentobarbital (100 mg/kg, i.p.), and perfused (intracardially) with 4% paraformaldehyde in 0.1 M saline buffer. A 1 cm long segment of the spinal cord was taken from the lesion center, as well as 1 cm rostral and caudal to the injury epicenter, and prepared for cryostat sectioning. The tissue was then sectioned to a thickness of 30 microns, in either a longitudinal or coronal orientation, and mounted onto suprafrost plus slides (VWR Scientific; West Chester, CA). In situ hybridization was conducted using biotin labeled LNA-modified oligonucleotide probes (EXIQON; Woburn, MA) according to the EXIQON instructions, followed by incubation with rhodamine avidin D for 1 hour at 4 °C. Slides were mounted and nuclear stained using VectaShield mounting medium with DAPI (Vector Labs; Burlingame, CA). Immunofluorescence was performed according to standard methodologies using monoclonal mouse anti-nestin, and polyclonal rabbit antibodies for glial fibrillary acidic protein (GFAP), RE1-silencing transcription factor (REST), sex determining region Y-box 2 (SOX2), and neurofilament (Abcam; Boston, MA). The secondary antibodies utilized included goat anti-mouse Alexafluor® 488 and goat anti-rabbit Alexafluor® 594 (Invitrogen; Eugene, CA). All primary and secondary antibodies were used at 1:200 and 1:300 dilutions, respectively. All photomicrography was conducted using an Olympus FSX100 microscope with imaging software (FSX-BSW v.2.01, Olympus), or on an Olympus BX60 microscope.
2.8 Data analyses
Microarray-derived data were analyzed by t-tests with Benjamini and Hochberg FDR corrections for multiple comparisons, using GeneSifter (Geospiza; Seattle, WA). All other data were analyzed using SPSS software version 18 (SPSS; Chicago, IL). MicroRNA expression, verified by qRT-PCR, was analyzed by multivariate analysis of variance (ANOVA) using Pillai's trace statistic, and further analyzed using post hoc univariate ANOVA and Fisher's least significant difference (f-LSD) test. Other data were analyzed using ANOVAs followed by post hoc f-LSD using planned comparisons. In all cases, the priori α value was set at 0.05. Data were expressed as mean ±SEM, as indicated in the figure legends.
The statistical relationship between injury severity and change in miRNA expression after SCI (the R2, a goodness of fit) was determined using least squares regression analysis of explained variance, with BBB score at 24 hrs after surgery as the independent variable, and difference in cycle threshold change (-ΔΔCT; between contused subjects at 4 and up to 14 days post-SCI, and the mean of sham controls) as the dependent variable. Correlations between pairings of miRNAs were determined by Pearson's product-moment correlation (PPMC) using −ΔΔCT values of the paired miRNAs at 4 days post-SCI as separate independent variables. The priori α value was set at 0.05, and data were expressed as the difference in cycle threshold change of each contused subject relative to the mean cycle threshold change of sham controls (-ΔΔCT= ΔCTX̄ sham - ΔCTcontused), as indicated in the legend of Figure 3.
Figure 3.
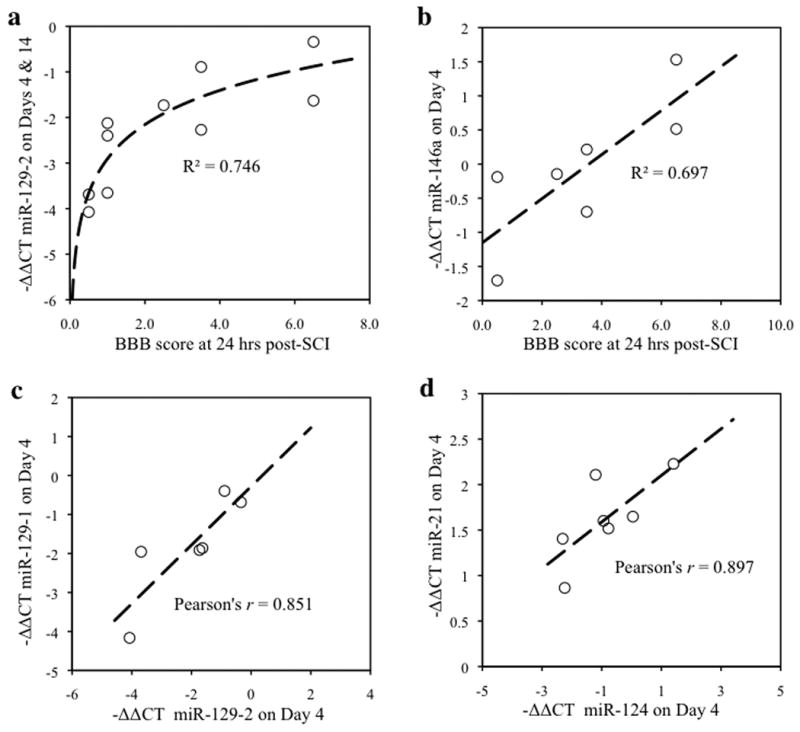
Regression analyses to assess the relationship between miRNA expression and initial injury severity. a,b, The x-axis represents the Basso, Beattie, and Bresnahan (BBB) score for baseline locomotor function, 24 hours following spinal cord contusion, and the y-axis depicts the difference in cycle threshold change (-ΔΔCT; a ΔΔCT value of 1 indicates a 2-fold change in miRNA expression) between contused subjects and sham controls. Best-fit curves and correlation constants were generated using least squares regression analysis. Regression analysis indicates that 74.5% of the variation in the expression of miR129-2 (-ΔΔCT) on Days 4 and 14 is explained by the variation in BBB scores, 24 hours following SCI (Logarithmic regression R2=0.746, F(1,8)=23.437, p <0.001; a), and 69.7% of the variation in miR146a on Day 4 is explained by variation in the BBB scores, 24 hours following SCI (Linear Regression R2=0.697, F(1,4)=9.189, p<0.05; b). c,d, Correlation analyses also confirmed that miRNAs correlate with each other. The x-axis and y-axis each denote −ΔΔCT values for different miRNAs. Pearson's correlations indicated significant correlations between miR129-1 and miR129-2 (Pearson's r = 0.851, p<0.05; c), and between miR124 and miR21 (Pearson's r = 0.897, p<0.05; d), suggesting that these pairs of miRNAs may be co-regulated. Data are represented as the difference in cycle threshold change of each contused subject relative to the mean cycle threshold change of sham controls (-ΔΔCT= ΔCTX̄ sham - ΔCTcontused).
Bioinformatics were preformed using validated gene targets of selected miRNAs from the miRWALK online database (http://www.ma.uni-heidelberg.de/apps/zmf/mirwalk/, 2010). Gene cross-referencing was performed using a Visual Basic/Microsoft Excel based bioinformatics macro script developed within our laboratory, available upon request. Results were generated into a table listing the miRNAs of interest in separate column headings, and the gene targets for each studied miRNA that were regulated by 2 or more of the 6 total investigated miRNAs were listed under the column heading corresponding to the regulating miRNAs. This list was indexed in alphabetical order by gene, with each gene having a unique table row, to cross-list all miRNAs targeting that specific gene. Each cross-referenced list was grouped according to common gene targets, with 2 groups being formed: one for miR1 and miR124, and a second for miR21 and miR146a. Each grouped list contained only those genes common between both constituent miRNAs, and analyzed for functional annotation in DAVID Bioinformatics Resources for functional annotation (Dennis et al., 2003; Huang da et al., 2009).
3. Results
3.1 Identification and quantification of significant changes in miRNA expression
Initially, miRNA expression was quantitatively assessed in total RNA samples from animals harvested 4 and 14 days post SCI (5 contused and 5 sham animals each) using a miRNA microarray approach (for details, see methods). Microarray data were subjected to exploratory analyses using a 2-way ANOVA (SCI lesion condition × Time) with a Benjamini and Hochberg correction for multiple comparisons (False-discovery rate (FDR)-set at α=0.1, fold-change cutoff, 1.8-fold). We identified 31 statistically significant, dysregulated small RNAs (30 miRNAs and 1 small nuclear RNA, SNORD2) that exhibited a significant main effect of SCI. Most miRNAs were down-regulated and despite an overall significant main effect of SCI, exhibited a greater decline at 14 days rather than at 4 days (e.g., miR124, miR129-2, miR129-1, Figure 1a). Conversely, the relatively few small RNAs that exhibited a statistically significant increase, tended to exhibit a greater increase at 4 days post SCI, compared to 14 days (e.g., miR21, SNORD2, Figure 1a). Despite this, hierarchical cluster analysis of the FDR-controlled, statistically significant small RNAs indicated that the 4 and 14-day sham controls clustered together within one linkage group, and SCI groups clustered together within a second linkage group, reaffirming the ANOVA-identified dominant main effect of SCI (Figure 1b, 1c). As a result, we collapsed the dimension of time and conducted t-tests with Benjamini and Hochberg FDR corrections to initially screen for SCI-regulated miRNAs (FDR-adjusted α = 0.05, fold-change cutoff, 1.5-fold). Results indicated a group of 36 small non-coding RNAs that were significantly dysregulated following SCI, 4 up-regulated and 32 down-regulated.
Figure 1.
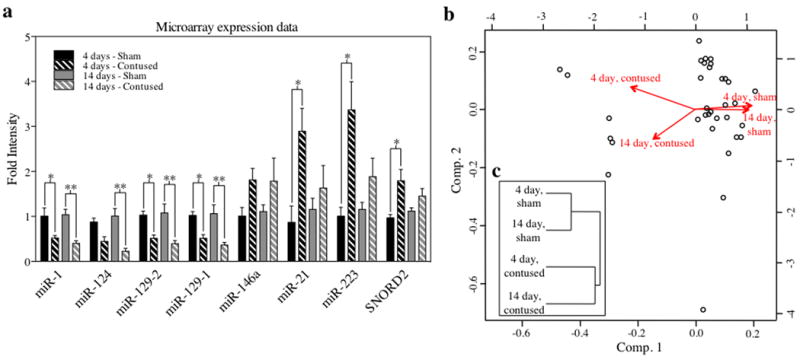
Analysis of microarray expression data indicates that SCI results in significant dysregulation of small RNAs. a, Bar graph depicting expression of significantly dysregulated miRNAs and other small RNAs (e.g. SNORD2) over time and experimental condition. The y-axis depicts fold change in intensity relative to a complex RNA target (a composite of equal RNA concentrations from all sham-lesioned animals at 4 and 14 days post-surgical manipulation). Data are expressed as ±SEM, with asterisks indicating statistical significance compared with sham controls (*p < 0.05, **p < 0.01). b,c, A hierarchical cluster dendogram of microarray data depicting principal component analysis (b), along with Euclidean distance and linkage (c), denotes that while both sham groups are similar to each other and both contused groups are likewise similar to each other, in terms of miRNA expression profiles, sham groups exhibited a low association with contused groups.
Additional studies were confined to the 3 miRNAs (miR223, miR21, miR146a) exhibiting the greatest increase and 4 miRNAs (miR124, miR1, miR129-2, miR129-1) exhibiting the greatest decrease in expression, respectively. The expression of selected miRNAs post-SCI was further examined by qRT-PCR in order to validate microarray results, and expand the study to investigate expression changes present at 24 hrs and in regions 1 cm rostral and caudal to the injury site (Figure 2). Multivariate ANOVA of qRT-PCR data indicated a significant interaction effect between surgery condition and time (Pillai's Trace Statistic, F(10,26) = 2.722; p<0.02). In addition, post hoc univariate ANOVA indicated a significant main effect of surgery condition on miR124 and miR1 expression (F(1,16) = 6.774, p<0.02 and F(1,16) = 7.319, p<0.02, respectively), and a significant interaction effect between time and surgery condition on miR21 and miR146a expression (F(2,16) = 8.918, p<0.01 and F(2,16) = 3.964, p<0.05). Furthermore, post hoc least significant difference t-tests indicated that both miR124 and miR1 exhibited significant down-regulation at 4 days post-SCI (pmiR124<0.005 and pmiR1<0.05), as well as at 14 days (pmiR124<0.01 and pmiR1<0.05; Figure 2a). In contrast, miR21 was significantly up-regulated at 4 days and down-regulated at 14 days (p<0.001 and p<0.01, respectively). Interestingly, close examination of expression data for miR146a reveals that, although the interaction effect between time and condition results in a significant trend of increasing miR146a expression in contused subjects over the time course of 24 hrs to 14 days post-SCI (Student's 2-tailed t-test, p<0.05), none of the individual time points exhibited a significant change by surgery condition. The primary contributors to the significance of this trend are decreased miR146a expression at 24 hrs and increased expression at 14 days, relative to sham controls (Student's 2-tailed t-test, p = 0.064 and p = 0.114, respectively).
Figure 2.
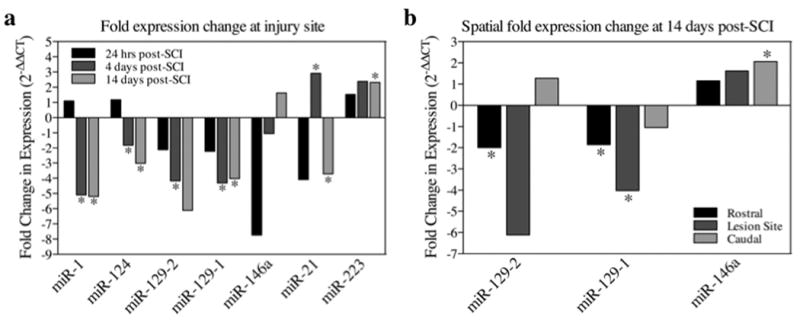
Bar graphs depicting qRT-PCR analysis of miRNA expression at the lesion site (a) and in regions rostral and caudal to the lesion (b) following SCI. a,b, The x-axis denotes miRNA of interest, and the y-axis denotes the fold expression change using the formula 2-ΔΔCT, where ΔΔCT represents the mean difference of sham and contused ΔCT values. Animals received either a T12-T13 spinal contusion or laminectomy only (sham), and sacrificed at 24 hrs, 4 days, or 14 days post-surgery. The harvested cords were analyzed for miRNA expression within the injury site (a) and in spinal cord sections 1 cm rostral and caudal to the injury site (b). Data are expressed as a magnitude of change (a value of zero equates to no change between surgery conditions, positive values equate to increases in expression following SCI, and negative values vice versa), with asterisks indicating significance (f-LSD) compared with sham controls; p values are as indicated in the text.
Conversely, not only did miR223 lack multivariate significance, but post-hoc univariate ANOVA also failed to indicate a significant main effect of spinal cord injury on miR223 expression (F(2,16) = 3.964, p<0.09), although these data do suggest a trend towards significance. Preliminary microarray and qRT-PCR data (unpublished data) indicated that miR223 was only significantly up-regulated at 4 days, but this could not be validated. Therefore, although miR223 showed significance at 14 days (Student's 2-tailed t-test, p<0.02; Figure 2a) in the qRT-PCR assay for this study, its inconsistence with previous observations, along with its high variability in expression between both individual specimens and separate assays, led us to exclude it from further analysis.
Mature miR129-2 and miR129-1 transcripts share nearly identical sequence homology (a one nucleotide difference; they are 3′ products formerly denoted as miR129-3p and miR129*, respectively) and exhibited similar expression patterns, so they were analyzed together as a separate group. The multivariate ANOVA revealed an overall significant main effect of spinal cord lesion (Pillai's Trace Statistic, F(2,22) = 5.374; p<0.02). Furthermore, post hoc univariate ANOVA also indicated a significant main effect of condition for both miR129-2 and miR129-1 (F(1,23) = 8.721, p<0.01 and F(1,23) = 9.097, p<0.01, respectively). Student's 2-tailed t-tests of expression changes at individual time points confirmed significant down-regulation at 4 days for both miR129-2 and miR129-1 (p<0.05, for both), but only for miR129-1 at 14 days (p<0.02; Figure 2a). In addition, miR129-2 and miR129-1 both exhibited a significant decrease in expression in sections rostral to the injury site at 14 days post-SCI (p<0.05, for both; Figure 2b).
3.2 Impact of injury severity on miRNA expression
To explore the possibility that initial injury severity is predictive of dysregulated miRNA expression, locomotor function was routinely observed following surgery and scored using the Basso, Beattie, and Bresnahan (BBB) scale (Basso et al, 1995). Regression analysis of explained variance revealed that 74.6% of the variation in the expression of miR129-2 (-ΔΔCT) on Days 4 and 14 was explained by the variation in initial BBB scores (logarithmic R2=0.746, F(1,8)=23.437, p<0.001; Figure 3a), while 69.7% of the variation in the expression of miR146a on Day 14 was explained by variation in BBB score at 24 hrs (R2=0.697, F(1,5)=8.585, p <0.05; Figure 3b). Although no other miRNAs were statistically related to injury severity, two instances of significant correlation between miRNAs were found. There was a statistically significant correlation between the expression of miR129-1 and miR129-2 (Pearson's r = 0.851, p<0.05; Figure 3c), and between miR124 and miR21 (Pearson's r = 0.897, p<0.05; Figure 3d), suggesting that these pairs of miRNAs may be co-regulated.
3.3 MiRNA Localization Patterns and Cellular Identity following SCI
Using in situ hybridization assays, we observed that miRNAs sensitive to spinal cord injury exhibit divergent temporal and spatial patterns. Initially, the possibility of false positives resulting from procedural abnormalities and high background was assessed using a scrambled miRNA (nonsense control), whose hybridization was acceptably minimal (i.e., at near background levels; Figure 4b, see insert), even within the lesion site. MiR124 expression at 4 days post-SCI in sham controls was largely confined to laminae VI-IX, with minimal expression in the dorsal horn (Figure 4a). At 14 days post-SCI, miR124 exhibited low expression within the injury site compared to the sham control, but was present in intact central grey matter tracts (Figure 4b, 4c), indicating a population of surviving neurons. Similarly, miR1 was down-regulated in grey matter at the injury site of both 4 and 14 day specimens relative to sham controls, with expression being confined to peri-lesion tissue (Figure 4d). MiR1 expression localized primarily to the neuropil, and to the soma of small cells, while hybridization was absent in large neuronal-like cells (Figure 4e). Consistent with the qRT-PCR results, miR21 expression was decreased relative to controls at 14 days, but dramatically increased at 4 days (Figure 5a, 5b). Coincidentally, our laboratory previously reported that miR21 acts as an anti-apoptotic factor in fetal mouse cerebral cortex-derived progenitors (Sathyan et al., 2007), so the significant indication of heavy miR21 up-regulation at 4 days was of particular interest. In order to determine if this marked increase was due to a neural pro-survival response or from the presence of neural progenitors, immunofluorescence analysis for nestin (a neural progenitor factor) was performed immediately upon completion of the in situ hybridization protocol. Interestingly, expression of both nestin and miR21 increased substantially in central grey matter bands near the lesion site relative to sham controls, and exhibited a high degree of co-localization (Figure 5a). Coronal sections of the lesion site indicated that the increased miR21 expression observed in longitudinal sections extends throughout the grey matter, including both the dorsal and ventral horns, with low expression observed in the surrounding white matter (Figure 5b). Furthermore, expression of both miR21 and nestin was largely absent in peri-lesion tissue, suggesting that the sharp increase in miR21 expression, validated with qRT-PCR, was primarily bound to lesion-associated, immature neural cells (Figure 5a).
Figure 4.
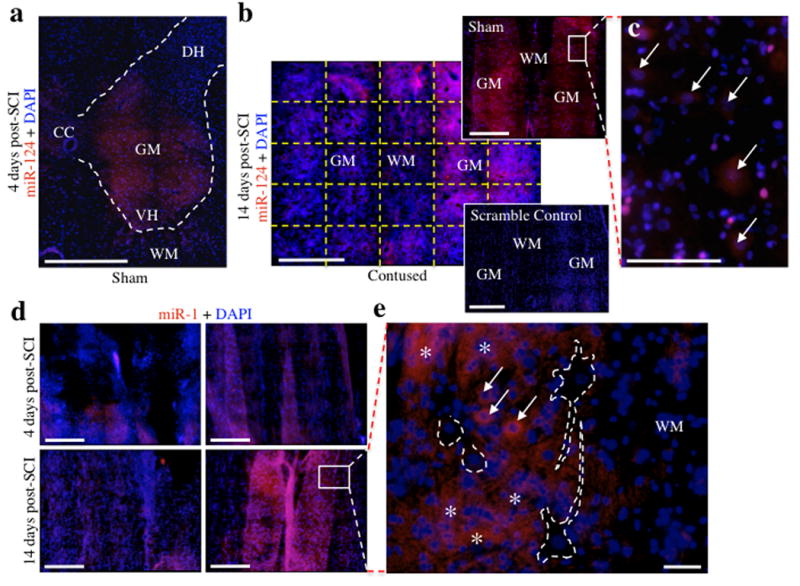
In situ hybridization analyses for miR124 and miR1 expression following SCI. a-e, Red fluorescence is indicative of miRNA expression, whereas blue fluorescence represents DAPI nuclear staining. Each micrograph is a composite of 25 separate micrographs per fluorescence channel at 20× magnification tiled together. a, Coronal localization of miR124 in sham controls was largely confined to laminae VI-IX of the grey matter, with minimal expression observed in the white matter. Dashed lines demarcate the grey matter boundaries. b, MiR124 exhibits reduced expression at the injury site of contused animals at 14 days post-SCI and localizes to grey matter tracts (hybridization pattern was similar at 4 days; data not shown). The scrambled miRNA control exhibited virtually undetectable levels of hybridization confirming the validity of the observed hybridization, as well as with other miRNA-targeted probes. Dashed yellow lines illustrate the orientation of the tiled micrographs stitched together to form one image. c, High magnification photomicrograph of sham control in (b) shows that miR124 localizes primarily to soma of large neuronal cells (indicated by arrows) in the grey matter of control animals. This neuronal hybridization is lost following SCI. d, MiR1 expression is reduced at the injury site of contused animals at both 4 and 14 days post-SCI and localizes to grey matter tracts. Expression in contused specimen was confined to peri-lesion tissue. e, High magnification photomicrograph of sham control in (d) indicates that miR1 expression is bound primarily to the neuropil with minimal expression in large neuronal cells. Arrows indicate cytoplasmic presence of miR1 in presumptive glial cells and asterisks denote miR1-rich areas of the neuropil. Dashed lines demarcate large, presumptive neuronal cells that do not express miR1. Abbreviations, central canal (CC), dorsal horn (DH), grey matter (GM), ventral horn (VH), and white matter (WH). Scale bars, 500 μm (a, b, d) and 50 μm (c, e).
Figure 5.
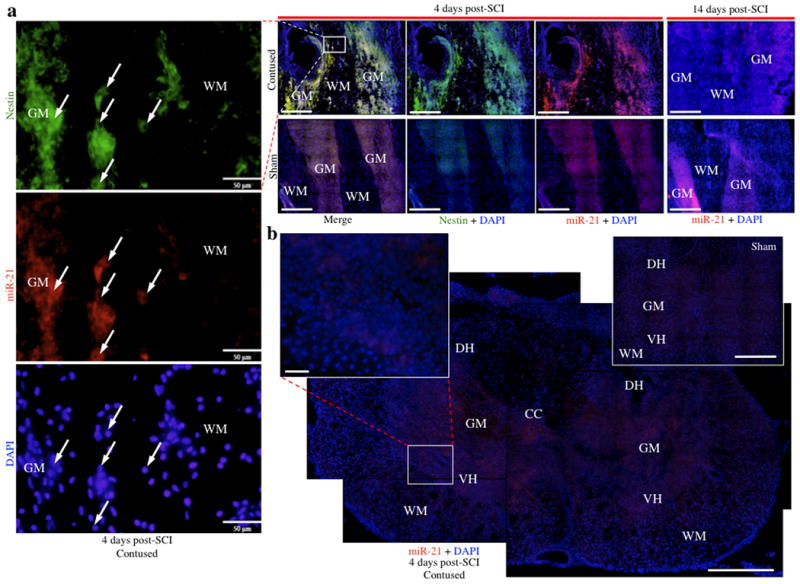
In situ hybridization analyses for miR21 expression at 4 and 14 days following SCI. a, Substantially increased expression of miR21 was observed within the grey matter at 4 days in contused animals and co-localized with nestin, indicated by yellow fluorescence (red = miR21; green = nestin). High magnification photomicrograph excerpts from the lesion site at 4 days show that nestin and miR21 co-localize to cells with small nuclei, and nestin appears globular as opposed to the fibrous morphology typically associated with astrocytes. Furthermore, miR21 is only observed within grey matter at the lesion site, with low peri-lesion expression. In contrast, decreased miR21 expression relative to sham animals was observed within grey matter tracts at the injury site 14 days post-SCI. b, MiR21 localizes throughout the grey matter tissue of coronal sections, including both the dorsal and ventral horns, with minimal expression in white matter. The coronal image of the lesion site is an overlaid composite of 4 coronal images of the same contused section, each containing 25 micrographs at 20× magnification stitched together per fluorescence channel, for an overall total of 200 micrographs stitched together to form one image (25 images per channel × 2 channels × 4 stitched coronal micrographs = 200 images). Abbreviations, central canal (CC), dorsal horn (DH), grey matter (GM), ventral horn (VH), and white matter (WH). Scale bars, 500 μm (a, b) and 50 μm (high magnification excerpts a, b).
The hybridization patterns for miR129-2 and miR129-1 at 4 days post-SCI were similar, comprised of high expression in cells near the lesion but low expression in peri-lesion tissue, particularly in white matter, relative to sham controls (Figure 6a, 6b). Specifically, in sham-lesioned control animals, expression of miR129-1 was observed within the cytoplasm of large neuronal-like cells (Figure 6c). In contrast, at 14 days post-lesion, miR129-1 expression was virtually undetectable within the lesion site, and was notably present only in peri-lesion grey matter tracts (Figure 6d). In addition, miR129-1 and miR129-2 were both negatively regulated in sections rostral to the injury site at 14 days, with expression primarily limited to grey matter tracts, and low expression throughout the white matter.
Figure 6.
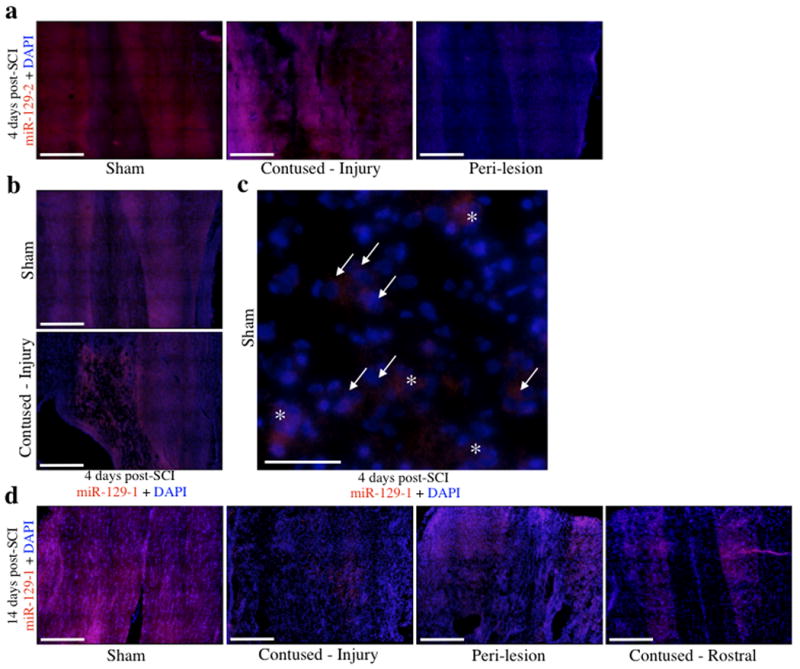
In situ hybridization for miR129-2 and 129-1 at statistically significant time points following SCI as determined from qRT-PCR. a-d, Red fluorescence is indicative of miRNA expression, whereas blue represents nuclear (DAPI) fluorescence. a, Decreased expression of miR129-2 was observed at 4 days in peri-lesion tissue of contused animals, but expression was present within the lesion site itself. b, Similarly, miR129-1 followed the same localization pattern at 4 days with expression being bound to lesion-associated cells only. c, High magnification micrograph of sham control at 4 days post-SCI shows both cytoplasmic and nuclear labeling of miR129-1 in the neuropil and large neuronal cells, indicated by asterisks and arrows, respectively. d, Conversely, expression at 14 days post-SCI was low within the lesion itself and localized predominately with peri-lesion grey matter at the rostral and caudal sectional extremes, with decreased expression also observed in tissue 1cm rostral to the lesion site. Scale bars, 500 μm (a, b, d) and 50 μm (c).
Subsequently, immunofluorescence analyses of biomarkers present at 14 days post-SCI was performed to correlate cellular identity after SCI with miRNA expression patterns. Following SCI, nestin expression was observed at the lesion site throughout the gray matter, including both the dorsal and ventral horns, which typically indicates either the presence of neural progenitor cells involved in the adaptive formation of new neurons, or reactive astrocytes contributing to glial scar formation (Gilyarov, 2008; Figure 7a-e). However, in contrast to the gray matter localization of nestin, glial fibrillary acidic protein (GFAP), an intermediate filament specific within the CNS to astrocytes and other glial cells, was primarily observed in the white matter following SCI, though nominal expression was observed in grey matter as well (Figure 7f-h). Although there was notable presence of reactive astrocytes (nestin+/GFAP+), the lesion site also contained large networks of nestin+/GFAP- cells containing neuronal morphologies such as long axonal-like processes and large nuclei (Figure 7i), whereas sham controls exhibited minimal nestin expression (Figure 7e). In addition, REST, a transcription factor present in neural progenitor cells and indirectly inhibited through a negative feedback loop by miR124 to induce neuronal fate (Visvanathan et al., 2007), was up-regulated in and adjacent to the lesion site, but not in sham controls (Figure 8a-d). Furthermore, expression of neurofilament was localized to fibers running proximal and parallel to nestin-positive processes, but did not display co-localization (Figure 9a), indicative that the nestin-positive cells are not mature neurons (Figlewicz et al., 1988; Lagace et al., 2007). To address the possibility that the nestin+/GFAP-regions are active sites for adult neurogenesis following SCI, tissue was immunostained for nestin and the transcription factor SOX2, a positive regulator of nestin during neurogenesis that is expressed in stem and progenitor cells (Jin et al., 2009). Interestingly, at 4 days, SOX2 expression was observed throughout the grey matter, including both the ventral and dorsal horns (Figure 9b), specifically in two groups of cells within the lesion site: within clusters of small, immature cells that were also nestin-positive (indicating activation of stem cell niches within the lesion site; Figure 9d), and within nuclei of large neuronal cells (Figure 9c, 9e). The expression of Sox2 in the latter cell population, while not co-localized with nestin (Figure 9f), was nevertheless consistent with the disappearance of miR124 (Figure 4b) and the appearance of REST (Figure 8a-d), and supports a hypothesis that neurons within the lesion site transiently revert to a more immature phenotype. In contrast, substantially lower levels of SOX2 were observed at 14 days, along with increased nestin expression, and co-localization with nestin was negligible (Figure 9g).
Figure 7.

Expression of biomarkers for neural differentiation is consistent with the emergence of neuronal immaturity in addition to reactive astrocytes. a-e, Nestin expression is increased in contused specimens both 4 and 14 days after SCI. a, Increased nestin expression was observed throughout the grey matter, and in both the dorsal and ventral horns, in coronal sections of contused animals 4 days following injury. b-d, High magnification micrographs show nestin fiber tracts associated with small glial cells in the white matter/remnants of the dorsal horn (b), nestin positive cells along the interface between the ventral horn and white matter (c), and a large, nestin positive neuronal cell projecting into the white matter from the ventral horn (d). Arrows label nestin-labeled processes of the neuron, and an asterisk denotes the large nucleus; note the triangular shaped cell body and long axonal process. e, At 14 days post-surgery, contused specimens illustrated a higher level of nestin expression than that observed at 4 days, relative to sham controls. f-i, In addition to nestin, contused specimens also exhibited an increase in GFAP (f), but expression was largely confined to white matter (g, h) and GFAP and nestin did not co-localize exclusively. i, Large numbers of nestin+/GFAP- cells with long processes were observed within the lesion site, indicative of neuronal immaturity rather than reactive astrocytosis. Abbreviations, central canal (CC), dorsal horn (DH), grey matter (GM), ventral horn (VH), and white matter (WH). Scale bars, 500 μm (a, c, f-h), 200 μm (e, i) and 50 μm (b, d).
Figure 8.
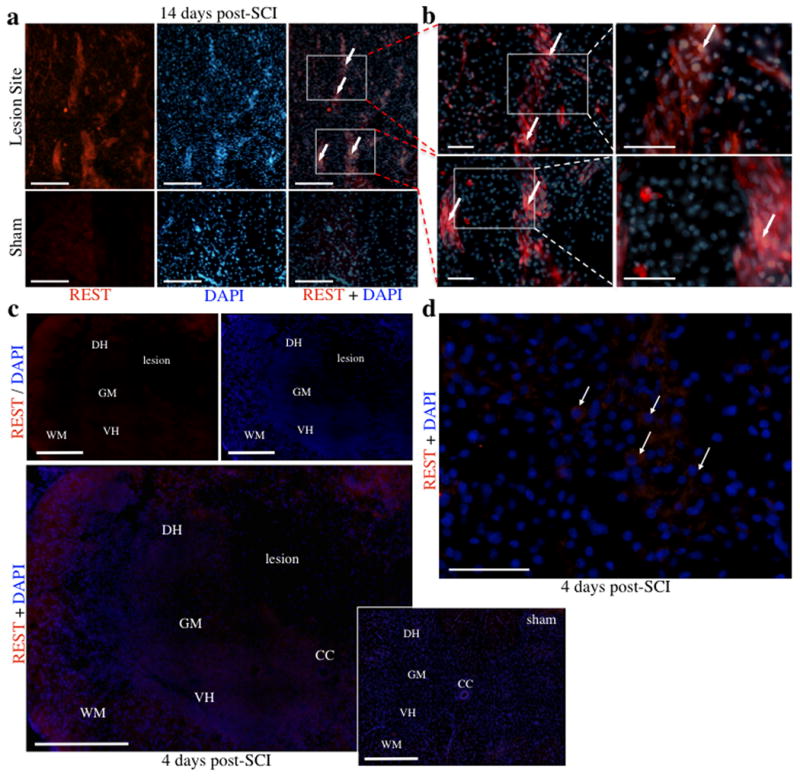
Expression of REST is increased following SCI. a, REST expression at 14 days was increased in cells within and adjacent to the lesion site, but not in sham controls. b, Boxed in sections from (a) are shown in higher magnification in adjacent panels (20× and 40×, respectively). c, Expression of REST at 4 days increased within both white and grey matter of coronal sections, including the dorsal and ventral horns. d, High magnification micrograph shows cytoplasmic REST expression in large neuronal cells (indicated by arrows) of a contused specimen 4 days post-SCI. Abbreviations, central canal (CC), dorsal horn (DH), grey matter (GM), ventral horn (VH), and white matter (WH). Scale bars, 500 μm (c), 200 μm (a) and 50 μm (b, d).
Figure 9.
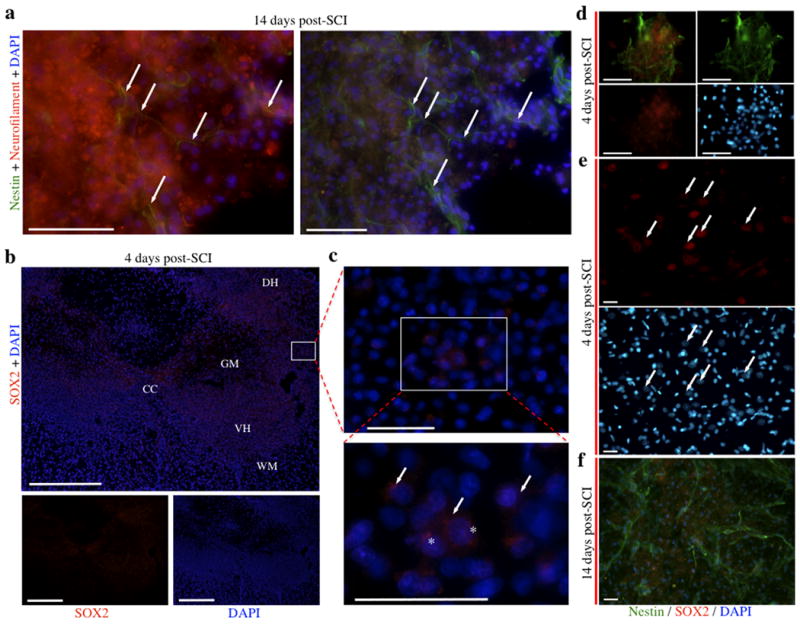
a, Nestin and neurofilament fiber tracts run parallel to one another, but do not co-localize, indicating that nestin+ cells are not mature neurons. The globular appearance of red immunofluorescence is indicative of neurofilament depolymerization within injured neurons at the lesion site. Arrows point to nestin immunoreactive fibers within the lesion site perforating through a region of grey matter containing damaged neurons labeled with globular neurofilament-like immunofluorescence. b-e, Localization of SOX2 at 4 days post-SCI. SOX2 was observed throughout the grey matter in coronal sections, including both the dorsal and ventral horns (b), and high magnification micrographs illustrate both cytoplasmic and nuclear labeling within large neuronal cells, indicated by arrows and asterisks, respectively (c). SOX2 (red) co-localizes to small clusters of nestin positive cells (green) within the lesion site (d), indicating emergence of neural progenitor cells following SCI. SOX2 expression (red, arrows) is also observed in nestin-negative neuronal cells in the peri-lesion region (e). f, At 14 days post-SCI, low levels of SOX2 expression are observed following injury, and SOX2 does not co-localize with nestin, suggesting that these nestin-positive cells are further differentiated towards their neuronal lineage. Abbreviations, central canal (CC), dorsal horn (DH), grey matter (GM), ventral horn (VH), and white matter (WH). Scale bars: 500 μm (b) and 50 μm (a, c-f).
3.4 Bioinformatics analyses of miRNA targets
To determine the functional significance of miRNA expression changes, validated gene targets of miRNAs were obtained from miRWALK (http://www.ma.uni-heidelberg.de/apps/zmf/mirwalk/, 2010) and cross-referenced to determine gene targets common between multiple miRNAs. These lists were then grouped into two categories, those that were common targets of miR1 and miR124, and a second group containing common targets of miR21 and miR146a. The resulting gene lists were then analyzed using the DAVID Bioinformatics Resources for functional annotation (Dennis et al., 2003; Huang da et al., 2009; Table 1).
Table 1.
Statistical annotation of miRNA function. Gene targets of SCI-sensitive miRNAs, were identified using miRWALK (http://www.ma.uni-heidelberg.de/apps/zmf/mirwalk/, 2010). This analysis was limited to miRNA gene targets that were identified from the published literature and cross-referenced for gene targets shared by two or more SCI-sensitive miRNAs. The cross-referenced lists were grouped according to similarity, and functional annotation by Gene Ontology Term (The Gene Ontology Consortium, www.geneontology.org/) was performed in two groups, one for miR1 and miR124, and another for miR21 and miR146a common targets (DAVID, http://david.abcc.ncifcrf.gov/, 2010). Enriched Gene Ontologies were retained when the Benjamini corrected Fisher Exact t-test p-value was less than 0.05.
| Gene Ontology ID ∼ functional term | Gene Count | Benjamini p-value |
|---|---|---|
| miR-1 and miR-124 common targets | ||
| GO:0006357∼regulation of transcription from RNA polymerase II promoter | 17 | 1.72E-02 |
| GO:0006928∼cell motion | 12 | 4.70E-02 |
| GO:0010608∼posttranscriptional regulation of gene expression | 8 | 4.66E-02 |
| GO:0022402∼cell cycle process | 13 | 4.67E-02 |
| GO:0032268∼regulation of cellular protein metabolic process | 17 | 6.03E-04 |
| GO:0042981∼regulation of apoptosis | 17 | 3.67E-02 |
| GO:0043065∼positive regulation of apoptosis | 12 | 3.61E-02 |
| GO:0045449∼regulation of transcription | 35 | 4.29E-02 |
| GO:0048545∼response to steroid hormone stimulus | 9 | 1.61E-02 |
| h_tnfr1Pathway:TNFR1 Signaling Pathway | 7 | 8.39E-04 |
| miR-21 and miR-146a common targets | ||
| GO:0008284∼positive regulation of cell proliferation | 6 | 6.94E-03 |
| GO:0008285∼negative regulation of cell proliferation | 6 | 4.28E-03 |
| GO:0009628∼response to abiotic stimulus (radiation, UV) | 8 | 8.54E-05 |
| GO:0032268∼regulation of cellular protein metabolic process | 7 | 1.69E-03 |
| GO:0033554∼cellular response to stress | 6 | 2.26E-02 |
| GO:0042127∼regulation of cell proliferation | 11 | 2.69E-05 |
| GO:0042981∼regulation of apoptosis | 10 | 1.11E-04 |
| GO:0043065∼positive regulation of apoptosis | 9 | 2.71E-05 |
| GO:0043066∼negative regulation of apoptosis | 6 | 4.20E-03 |
| GO:0044451∼nucleoplasm part | 7 | 1.53E-02 |
| GO:0045449∼regulation of transcription | 12 | 1.29E-02 |
| hsa04010:MAPK signaling pathway | 7 | 3.81E-03 |
Quantitative RT-PCR data indicated that both miR1 and miR124 were down-regulated at 4 and 14 days, and initial bioinformatics showed that they target similar types of genes, so they were grouped together for functional analysis. Functional annotation revealed that both miRNAs are inhibitors gene networks that promote transcription and translation (for significant Gene Ontologies, see Table 1), and their down-regulation results in an increase in protein synthesis that contributes to the initiation of cell cycle, induction of apoptosis, and response to inflammation. Interestingly, inhibition of these miRNAs also promotes cell motility, which is indicative of the emergence of immature cells and, in conjunction with cell cycle initiation, reaffirms the immunofluorescence observations that neurons at the injury site appear to be shifting to a pre-neuronal state.
MiR21 and miR146a were both transiently induced following SCI and also had similar validated gene target profiles, so they were analyzed together as a second functional group. Functional annotation illustrates that miR21 and miR146a act primarily to inhibit cell proliferation and apoptosis through the regulation of transcription and translation. In addition, due to their association within the same annotation cluster, it is possible that the primary method by which these two miRNAs regulate cell proliferation is through the inhibition of gene ontology groups including the MAPK signaling and nucleoplasm production pathways (Table 1).
Finally, analysis was not performed for miR129-2 and miR129-1 because validated targets have not been published, and the analysis of predicted targets did not produce statistically significant Gene Ontologies. Further study may be needed to determine valid gene targets of the miR129 family, or to functionally analyze validated targets as they become available in published literature.
4. Discussion
Spinal cord injury dramatically alters the cellular landscape of impacted tissue through the activation of inflammatory pathways, which ultimately cause further insult by contributing to the pathogenesis of secondary SCI, instead of protective mediation. The resulting loss of cellular plasticity, especially in the presence of uncontrollable nociceptive stimuli, impairs therapeutic efforts to improve functional recovery (Grau et al., 2006; Hook et al., 2009). Because microRNAs are capable of regulating hundreds of genes simultaneously, either post-transcriptionally or through promoter interaction (Li et al., 2006; Breving and Esquela-Kerscher, 2010), it is likely that they play a major role in the induction of these maladaptive processes following SCI, and could therefore become attractive candidates for drug targets in therapeutic intervention for spinal cord injury.
In the current study we investigated the regulation of microRNAs after SCI. Specifically, we identified 7 miRNAs using microarray analysis that were significantly altered within 4 to 14 days after SCI (223, 21, and 146a positively and 1, 124, 129-2, and 129-1 negatively). Additionally, one other non-coding small RNA, SNORD2, an ATP-dependent helicase important for ribosome-associated translation initiation (Sudo et al., 1995; Hernandez and Vazquez-Pianzola, 2005), was also significantly induced within the lesion site. These data collectively suggest that cellular adaptation to injury involves simultaneous inhibition and initiation of translation resulting in a shift in protein expression profiles in the injury site.
Using both qRT-PCR and in situ hybridization analyses, we were able to validate the differential SCI-related expression of all the above miRNAs except for miR223. In contrast to recent reports by Nakanishi et al. (2010), who found that miR223 expression was significantly induced early following injury (6-12 hours, post SCI), we observed that at best, miR223 was induced as a later component (14 days post-SCI) of injury. While we do not as yet understand the source of these temporal variations in miR223 expression, miR223 has recently been implicated in myeloid cell differentiation and may play a role in inflammation (Johnnidis et al., 2008; Pedersen and David, 2008; Tsitsiou and Lindsay, 2009). Consequently, miR223 expression could represent a signature for infiltration of immune cells into the injury site.
Additionally, we found that miR21 was initially induced and then suppressed at the lesion site. Suppression of miR21 has been shown to cause apoptosis in both cortical progenitor cells and gliomas (Corsten et al., 2007; Sathyan et al., 2007; Krichevsky and Gabriely, 2009), so the observed up-regulation of miR21 at 4 days, in conjunction with the simultaneous re-expression of nestin, would suggest a protective role in promoting cell survival and neural progenitor cell integration at the lesion site. While miR21 was transiently increased following SCI, miR146a exhibited a more prolonged increase up to 14 days post SCI. Accumulating evidence indicates that miR146a acts not only as an anti-inflammatory mediator because it inhibits the translation of a number of cytokines and chemokines, including IL-6, IL-8, IL-1β and TNF-α (Taganov et al., 2006; Li et al., 2010), but also as a pro-growth miRNA, as evidenced by its promotion of cell proliferation in hepatocellular carcinoma (Xu et al., 2008). Indeed, a functional analysis of validated (published) gene targets of SCI-sensitive miRNAs (miRWALK) indicates that both miR21 and miR146a inhibit expression of genes that repress cell proliferation and promote apoptosis. It is therefore possible that miR146a compensates for the decline in miR21, and in doing so, supports cell and tissue growth following SCI, in addition to reducing overall inflammation at the injury site.
We also observed that miR129-2 and miR129-1 were significantly suppressed at 4 days post-SCI, and that this suppression spread rostrally beyond the lesion site at 14 days. Recent evidence shows that the miR129 family inhibits the G1/S phase-specific regulator CDK6, and consequently, miR129 suppression allows post-mitotic, G1 phase-arrested cells to proliferate (Wu et al., 2010). Such aberrant cell cycle entry could ultimately lead to significant neuronal death (Di Giovanni et al., 2003; Herrup and Yang, 2007). This maladaptive proliferation caused by miR129 down-regulation is contradictory to the pro-growth proliferation induced by increased levels of miR21 and miR146a, which collectively illustrates that the balance between miRNAs like miR21, miR146a, and miR129 may well play a critical role in neuronal survival following SCI.
Interestingly, miR146a and miR129-2 exhibited divergent expression patterns (miR146a was up-regulated and miR129-2 was suppressed) following SCI, when compared to sham control cohorts. However, within the cohort of SCI animals themselves, the initial severity of the lesion was inversely related to later expression of both miRNAs. A less severe injury, as measured by the BBB score on day 1 post-SCI, was associated with increased expression of both miR146a and 129-2 at 4 and up to 14 days later. Moreover, the initial severity of the injury could explain a large and significant proportion of the variability in miRNA expression (63% and 75% for miR146a and miR129-2 respectively), suggesting that these miRNAs in turn may serve as effective therapeutic targets or proxy measures for the severity of an injury. Importantly, expression of none of the other SCI-regulated miRNAs were related to the severity of the injury, suggesting that most other miRNAs respond to injury in a more or less “all or none” manner.
We also observed that following SCI, both miR1 and miR124, best known for their critical role in maintaining the differentiation states of cells and tissues, exhibited a persistent and significant decline. MicroRNA-124, thought to be a neuronal-specific miRNA, drives ectoderm differentiation towards a neuronal lineage through a negative feedback loop that inhibits REST-mediated repression of neuronal genes, while simultaneously down-regulating non-neuronal genes (Visvanathan et al., 2007). In contrast, miR1 is best known for its capacity to drive mesoderm differentiation into either skeletal or cardiac muscle fates by silencing non-muscle genes (Chen et al., 2006; Ivey et al., 2008; Williams et al., 2009), although this miRNA is also expressed in neural tissue like the brain and spinal cord (Mishima et al., 2007), as well as in the retina, where its expression is altered in several models of retinal neurodegeneration (Loscher et al., 2008). The steep decrease in miR124 expression in the lesion site of contused animals, specifically within the grey matter bands and within the large presumptive motor-neuronal cells, could be partly attributed to the high degree of neuronal death resulting from the primary injury (Nakanishi et al., 2010). However, Sox2 and REST were both up-regulated in large motorneurons that had lost miR124 expression in regions proximal to the lesion site, suggesting that cellular de-differentiation, aside from death, underlies the observed decrease in miR124. Thus, a likely synergistic effect of the concurrent suppression of both miR1 and miR124 would be the transient emergence of a cellular environment highly favorable for plasticity and neural fate reprogramming. However, any early increase in neuronal plasticity at the lesion site, mediated by miR124/miR1 suppression, may ultimately synergize with the pro-apoptotic, pro-cell cycle effects of suppressing miR21/miR129 at 14 days to cause cell cycle failure and induction of apoptosis in surviving post-mitotic neurons.
The lesioned spinal cord exhibits additional evidence for cellular plasticity in the form of activated stem cell niches. While some nestin-positive cells co-localize with GFAP, indicating the presence of reactive astrocytes, other networks of nestin-positive cells did not exhibit such co-localization. Moreover, within the lesion site, we also observed clusters of nestin-positive cells that also express Sox2, a stem cell-associated transcription factor that controls nestin expression in neural progenitor cells of the CNS to promote differentiation (Jin et al., 2009). The presence of SOX2+/nestin+ and nestin+/GFAP-cells within the lesion site, 4-days post-lesion, suggests the specific activation of stem cell niches and the emergence of cells that exhibit a neuronal progenitor identity. At 14 days post-lesion, nestin-positive cells within the lesion site no longer expressed Sox2 suggesting that these cells had progressed further towards a neural identity.
5. Conclusions
Our evidence shows that SCI results in a very specific and limited profile of miRNA changes, and that these changes evolve in a coordinated manner over a period of time following the injury. Interestingly, most changes are limited to the lesion site with very limited miRNA dysregulation observed in regions anterior or caudal to the injury site. Over a prolonged period (14 days), only three miRNAs also exhibited spatial dysregulation. MiR129-1 and 129-2 were suppressed in regions anterior to the injury site, whereas miR146a was increased caudal to the injury site. Interestingly, both miR129-2 and miR146a also exhibit a strong potential to be proxy markers for the initial severity of spinal cord injury. These data collectively suggest that global changes in miRNA-driven control of protein-coding gene networks remain largely confined to the lesion site, with minimal initial adaptations within the surrounding non-injured tissue. It remains to be determined whether other miRNA adaptations appear over time in specific afferent or efferent targets of projections from within the lesion site, including cortical, thalamic or lower motor-neuron targets.
A statistical analysis of the gene ontology classifications of published mRNA targets associated with the miRNAs aberrantly expressed following SCI yields a cohesive picture of miRNA involvement favoring a loss of neuronal identity and the emergence of neuronal progenitors within the lesion site. Such a hypothesis is well supported by the induced expression Sox2 and nestin within probable stem cell niches. It is additionally supported by the expression of both Sox2 and the suppressor of neuronal identity, REST, along with the loss of miR124 within surviving, presumptive motorneurons within the lesion site. In the latter case, this loss of neuronal identity may well be a factor in the induction of apoptosis driving secondary SCI, but could also represent a target of opportunity for therapeutic intervention in the immediate aftermath of SCI. De-differentiating neurons and activated stem cell niches may be subjected to reprogramming, possibly using the complement of miRNAs that are dysregulated following SCI itself. Further functional analyses will be required to explore the therapeutic and regenerative potential of manipulating levels of these SCI-sensitive miRNAs, in the immediate and prolonged time period following an injury, to minimize secondary injury and enhance functional recovery.
Research Highlights.
MiRNAs exhibit both rapid and delayed changes following spinal cord trauma
Neuronal differentiation miRNAs are suppressed and anti-apoptotic miRNAs, induced
MiR129-2 and miR146a are biomarkers for initial injury severity
MiRNA dysregulation reflects de-differentiation of surviving neurons
MiRNA expression reflects emergent activation of stem cell niches
Acknowledgments
This work was supported by the National Institutes of Health, Grant Number NS041548, and by funds from Texas A&M Health Science Center.
Footnotes
Publisher's Disclaimer: This is a PDF file of an unedited manuscript that has been accepted for publication. As a service to our customers we are providing this early version of the manuscript. The manuscript will undergo copyediting, typesetting, and review of the resulting proof before it is published in its final citable form. Please note that during the production process errors may be discovered which could affect the content, and all legal disclaimers that apply to the journal pertain.
References
- Alvarez-Garcia I, Miska EA. MicroRNA functions in animal development and human disease. Development. 2005;132:4653–4662. doi: 10.1242/dev.02073. [DOI] [PubMed] [Google Scholar]
- Bareyre FM, Schwab ME. Inflammation, degeneration and regeneration in the injured spinal cord: insights from DNA microarrays. Trends Neurosci. 2003;26:555–563. doi: 10.1016/j.tins.2003.08.004. [DOI] [PubMed] [Google Scholar]
- Basso DM, Beattie MS, Bresnahan JC. A sensitive and reliable locomotor rating scale for open field testing in rats. J Neurotrauma. 1995;12:1–21. doi: 10.1089/neu.1995.12.1. [DOI] [PubMed] [Google Scholar]
- Breving K, Esquela-Kerscher A. The complexities of microRNA regulation: mirandering around the rules. Int J Biochem Cell Biol. 2010;42:1316–1329. doi: 10.1016/j.biocel.2009.09.016. [DOI] [PubMed] [Google Scholar]
- Brown AK, Woller SA, Moreno G, Grau JW, Hook MA. Exercise therapy and recovery after SCI: evidence that shows early intervention improves recovery of function. Spinal Cord. 2011 doi: 10.1038/sc.2010.167. [DOI] [PMC free article] [PubMed] [Google Scholar]
- Chen JF, Mandel EM, Thomson JM, Wu Q, Callis TE, Hammond SM, Conlon FL, Wang DZ. The role of microRNA-1 and microRNA-133 in skeletal muscle proliferation and differentiation. Nat Genet. 2006;38:228–233. doi: 10.1038/ng1725. [DOI] [PMC free article] [PubMed] [Google Scholar]
- Constantini S, Young W. The effects of methylprednisolone and the ganglioside GM1 on acute spinal cord injury in rats. J Neurosurg. 1994;80:97–111. doi: 10.3171/jns.1994.80.1.0097. [DOI] [PubMed] [Google Scholar]
- Corsten MF, Miranda R, Kasmieh R, Krichevsky AM, Weissleder R, Shah K. MicroRNA-21 knockdown disrupts glioma growth in vivo and displays synergistic cytotoxicity with neural precursor cell delivered S-TRAIL in human gliomas. Cancer Res. 2007;67:8994–9000. doi: 10.1158/0008-5472.CAN-07-1045. [DOI] [PubMed] [Google Scholar]
- De Biase A, Knoblach SM, Di Giovanni S, Fan C, Molon A, Hoffman EP, Faden AI. Gene expression profiling of experimental traumatic spinal cord injury as a function of distance from impact site and injury severity. Physiol Genomics. 2005;22:368–381. doi: 10.1152/physiolgenomics.00081.2005. [DOI] [PubMed] [Google Scholar]
- Dennis G, Jr, Sherman BT, Hosack DA, Yang J, Gao W, Lane HC, Lempicki RA. DAVID: Database for Annotation, Visualization, and Integrated Discovery. Genome Biol. 2003;4:P3. [PubMed] [Google Scholar]
- Di Giovanni S, Knoblach SM, Brandoli C, Aden SA, Hoffman EP, Faden AI. Gene profiling in spinal cord injury shows role of cell cycle in neuronal death. Ann Neurol. 2003;53:454–468. doi: 10.1002/ana.10472. [DOI] [PubMed] [Google Scholar]
- Ferguson AR, Bolding KA, Huie JR, Hook MA, Santillano DR, Miranda RC, Grau JW. Group I metabotropic glutamate receptors control metaplasticity of spinal cord learning through a protein kinase C-dependent mechanism. J Neurosci. 2008;28:11939–11949. doi: 10.1523/JNEUROSCI.3098-08.2008. [DOI] [PMC free article] [PubMed] [Google Scholar]
- Figlewicz DA, Gremo F, Innocenti GM. Differential expression of neurofilament subunits in the developing corpus callosum. Brain Res. 1988;470:181–189. doi: 10.1016/0165-3806(88)90236-2. [DOI] [PubMed] [Google Scholar]
- Gilyarov AV. Nestin in central nervous system cells. Neurosci Behav Physiol. 2008;38:165–169. doi: 10.1007/s11055-008-0025-z. [DOI] [PubMed] [Google Scholar]
- Grau JW, Crown ED, Ferguson AR, Washburn SN, Hook MA, Miranda RC. Instrumental learning within the spinal cord: underlying mechanisms and implications for recovery after injury. Behav Cogn Neurosci Rev. 2006;5:191–239. doi: 10.1177/1534582306289738. [DOI] [PubMed] [Google Scholar]
- Grau JW, Washburn SN, Hook MA, Ferguson AR, Crown ED, Garcia G, Bolding KA, Miranda RC. Uncontrollable stimulation undermines recovery after spinal cord injury. J Neurotrauma. 2004;21:1795–1817. doi: 10.1089/neu.2004.21.1795. [DOI] [PubMed] [Google Scholar]
- Gruner JA. A monitored contusion model of spinal cord injury in the rat. J Neurotrauma. 1992;9:123–126. doi: 10.1089/neu.1992.9.123. discussion 126-128. [DOI] [PubMed] [Google Scholar]
- Hernandez G, Vazquez-Pianzola P. Functional diversity of the eukaryotic translation initiation factors belonging to eIF4 families. Mech Dev. 2005;122:865–876. doi: 10.1016/j.mod.2005.04.002. [DOI] [PubMed] [Google Scholar]
- Herrup K, Yang Y. Cell cycle regulation in the postmitotic neuron: oxymoron or new biology? Nat Rev Neurosci. 2007;8:368–378. doi: 10.1038/nrn2124. [DOI] [PubMed] [Google Scholar]
- Hook MA, Moreno G, Woller S, Puga D, Hoy K, Jr, Balden R, Grau JW. Intrathecal morphine attenuates recovery of function after a spinal cord injury. J Neurotrauma. 2009;26:741–752. doi: 10.1089/neu.2008.0710. [DOI] [PMC free article] [PubMed] [Google Scholar]
- Hook MA, Washburn SN, Moreno G, Woller SA, Puga D, Lee KH, Grau JW. An IL-1 receptor antagonist blocks a morphine-induced attenuation of locomotor recovery after spinal cord injury. Brain Behav Immun. 2011;25:349–359. doi: 10.1016/j.bbi.2010.10.018. [DOI] [PMC free article] [PubMed] [Google Scholar]
- Huang da W, Sherman BT, Lempicki RA. Systematic and integrative analysis of large gene lists using DAVID bioinformatics resources. Nat Protoc. 2009;4:44–57. doi: 10.1038/nprot.2008.211. [DOI] [PubMed] [Google Scholar]
- Ivey KN, Muth A, Arnold J, King FW, Yeh RF, Fish JE, Hsiao EC, Schwartz RJ, Conklin BR, Bernstein HS, Srivastava D. MicroRNA regulation of cell lineages in mouse and human embryonic stem cells. Cell Stem Cell. 2008;2:219–229. doi: 10.1016/j.stem.2008.01.016. [DOI] [PMC free article] [PubMed] [Google Scholar]
- Jin Z, Liu L, Bian W, Chen Y, Xu G, Cheng L, Jing N. Different transcription factors regulate nestin gene expression during P19 cell neural differentiation and central nervous system development. J Biol Chem. 2009;284:8160–8173. doi: 10.1074/jbc.M805632200. [DOI] [PMC free article] [PubMed] [Google Scholar]
- Johnnidis JB, Harris MH, Wheeler RT, Stehling-Sun S, Lam MH, Kirak O, Brummelkamp TR, Fleming MD, Camargo FD. Regulation of progenitor cell proliferation and granulocyte function by microRNA-223. Nature. 2008;451:1125–1129. doi: 10.1038/nature06607. [DOI] [PubMed] [Google Scholar]
- Krichevsky AM, Gabriely G. miR-21: a small multi-faceted RNA. J Cell Mol Med. 2009;13:39–53. doi: 10.1111/j.1582-4934.2008.00556.x. [DOI] [PMC free article] [PubMed] [Google Scholar]
- Lagace DC, Whitman MC, Noonan MA, Ables JL, DeCarolis NA, Arguello AA, Donovan MH, Fischer SJ, Farnbauch LA, Beech RD, DiLeone RJ, Greer CA, Mandyam CD, Eisch AJ. Dynamic contribution of nestin-expressing stem cells to adult neurogenesis. J Neurosci. 2007;27:12623–12629. doi: 10.1523/JNEUROSCI.3812-07.2007. [DOI] [PMC free article] [PubMed] [Google Scholar]
- Lee CT, Risom T, Strauss WM. Evolutionary conservation of microRNA regulatory circuits: an examination of microRNA gene complexity and conserved microRNA-target interactions through metazoan phylogeny. DNA Cell Biol. 2007;26:209–218. doi: 10.1089/dna.2006.0545. [DOI] [PubMed] [Google Scholar]
- Li L, Chen XP, Li YJ. MicroRNA-146a and human disease. Scand J Immunol. 2010;71:227–231. doi: 10.1111/j.1365-3083.2010.02383.x. [DOI] [PubMed] [Google Scholar]
- Li LC, Okino ST, Zhao H, Pookot D, Place RF, Urakami S, Enokida H, Dahiya R. Small dsRNAs induce transcriptional activation in human cells. Proc Natl Acad Sci U S A. 2006;103:17337–17342. doi: 10.1073/pnas.0607015103. [DOI] [PMC free article] [PubMed] [Google Scholar]
- Liu NK, Wang XF, Lu QB, Xu XM. Altered microRNA expression following traumatic spinal cord injury. Exp Neurol. 2009;219:424–429. doi: 10.1016/j.expneurol.2009.06.015. [DOI] [PMC free article] [PubMed] [Google Scholar]
- Loscher CJ, Hokamp K, Wilson JH, Li T, Humphries P, Farrar GJ, Palfi A. A common microRNA signature in mouse models of retinal degeneration. Exp Eye Res. 2008;87:529–534. doi: 10.1016/j.exer.2008.08.016. [DOI] [PMC free article] [PubMed] [Google Scholar]
- Mishima T, Mizuguchi Y, Kawahigashi Y, Takizawa T. RT-PCR-based analysis of microRNA (miR-1 and -124) expression in mouse CNS. Brain Res. 2007;1131:37–43. doi: 10.1016/j.brainres.2006.11.035. [DOI] [PubMed] [Google Scholar]
- Nakanishi K, Nakasa T, Tanaka N, Ishikawa M, Yamada K, Yamasaki K, Kamei N, Izumi B, Adachi N, Miyaki S, Asahara H, Ochi M. Responses of microRNAs 124a and 223 following spinal cord injury in mice. Spinal Cord. 2010;48:192–196. doi: 10.1038/sc.2009.89. [DOI] [PubMed] [Google Scholar]
- Nesic O, Svrakic NM, Xu GY, McAdoo D, Westlund KN, Hulsebosch CE, Ye Z, Galante A, Soteropoulos P, Tolias P, Young W, Hart RP, Perez-Polo JR. DNA microarray analysis of the contused spinal cord: effect of NMDA receptor inhibition. J Neurosci Res. 2002;68:406–423. doi: 10.1002/jnr.10171. [DOI] [PubMed] [Google Scholar]
- Pedersen I, David M. MicroRNAs in the immune response. Cytokine. 2008;43:391–394. doi: 10.1016/j.cyto.2008.07.016. [DOI] [PMC free article] [PubMed] [Google Scholar]
- Sathyan P, Golden HB, Miranda RC. Competing interactions between micro-RNAs determine neural progenitor survival and proliferation after ethanol exposure: evidence from an ex vivo model of the fetal cerebral cortical neuroepithelium. J Neurosci. 2007;27:8546–8557. doi: 10.1523/JNEUROSCI.1269-07.2007. [DOI] [PMC free article] [PubMed] [Google Scholar]
- Sudo K, Takahashi E, Nakamura Y. Isolation and mapping of the human EIF4A2 gene homologous to the murine protein synthesis initiation factor 4A-II gene Eif4a2. Cytogenet Cell Genet. 1995;71:385–388. doi: 10.1159/000134145. [DOI] [PubMed] [Google Scholar]
- Taganov KD, Boldin MP, Chang KJ, Baltimore D. NF-kappaB-dependent induction of microRNA miR-146, an inhibitor targeted to signaling proteins of innate immune responses. Proc Natl Acad Sci U S A. 2006;103:12481–12486. doi: 10.1073/pnas.0605298103. [DOI] [PMC free article] [PubMed] [Google Scholar]
- Tsitsiou E, Lindsay MA. microRNAs and the immune response. Curr Opin Pharmacol. 2009;9:514–520. doi: 10.1016/j.coph.2009.05.003. [DOI] [PMC free article] [PubMed] [Google Scholar]
- Visvanathan J, Lee S, Lee B, Lee JW, Lee SK. The microRNA miR-124 antagonizes the anti-neural REST/SCP1 pathway during embryonic CNS development. Genes Dev. 2007;21:744–749. doi: 10.1101/gad.1519107. [DOI] [PMC free article] [PubMed] [Google Scholar]
- Williams AH, Liu N, van Rooij E, Olson EN. MicroRNA control of muscle development and disease. Curr Opin Cell Biol. 2009;21:461–469. doi: 10.1016/j.ceb.2009.01.029. [DOI] [PMC free article] [PubMed] [Google Scholar]
- Wu J, Qian J, Li C, Kwok L, Cheng F, Liu P, Perdomo C, Kotton D, Vaziri C, Anderlind C, Spira A, Cardoso WV, Lu J. miR-129 regulates cell proliferation by downregulating Cdk6 expression. Cell Cycle. 2010;9:1809–1818. doi: 10.4161/cc.9.9.11535. [DOI] [PubMed] [Google Scholar]
- Xu T, Zhu Y, Wei QK, Yuan Y, Zhou F, Ge YY, Yang JR, Su H, Zhuang SM. A functional polymorphism in the miR-146a gene is associated with the risk for hepatocellular carcinoma. Carcinogenesis. 2008;29:2126–2131. doi: 10.1093/carcin/bgn195. [DOI] [PubMed] [Google Scholar]
- Zamore PD, Haley B. Ribo-gnome: the big world of small RNAs. Science. 2005;309:1519–1524. doi: 10.1126/science.1111444. [DOI] [PubMed] [Google Scholar]
- DAVID: Database for Annotation, Visualization, and Integrated Discovery. 2010 July; http://david.abcc.ncifcrf.gov/ [PubMed]
- MiRWalk: The database on predicted and validated microRNA targets. 2010 July; http://www.ma.uni-heidelberg.de/apps/zmf/mirwalk/index.html.
- The Gene Ontology Consortium. 2010 July; http://www.geneontology.org/