

Abstract
The aminoalkylindole agonists JWH-018 and JWH-073 are contained in “K2/SPICE” products sold as “legal marijuana”. Previous human metabolic studies have identified (ω)-hydroxyl and (ω)-carboxyl metabolites as biomarkers indicative of product use. However, other primary metabolites exhibiting similar chromatographic properties and mass spectra are also excreted in human urine. Analytical standards were used in this study to identify new primary metabolites as (ω-1)-hydroxyl derivatives of JWH-018 and JWH-073. The liquid chromatography tandem mass spectrometry (LC-MS/MS) procedure coupled with an automated solid-phase extraction procedure incorporating deuterium labeled internal standards provides rapid resolution of the (ω)- and (ω-1) metabolites with adequate sensitivity, precision, and accuracy for trace analysis in human urine. Results from four urine specimens collected after individuals reportedly self-administered either JWH-018 or a mixture of JWH-018 and JWH-073 showed the following: 1) all tested metabolites were excreted in high concentrations, 2) (ω)- and (ω-1)-hydroxyl metabolites were exclusively excreted as glucuronic acid conjugates, and 3) approximately 5–80% of the (ω)-carboxyl metabolites were excreted as glucuronic acid conjugates. This is the first report to identify and quantify (ω-1)-hydroxyl metabolites of JWH-018 and JWH-073 and the first to incorporate automated extraction procedures using deuterium labeled internal standards. Full clinical validation awaits further testing.
Keywords: Cannabinoids, JWH-018, JWH-073, synthetic cannabinoids, aminoalkylindole metabolism
INTRODUCTION
Δ9-THC (delta-9-tetrahydrocannabinol) is the principle active constituent of marijuana1 and acts as a agonist at the cannabinoid CB1 and CB1 CB2 receptors.2 Using the cannabinoid receptor system as a pharmacological target, a of variety synthetic cannabinoids, such as cyclohexylphenols (CP compounds) and aminoalkylindoles (AAIs) (e.g. JWH-018, JWH-073), have been previously investigated as new therapeutic compounds, but were abandoned because of undesirable psychoactive properties.3 In recent years, these compounds have appeared in herbal products, sold under popular names such as `K2' and `SPICE'. These products are touted for their marijuana-like effects and the rapid increase in their use among susceptible populations and severe clinical implications has prompted the Drug Enforcement Agency (DEA) to classify these drugs as Schedule I.4
JWH-018 and JWH-073 have been the target of recent reports of new human testing assays capable of measuring these compounds and their phase I and II metabolic products in human specimens.5‒11 The lack of validated and standardized human testing methods has hindered researchers from characterizing the clinical symptoms and potential public health impact of these drugs of abuse. Early clinical publications described the onset of extreme agitation, syncope, tachycardia, and visual and auditory hallucinations and death in some patients following product use.12–16 The inability to definitely link reported clinical complications to specific synthetic cannabinoid receptor agonist use and to associate epidemiological and clinical data with use patterns significantly hinders the public health system from fully appreciating the magnitude of potential health problems associated with these compounds. This need can only be met by the development of standardized human testing capabilities.
Initial reports assessing human metabolism of AAIs5–9, 11 indicate that primary oxidation sites are localized to the small alkyl side chain present in both JWH-018 and JWH-073. Major hydroxyl and carboxyl metabolites identified and characterized thus far have been localized to the terminal (ω) carbon. Both the (ω)-hydroxyl and (ω)-carboxyl derivates, as well as the glucuronic acid conjugates of each, have been detected in human urine after JWH-018 and JWH-073 use.6–9 Initial reports also demonstrated the presence of another unidentified metabolite exhibiting a similar chromatographic profile and mass spectra as the (ω)-hydroxyl products.6 Since aliphatic hydrocarbons are subject to both (ω)-carbon and (ω-1)-carbon hydroxylations, it is plausible that the unidentified metabolite may be the (ω-1)-hydroxyl derivative of each AAI.
The following study tests the hypothesis that the previously reported, unidentified JWH-018 and JWH-073 metabolites excreted in human urine are the (ω-1)-hydroxyl derivatives. Analytical standards were used to develop a rapid quantitative method for measuring previously identified metabolites of JWH-018 and JWH-073 along with (ω-1)-hydroxyl derivatives of each (Figure 1). This new method confirms previous reports identifying and quantifying urinary concentrations of (ω)-oxidized products6, 8, and for the first time, begins characterizing the relative urinary concentrations of the (ω-1)-oxidized products. This method incorporates a new solid-phase extraction procedure that improves sensitivity for the simultaneous quantification of all the primary JWH-018 and JWH-073 metabolites excreted in human urine. Incorporation of deuterium labeled internal standards and improved LC-MS/MS conditions allows for the complete resolution of each major metabolite and adequate sensitivity, accuracy, and precision for low level measurements.
Figure 1.

Structures of (ω)-hydroxyl and carboxyl derivatives of JWH-018 (analyte 1 and 2, respectively) and JWH-073 (analytes 4 and 5, respectively) and the (ω-1)-hydroxyl derivatives of JWH-018 (analyte 3) and JWH-073 (analyte 6).
EXPERIMENTAL SECTION
Reagents and Chemicals
Optima LC-MS grade acetonitrile was purchased from Fisher Scientific (Pittsburgh, PA). Reagent grade formic acid (99% pure) was purchased from Acros Organic (Pittsburgh, PA). A.C.S. Spectrophotometric grade dimethyl sulfoxide (DMSO, >99.9% pure) was purchased from Sigma-Aldrich (St. Louis, MO). Deionized water was purified to 18.2 MΩ-cm resistivity using an ELGA PURELAB Ultra laboratory water purification system (Woodridge, IL). β-glucuronidase (Bovine liver, Type B-10, 13,000 units/mg) was purchased from Sigma-Aldrich (St. Louis, MO). Polymeric strong cationic exchange solid-phase extraction cartridges were kindly provided by Phenomenex (Torrance, CA). Analytical standards were provided by Cayman Chemical (Ann Arbor, MI) and were assigned a sequential name (Figure 1, Analyte 1–6). Specific nomenclature and structures for each analyte are illustrated in Figure 1. Deuterium labeled internal standards (analyte 2-d4 and analyte 5-d5) were also provided by Cayman Chemical (Ann Arbor, MI).
Equipment
Sample analysis from 10 μl injections was performed using an Applied Biosystems API-4000 Q TRAP tandem mass spectrometer (Carlsbad, CA) interfaced with an Agilent 1200 Series quaternary liquid chromatography system (Santa Clara, CA). Analyst software (Version 1.5, Life Technologies, Carlsbad, CA) was used to control the overall operation of the HPLC system and the mass spectrometer. Solid-phase extraction procedure was automated on a Gilson Nebula 215 Solid Phase Extraction System (Middleton, WI). Instrument control was preformed using Gilson 735 Sampler software.
Preparation of Analytical Standards and Quality Control Material
Analytical standards were prepared using a DMSO calibration stock solution containing analytes 1–6 (100 μg/mL) that was stored at −40°C until use. Daily calibration standards were made by first preparing an intermediate working solution in DMSO (0.5 μg /mL), followed by serial dilution with blank human urine and DMSO (50% final concentration) to yield final analytical standards ranging from 0.05 to 100 ng/mL. Blank human urine was collected from untimed urine collections provided by volunteers. Blank urine is maintained in clinical laboratories housed at the Arkansas Department of Health, Public Health Laboratory and is used for routine clinical analysis. Blank human urine pools were screened prior to use to ensure pools were void of AAI contamination.
A second source of analytical standards was not available for this study, but quality control (QC) samples were prepared independent of standards by spiking blank human urine with varying levels of analytes 1–6 (0.1, 2.0 and 50 ng/mL final concentrations) and DMSO (50% final concentration). One mL aliquots of standards and each QC sample were spiked with deuterium labeled internal standards (100 ng/mL final concentration) available for analytes 2 and 5 prior to sample extraction.
β-Glucuronidase Treatment of Subject Samples
To evaluate the relative amount of product excreted as glucuronic acid conjugates, 40 μL of human urine samples were incubated in the presence and absence of β-glucuronidase (Bovine liver, Type B-10, Sigma-Aldrich, St. Louis, MO) at 37 °C, with constant shaking for 30 or 60 minutes, by adding 160 μL of 0.1 M pH 5.0 sodium acetate buffer containing β-glucuronidase (1.6 units/μl final concentration). After incubations, 150 μL of the final reaction mixture were matrix matched to standards by diluting to 1.0 mL with the reaction buffer (0.1 M, pH 5.0 sodium acetate) and DMSO (50% final concentration) prior to solid-phase extraction, and like that of standards and QC samples were spiked with deuterium labeled internal standards available for analyte 2 and 5 (100 ng/mL final concentrations). A 33-fold correction factor was applied to final calculations to account for differences between standards and samples. Resulting differences in calculated concentrations were used to estimate percent conjugation. Hydrolytic efficiency was determined by evaluating appropriate molecular ion species specific for the glucuronides prior to sample extraction (Table 1).
Table 1.
MS/MS Experimental Conditions for Specific Reaction Monitoring (SRM) and Information-Dependent Acquisition-Enhanced Product Ion (IDA-EPI)
| Analyte | Q1 (m/z) | Q3 (m/z) | CEa (V) | EPb (V) | DPc (V) | CXPd (V) | |
|---|---|---|---|---|---|---|---|
| 1, 3, and 5 | 358 | 155 | 37 | 10 | 86 | 12 | |
| 2 | 372 | 155 | 37 | 10 | 86 | 12 | |
| 4 and 6 | 344 | 155 | 35 | 10 | 71 | 12 | |
| SRM | 2-d4 (IS) | 376 | 155 | 37 | 10 | 86 | 12 |
| 5-d5 (IS) | 363 | 155 | 37 | 10 | 86 | 12 | |
| 1-,3-, and 5-Gluc | 534 | 358 | 30 | 10 | 30 | 15 | |
| 2-Gluc | 548 | 372 | 30 | 10 | 30 | 15 | |
| 4- and 6- Gluc | 520 | 344 | 30 | 10 | 30 | 15 | |
|
| |||||||
| IDA-EPI | 1–6 | [MH]+ | 80–600 | 40 | 10 | 40 | NA |
CE, Collision Energy;
EP, Entrance Potential;
DP, Declustering Potential;
CXP, Collision Cell Exit Potential
Solid-Phase Extraction of Standards, Quality Control Material, and Subject Samples
Final aliquots of prepared standards, QC material, and subject urine specimens treated with β-glucuronidase were extracted using a polymeric strong-cationic exchange solid phase extraction cartridge (Strata X-B, 33 μ, 30 mg/mL, Phenomenex, CA). Extraction protocols consisted of loading 1.0 mL aliquots, followed by washing the extraction cartridges with 1 mL of aqueous sodium acetate buffer (0.1 M, pH 5.0) and 1 mL of the aqueous sodium acetate buffer (0.1 M, pH 5.0) mixed with 30% acetonitrile. Analytes of interest were eluted 5 times using 1.0 mL aliquots of 85%/15% ethylacetate/isopropyl alcohol. A total of 5.0 mL elution solvent was used to ensure adequate recoveries of all the six analytes of interest. Extracted metabolites were evaporated under a stream of N2 at 60 °C and reconstituted in 100 μL of DMSO prior to analysis.
Liquid Chromatography/Mass Spectrometry Conditions
Analytes of interest were chromatographically separated under isocratic conditions using an Agilent Zorbax Eclipse XDB-C18 analytical column (150 × 4.6 mm, 5 μm) heated to 40°C. Mobile phases consisted of 45% A (0.1% formic acid in water) and 55% B (0.1% formic acid in acetonitrile. The XDB-C18 analytical column was washed and re-equilibrated between each injection by ramping mobile phase B to 95% and then returning the system to initial conditions. Total run time was 10 min.
As previously reported6, MS data were acquired in positive ion mode by electrospray ionization. In brief, the Turbo Ion Spray source voltage was 2500 volts, and source temperature was maintained at 600°C. Nitrogen gas pressures for the GS1 and GS2 source gases, curtain gas, and collision gases were 55.0 cm/S, 55.0 cm/S, 35.0 cm/S, and “high”, respectively. Molecule specific parameters for Specific Reaction Monitoring-Information Dependent Acquisition (SRMIDA) experiments are listed in Table 1. The SRM-IDA transition threshold that triggered Enhanced Product Ion (EPI) experiments ranged from 100 to 4000 counts per second. Specific EPI parameters are summarized in Table 1. Resulting EPI mass spectra for QC and unknown specimens were library matched against stored EPI mass spectra previously reported and obtained from analytical standards (Figure 1) to ensure similar urinary metabolites that may interfere with analysis were fully resolved. Autosampler carryover was assessed by injecting blank urine injections that did not contain any standard material and by injecting solvent blanks directly after the analysis of high calibrations standards (100 ng/mL) and quality control samples (50 ng/mL).
Human Subject Study Design
Four human subject urine samples from the sample bank maintained at the Arkansas Department of Health, Public Health Laboratory were used for this study. The study was approved by the Institutional Review Board of the University of Arkansas for Medical Sciences. Human urine specimens were provided by the Arkansas Poison Control Center, The New York Poison Control Center, North Shore University Hospital in Long Island, and the Arkansas State Crime Laboratory. Clinical information associated with the specimen collected by the New York Poison Control Center has been recently published.17. In some cases, specific products administered by these individuals prior to urine collection were tested by the Arkansas State Crime Laboratory using standard forensic analysis procedures.
Statistical Methods
Accuracy and precision measurements were assessed by interday (non-consecutive), replicate analysis (N = 6) of prepared quality control (QC) samples. Accuracy was calculated as the absolute percent relative error for each of the expected QC concentrations using the following equation: [|nominal concentration–mean calculated concentration|]/nominal concentration] * 100. Analytical precision was calculated as the percent C.V. for replicate measurements at the three QC concentrations (0.1, 2.0, and 50 ng/mL). The limit of detection was estimated as less than the lowest calibrator that was detected in all experiments (0.1 ng/mL), while the lower limit of quantification (LLQ) was estimated as three times the standard deviation of the mean calculated concentration of the QC low sample. LLQ for analyte 3 was estimated at <0.1 ng/mL, therefore the LLQ was set at 0.1 ng/mL. Minimum reporting limits (MRL) were calculated as 33 times the LLQ to account for dilution factors necessary to develop β-glucuronidase treatment and solid-phase extraction procedures that can be easily adopted by most clinical and forensic testing laboratories.
RESULTS AND DISCUSSION
AAIs have distinct structures when compared to Δ9-THC, retain varying affinity towards these receptors, and have emerged as new `legal' designer drugs.16, 18–21 Forensic reports have identified JWH-018 and JWH-073 as primary substances contained in products marketed as `legal marijuana'.4, 18, 20–23 Further it appears that the use of these `K2' products is on the rise among teenagers and other susceptible populations. Close to three thousand new emergency cases being reported to poison control centers in the US during in the first quarter of 201124, and recent reports in Europe suggest that populations in forensic and psychiatric patients commonly use these products.18
Little is known about the clinical pharmacology of JWH-018 or JWH-073 in humans.12–15 The lack of a standardized and validated assay for commonly used AAIs, coupled with limited data on the metabolism of these analytes has hindered the study of these new drugs of abuse. New information is beginning to emerge that will help define the route of human metabolism that could inform the development of sensitive biomarkers for “K2/SPICE”exposure.5, 7–9, 11, 25 Several reports5, 7–9, 11, 25 indicate that the small alkyl side chain of both JWH-018 and JWH-073 is a target of cytochrome P450 oxidation. Both (ω)-hydroxyl and (ω)-carboxyl metabolites have been identified in human urine and serum after self-administration of JWH-018 and JWH-073.6–9 However, several unidentified metabolites exhibiting similar chromatographic properties and mass spectra have also been detected in these studies.6
This report incorporates solid-phase extraction techniques and deuterated internal standards to provide adequate sensitivity and precision for measuring the previously identified oxidized metabolites of JWH-018 and JWH-073 at levels excreted in a typical population of AAI users. Also reported is the use of analytical standards for the (ω-1)-hydroxyl derivatives of JWH-018 and JWH-073 (Figure 1) to identify and quantify these new metabolites in human urine.
Analytes 3 and 6 (Figure 1) were synthesized by Cayman Chemical Company. 1HNMR confirmation studies show chemical shifts and coupling constants that were in agreement with the chemical structures (Figure 2). Mass spectra analyses of analytes 3 and 6 were also consistent with predicted chemical structures (Figure 3). Appropriate molecular ions [MH+], m/z 358 and 344, were observed for analytes 3 and 6, respectively, along with other diagnostic fragment ions characteristic of AAIs (m/z 127 and 155, Figure 3). NMR and mass spectra information for analytes 1–2 and 4–5 has been previously reported.6
Figure 2.

1HNMR confirmation data for analytes (A) 3 and (B) 6 (Figure 1).
Figure 3.

Resulting enhanced product ion produced from analytes (A) 3 and (B) 6 (Figure 1).
The described LC-MS/MS procedure provides baseline resolution for each analyte of interest within 6.5 min (Figure 4). Retention times were consistent between all standards, QCs, and samples and did not shift upon subsequent injections. While all analytes of interest consistently elute within 6.5 min, the total analytical run time was extended to 10 minutes to incorporate the high organic wash gradient and to allow time for column equilibration. Comparisons of mass spectra collected for subject samples and QC material with mass spectra collected using analytical standards were essentially identical (Figure 3). Spectra comparisons were used to monitor for potential unknown contaminants or other unidentified metabolites in subject samples. Autosampler carryover was assessed by injecting blank urine specimens that did not contain any standard material and solvent blanks directly after the analysis of high calibration standards (100 ng/ml) and quality control samples (50 ng/ml). Throughout method validation autosampler carryover was not detected while monitoring for analytes of interest, when methanol was used as the needle rinse solvent.
Figure 4.

Resulting chromatograph produced from (A) a representative 2 ng/mL QC standard and (B) a representative urine sample (Specimen 4) containing analytes 1 – 6 (Figure 1). Chromatography was similar in all standards and unknown specimens. Different color tracings are representative of Specific Reaction Monitoring experiments (Table 1) used to detect analytes 1–6 (Figures 1). The numbers above chromatographic peaks corresponds to retention times established for analytes 1 – 6 (Figure 1). “UK” denotes a potential contaminant or unidentified metabolites.
A linear instrument response (IR ≡ Peak areaAnalyte/Peak areaIS) over the calibration range (0.05 – 100 ng/ml) was observed in all experiments when a least-squares linear regression with 1/X weighting was used to calculate a line of best fit. A high degree of accuracy and precision was observed for all analytes of interests, as assessed by interday (non-consecutive), replicate analysis (N = 6) of prepared QC standards (Table 2). Regression coefficients show a high degree of linearity for all experiments (Table 3), and LLQ and MRL calculations for each metabolite ranged approximately from 0.1 to 0.19 ng/mL and 3.3 to 6.3 ng/mL, respectively (Table 3).
Table 2.
Summary of Accuracy and Precision
| Quality Control Low (0.1 ng/ml) | Quality Control Medium (2 ng/ml) | Quality Control High (50 ng/ml) | |||||||
|---|---|---|---|---|---|---|---|---|---|
| Analyte | Conc. ± SD (ng/ml) | % CVa | % REb | Conc. ± SD (ng/ml) | % CVa | % REb | Conc. ± SD (ng/ml) | % CVa | % REb |
| 1 | 0.06 ± 0.04 | 76.1 | 42.0 | 2.3 ± 0.19 | 8.1 | 15.3 | 49.0 ± 4.4 | 8.9 | 1.9 |
| 2 | 0.16 ± 0.04 | 27 2 | 58.6 | 1.7 ± 0.20 | 11.6 | 16.1 | 48.2 ± 5.3 | 11.1 | 3.7 |
| 3 | 0.08 ± 0.02 | 29.6 | 16.7 | 1.95 ± 0.12 | 6.1 | 2.7 | 48.3 ± 4.7 | 9.7 | 3.3 |
| 4 | 0.09 ± 0.03 | 36.1 | 8.8 | 2.2 ± 0.19 | 8.7 | 7.3 | 48.2 ± 4.3 | 8.9 | 3.5 |
| 5 | 0.11 ± 0.06 | 59.2 | 6.7 | 1.9 ± 0.20 | 10.5 | 5.8 | 46.5 ± 4.8 | 10.3 | 6.9 |
| 6 | 0.07 ± 0.04 | 64.8 | 35.0 | 2.3 ± 0.26 | 11.1 | 16.0 | 47.9 ± 7.0 | 14.6 | 4.3 |
% CV, Coefficient of Variation;
% RE, Absolute Relative Error
Table 3.
Summary of Reporting Limits Established Through Interday Analyses*
| Analyte | Mean R2 | MDLa ng/mL | LLQb ng/mL | MRLc ng/mL |
|---|---|---|---|---|
| 1 | 0.988 | <0.1 | 0.13 | 4.4 |
| 2 | 0.996 | <0.1 | 0.13 | 4.3 |
| 3 | 0.993 | <0.1 | 0.10d | 3.3 |
| 4 | 0.991 | <0.1 | 0.10 | 3.3 |
| 5 | 0.995 | <0.1 | 0.19 | 6.3 |
| 6 | 0.987 | <0.1 | 0.13 | 4.3 |
Data are based on 6 single, independent experiments conducted on nonconsecutive days,
Minimum Detection Limit;
LLQ, Lower limit of Quantification;
MRL, Minimum Reporting Limit.
Actual LLQ calculations yielded 0.074 ng/mL, but was established at 0.1 ng/mL as described in the EXPERIMENTAL SECTION.
It is important to realize that the inclusion of solid-phase extraction procedures effectively removes conjugated metabolites and that hydrolysis efficiency assessments prior to extraction may be necessary. 60 minute incubations at 37 °C were previously established as adequate for complete hydrolysis6; however, other time points have not been fully evaluated. It is possible that some samples may require longer incubation times, or perhaps this procedure can be further streamlined. To better optimize sample pre-treatment procedures, β-glucuronidase efficiency was evaluated at 0, 30, and 60 minutes at 37 °C. Figure 5 demonstrates a representative chromatograph generated from the analysis of urine collected from a subject that presumably self-administered JWH-018 and JWH-073. At 0 minutes nearly all the measured metabolites were present as glucuronic acid conjugates, while after 30 and 60 minutes β-glucuronidase treatment (1.6 units/μl) at 37 °C, greater than 80% and 94% of the conjugated metabolites were hydrolyzed, respectively. Results from all the specimens tested in this study are presented in Table 4 and illustrates the importance of assessing hydrolysis efficiency; otherwise urinary metabolite concentrations may be underestimated.
Figure 5.
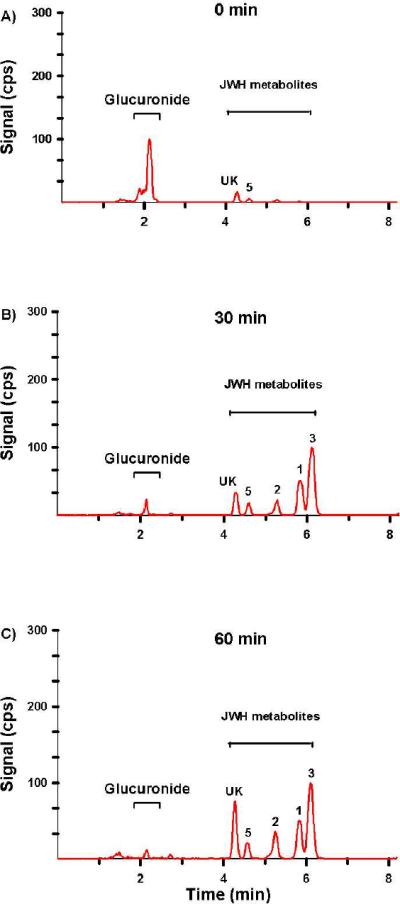
Resulting extracted total ion chromatograph (TIC) from a representative urine sample treated with β-glucuronidase for (A) 0 min, (B) 30 min, and (C) 60 min. This sample (Specimen 1) was chosen as a representative sample because it contains relatively high concentrations of JWH-018 and JWH-073 metabolites. The numbers above chromatographic peaks corresponds to retention times established for analytes 1 – 6 (Figure 1). “UK” denotes a potential contaminant or unidentified metabolites.
Table 4.
Assessment of β-glucuronidase hydrolysis efficiency (1.6 units/μl final concentration) at 30 and 60 minutes at 37 °C
| % Hydrolysis | ||||||
|---|---|---|---|---|---|---|
| Specimen # | JWH-018-OH-Gluc | JWH-018-COOH-Gluc | JWH-073-OH-Gluc | |||
| 30 min | 60 min | 30 min | 60 min | 30 min | 60 min | |
| 1 | 81 | 94 | 100 | 100 | 93 | 100 |
| 2 | 100 | 100 | 100 | 100 | 100 | 100 |
| 3 | 96 | 96 | 100 | 100 | 100 | 100 |
| 4 | 94 | 97 | 100 | 100 | 82 | 100 |
To begin testing the utility of this new assay, urinary concentration of analytes 1–6 were measured in urine specimens collected from 4 human subjects who had recently self-administered either JWH-018 or a mixture of JWH-018 and JWH-073. No information was available on the specific product used prior to collecting urine sample from specimen 1. This sample was included in this study because of its high metabolite concentrations (Table 5). Two individuals reported use of JWH-018 prior to urine collection (Specimen 2 and 3), while a third subject used a mixture of JWH-018 and JWH-073 (Specimen 4). Products reported to be used by patients 2–4 were evaluated by the Arkansas State Crime Laboratory to detect the presence of synthetic cannabinoids and other drugs using methods capable of detecting trace levels.
Table 5.
Urinalysis Summary
| JWH-018 | ||||
|---|---|---|---|---|
| Analyte | 1 | 2 | 3 | |
| Specimen 1 | Urinary Concentration (ng/ml) | 156 | 77 | 233 |
|
|
||||
| (%) GA-Conjugate | 100 | 79 | 100 | |
|
| ||||
| Specimen 2 | Urinary Concentration (ng/ml) | 129 | 41 | 162 |
| (%) GA-Conjugate | 95 | 71 | 100 | |
|
| ||||
| Specimen 3 | Urinary Concentration (ng/ml) | 94 | 16.5 | 149 |
| (%) GA-Conjugate | 100 | 37.2 | 100 | |
|
| ||||
| Specimen 4 | Urinary Concentration (ng/ml) | 23 | 17 | 46 |
| (%) GA-Conjugate | 100 | 54 | 100 | |
| JWH-073 | ||||
|---|---|---|---|---|
| Analyte | 4 | 5 | 6 | |
| Specimen 1 | Urinary Concentration (ng/ml) | — | 46 | — |
|
|
||||
| (%) GA-Conjugate | — | 68 | — | |
|
| ||||
| Specimen 2 | Urinary Concentration (ng/ml) | — | 6.2 | — |
| (%) GA-Conjugate | — | 33 | — | |
|
| ||||
| Specimen 3 | Urinary Concentration (ng/ml) | — | 7.3 | — |
| (%) GA-Conjugate | — | 5.5 | — | |
|
| ||||
| Specimen 4 | Urinary Concentration (ng/ml) | 6.2 | 16 | 50 |
| (%) GA-Conjugate | 100 | 31 | 100 | |
—: Not Detected
Chromatographic resolution of the primary metabolites excreted by a representative subject is presented in Figure 4 and resulting concentrations are summarized in Table 5. Retention times and product ion mass spectra comparisons were consistent with mass spectra libraries created with analytical standards (Figure 3).6 Experiments with β-glucuronidase were also consistent with previous reports6, 8 showing that the detected oxidized metabolites were excreted primarily as glucuronic acid conjugates (Figure 5 and Table 5). Quantification of these metabolites confirm previous reports6, 8 determining that (ω)-hydroxyl and (ω)-carboxyl metabolites (analytes 1 and 2) are major metabolites excreted after JWH-018 use. New data now show that the (ω-1)-hydroxyl metabolite (analyte 3) is also a primary urinary metabolite of JWH-018 and is excreted at higher concentrations than (ω)-hydroxyl (analyte 1) and (ω)-carboxyl metabolite (analyte 2) in these four subjects. The rank order for the concentrations of JWH-018 metabolites excreted in urine of these four subjects is analyte 3 > analyte 1 > analyte 2.
Quantification of JWH-073 metabolites differed somewhat from JWH-018 metabolites. In the 4 specimens, analyte 5 was shown to be the primary metabolite, with urinary concentration ranging from 6.2 to 46 ng/ml, with percent glucuronic acid conjugation ranging from 5.5 to 68%. With the exception of specimen 4, the remaining specimens had non-detectable levels of the (ω)-hydroxyl and (ω-1)-hydroxyl metabolites (Table 5). It is unclear why these differences exist, and further controlled studies are necessary to account for these differences. It is interesting to note that (ω)- and (ω-1)-hydroxyl derivatives (analytes 4 and 6) were only detected in the specimen known to have administered JWH-073 (Specimen 4) and that analyte 5 was present in specimens that presumably administered only JWH-018. It is possible that humans can demethylate JWH-018 to form JWH-073 metabolites, or it is possible that these subjects may have had a previous unexpected exposure to JWH-073. This anomaly could be due to unknown contaminations known to be present in `K2/SPICE' products.
CONCLUSION
This is the first report to use LC-MS/MS methods and analytical standards for ω-1 hydroxylated metabolites of JWH-018 and JWH-073 to simultaneously identify and quantify metabolic products of JWH-018 and JWH-073 excreted in human urine. Using β-glucuronidase pretreatment protocols allows for the quantification and identification of the glucuronic acid conjugates as well. Incorporation of deuterium labeled internal standards and development of new automated solid-phase extraction techniques meets sensitivity, precision, and accuracy requirements for most clinical and forensic laboratories. This analytical procedure can be used in future studies to characterize the human metabolism and clinical effects of JWH-018 and JWH-073. For example, this method provides the ability to begin linking clinical symptoms and toxicological profiles with specific use patterns and relative concentrations of primary metabolites of two common AAIs used in `K2' and `SPICE' products. Data suggest that analytes 1, 2, and 3 are the primary urinary metabolites of JWH-018. Analyte 4, 5, and 6 are the primary urinary metabolites of JWH-073, but more controlled studies are needed to determine if analyte 5 is excreted after JWH-018 use. Inconsistencies in product formulations and the virtual lack of manufacturing quality control measures may introduce an unexpected exposure to JWH-073 and other AAIs. Further controlled clinical studies are needed to continue validating these initial findings.
ACKNOWLEDGEMENTS
This work was supported by a Centers for Disease Control Cooperative Agreement, 200-2007-21729 (JHM); a Bioterrorism Cooperative Agreement, U90/CCU616974-07 (JHM); a National Institutes of Health grant, R01-GM075893 (AR-P); and a Pilot Research Award from the University of Arkansas for Medical Sciences Center for Clinical and Translational Research, supported by a grant from the National Center For Research Resources, 1UL1RR029884. The authors would like to thank Phenomenex for kindly providing solid-phase extraction cartridges. The authors would like to thank Mae De La Calzada from the North Shore University Hospital in Long Island for providing specimens. The authors would also like to thank Stacie M. Bratton and Kan Hui “Nicole” Yiew for assisting with the β-glucuronidase assays.
REFERENCES
- (1).Gaoni YM, R Journal of the American Chemical Society. 1964;86:1646–1647. [Google Scholar]
- (2).Huffman JW. In: The Cannabinoid Receptors, The Receptors. Reggio PH, editor. Vol. 1. Humana Press; 2009. pp. 49–94. [Google Scholar]
- (3).Iversen LL. The Science of Marijuana. 2nd ed. Oxford University Press, Inc.; New York: 2008. [Google Scholar]
- (4).2010. pp. 71635–71638.
- (5).Moller I, Wintermeyer A, Bender K, Jubner M, Thomas A, Krug O, Schanzer W, Thevis M. Drug Test Anal. 2010:24. [Google Scholar]
- (6).Moran CL, Le VH, Chimalakonda KC, Smedley AL, Lackey FD, Owen SN, Kennedy PD, Endres GW, Ciske FL, Kramer JB, Kornilov AM, Bratton LD, Dobrowolski PJ, Wessinger WD, Fantegrossi WE, Prather PP, James LP, Radominska-Pandya A, Moran JH. Anal Chem. doi: 10.1021/ac2005636. [DOI] [PMC free article] [PubMed] [Google Scholar]
- (7).Beuck S, Moller I, Thomas A, Klose A, Schlorer N, Schanzer W, Thevis M. Anal Bioanal Chem. 2011:1. doi: 10.1007/s00216-011-4931-5. [DOI] [PubMed] [Google Scholar]
- (8).Sobolevsky T, Prasolov I, Rodchenkov G. Forensic Sci Int. 200:141–147. doi: 10.1016/j.forsciint.2010.04.003. [DOI] [PubMed] [Google Scholar]
- (9).Grigoryev A, Savchuk S, Melnik A, Moskaleva N, Dzhurko J, Ershov M, Nosyrev A, Vedenin A, Izotov B, Zabirova I, Rozhanets V. J Chromatogr B Analyt Technol Biomed Life Sci. 879:1126–1136. doi: 10.1016/j.jchromb.2011.03.034. 1126. [DOI] [PubMed] [Google Scholar]
- (10).Dresen S, Kneisel S, Weinmann W, Zimmermann R, Auwarter V. J Mass Spectrom. :163–171. doi: 10.1002/jms.1877. [DOI] [PubMed] [Google Scholar]
- (11).Wintermeyer A, Moller I, Thevis M, Jubner M, Beike J, Rothschild MA, Bender K, Thomas A, Krug O, Schanzer W. Anal Bioanal Chem. 398:2141–2153. doi: 10.1007/s00216-010-4171-0. [DOI] [PubMed] [Google Scholar]
- (12).Vearrier D, Osterhoudt KC. Pediatric Emergency Care. 2010;26:462–465. doi: 10.1097/PEC.0b013e3181e4f416. [DOI] [PubMed] [Google Scholar]
- (13).Muller H, Sperling W, Kohrmann M, Huttner HB, Kornhuber J, Maler JM. Schizophrenia Research. 2010;118:309–310. doi: 10.1016/j.schres.2009.12.001. [DOI] [PubMed] [Google Scholar]
- (14).Every-Palmer S. Addiction. 2010;105:1859–1860. doi: 10.1111/j.1360-0443.2010.03119.x. [DOI] [PubMed] [Google Scholar]
- (15).Schneir AB, Cullen J, Ly BT. Journal of Emergency Medicine. 2010 [Google Scholar]
- (16).Seely KA, Prather PL, James LP, Moran JH. Mol Interv. 11:36–51. doi: 10.1124/mi.11.1.6. [DOI] [PMC free article] [PubMed] [Google Scholar]
- (17).Lapoint J, Nelson LS. Emergency Medicine. 2011:26–28. [Google Scholar]
- (18).Dresen S, Ferreiros N, Putz M, Westphal F, Zimmermann R, Auwarter V. Journal of Mass Spectrometry. 2010;45:1186–1194. doi: 10.1002/jms.1811. [DOI] [PubMed] [Google Scholar]
- (19).Lindigkeit R, Boehme A, Eiserloh I, Luebbecke M, Wiggermann M, Ernst L, Beuerle T. Forensic Science International. 2009;191:58–63. doi: 10.1016/j.forsciint.2009.06.008. [DOI] [PubMed] [Google Scholar]
- (20).EMCDDA, European Monitoring Centre for Drugs and Drug Addiction EMCDDA 2009 Thematic paper ed.; Office for Official Publications of the European Communities. 2009. pp. 1–25. [Google Scholar]
- (21).Auwarter V, Dresen S, Weinmann W, Muller M, Putz M, Ferreiros N. Journal of Mass Spectrometry. 2009;44:832–837. doi: 10.1002/jms.1558. [DOI] [PubMed] [Google Scholar]
- (22).Uchiyama N, Kikura-Hanajiri R, Kawahara N, Haishima Y, Goda Y. Chemical and Pharmaceutical Bulletin. 2009;57:439–441. doi: 10.1248/cpb.57.439. [DOI] [PubMed] [Google Scholar]
- (23).Piggee C. Analytical Chemistry. 2009:3205–3207. doi: 10.1021/ac900564u. [DOI] [PubMed] [Google Scholar]
- (24).Salter J. a., Suhr J. 2011.
- (25).Zhang Q, Ma P, Cole RB, Wang G. Anal Bioanal Chem. 2006;386:1345–1355. doi: 10.1007/s00216-006-0717-6. [DOI] [PubMed] [Google Scholar]