Abstract
About 10% of patients with non–small cell lung carcinoma (NSCLC) respond to epidermal growth factor receptor (EGFR)-targeted tyrosine kinase inhibitors (TKIs). More than 75% of “responders” have activating mutations in EGFR. However, mutation analysis is not widely available, and proposed alternatives (in situ hybridization and immunohistochemical analysis) have shown inconsistent associations with outcome. Fluorescence in situ hybridization (FISH), chromogenic in situ hybridization (CISH), immunohistochemical analysis, and DNA sequencing were compared in this study of 40 NSCLC samples from TKI-treated patients. Response rates were 12 of 19 in EGFR-mutant vs 1 of 20 EGFR wild-type tumors (P = .0001), 7 of 19 FISH+ vs 4 of 17 FISH– tumors (not significant [NS]), 5 of 16 CISH+ vs 6 of 21 CISH– tumors (NS), and 3 of 9 immunohistochemically positive vs 7 of 22 immunohistochemically negative tumors (NS). EGFR mutation was associated with improved progression-free survival (P = .0004). Increased copy number (FISH or CISH) and protein expression (immunohistochemical) did not independently predict outcome. Thus, EGFR sequence analysis was the only method useful for predicting response and progression-free survival following TKI therapy in NSCLC.
Keywords: EGFR, Non–small cell lung carcinoma, Mutation, Fluorescence in situ hybridization, Chromogenic in situ hybridization, Immunohistochemistry, Erlotinib
A subset of non–small cell lung carcinomas (NSCLCs) contains an activated epidermal growth factor receptor (EGFR), resulting in up-regulation of downstream prosurvival signals.1 Consequently, most NSCLCs harboring activated EGFR respond to targeted inhibition of this pathway via the tyrosine kinase inhibitors (TKIs) gefitinib and erlotinib.1,2 Somatic mutation in the EGFR kinase domain (exons 18-21) is the principal mechanism of receptor activation,3,4 with the majority occurring in the form of small in-frame deletions in exon 19 or missense mutations in exon 21 (L858R); together, these account for approximately 90% of pathogenic mutations.2 EGFR-activating mutations occur predominantly in adenocarcinoma and rarely in other NSCLC subtypes.5,6 Approximately 20% of lung adenocarcinomas harbor an EGFR mutation.7
About 10% of unselected patients with advanced NSCLC respond to EGFR-targeted TKIs.8,9 Retrospective analysis has revealed that 75% of tumors that respond to TKIs contain an activating mutation.2 The underlying mechanism driving response in the remaining 25% has not been clearly elucidated.
Copy number gain may serve as an alternative or contributory mechanism for EGFR activation. Copy number changes (polysomy) involving the EGFR locus have been frequently seen in classical cytogenetic studies of NSCLC,10 and a subset of adenocarcinomas undergoes EGFR gene amplification.11,12 Several studies have demonstrated that increased copy number as detected by fluorescence in situ hybridization (FISH) predicts benefit from TKI therapy, with longer progression-free and overall survival.11,13,14 However, other studies using FISH or quantitative polymerase chain reaction (PCR) to assess EGFR copy number have failed to demonstrate that this approach predicts benefit from targeted therapy.15,16 Chromogenic in situ hybridization (CISH) is an alternative to FISH that permits in situ assessment of copy number changes using light microscopy, and a good correlation between CISH and FISH for scoring EGFR copy number has been previously demonstrated.17 Clinical studies have demonstrated a correlation between increased copy number by CISH and improved progression-free survival with erlotinib.18
EGFR protein overexpression shown by immunohistochemical analysis can be seen in up to 60% of NSCLCs19; however, there are contradictory data on the correlation between EGFR immunohistochemical status and response to TKI therapy.20,21
All of these assays, including mutation, copy number, and immunohistochemical analysis are available as clinical tests, despite the absence of clear guidelines for testing for EGFR alterations. The in situ assays, particularly CISH and immunohistochemical analysis, are attractive to many practicing pathologists owing to ease of use and potential cost-effectiveness. We undertook this study to determine which approach best predicts response to TKI therapy in patients with advanced NSCLC.
Materials and Methods
Tumors containing a known EGFR-activating mutation and matched wild-type tumors were selected retrospectively to fulfill a balanced study population. Overall, 49 NSCLC samples were obtained from the Brigham and Women’s Hospital, Boston, MA, pathology archives (BWH IRB No. 2004-P-000062) from patients with advanced-stage disease treated with erlotinib or gefitinib following failure of conventional chemotherapy as part of phase 1 and 2 clinical trials at the Dana Farber Cancer Institute, Boston (DFCI protocol 02-180). Assay results were analyzed on tissues obtained at the time of initial diagnosis, before any therapy; 4 samples were excluded because they were subsequent biopsy specimens from patients already included in the study; 2 were excluded because the NSCLC was squamous cell carcinoma; 3 were excluded because patients never received a TKI. The remaining 40 specimens included 21 open lung biopsies, 2 lung needle biopsies, and 17 biopsies from metastatic sites (including lymph nodes, pleura, and distant sites); all cases were adenocarcinoma. Patient outcomes following TKI therapy were graded according to Response Evaluation Criteria in Solid Tumors (RECIST)22 by 2 oncologists (D.M.J. and P.A.J.). For some analyses, patients with stable disease were grouped with “responders” in a “disease control” category.
For EGFR kinase domain mutation analysis, DNA was extracted from dissected formalin-fixed, paraffin-embedded 5-μm tissue sections containing more than 50% tumor cells. The EGFR kinase domain (exons 18 through 24) was amplified using nested PCR, as previously described.4,23 PCR products underwent direct bidirectional sequencing by dye terminator sequencing. Sequence analysis was performed by using Mutation Surveyor (SoftGenetics, State College, PA) and confirmed by a molecular geneticist (V.J.) and molecular pathologist (N.I.L.).
A tissue microarray of formalin-fixed, paraffin-embedded tumor containing five 0.5-mm cores from each sample was constructed. The areas included on the microarray were carefully selected to ensure that heterogeneous tumors, as well as benign internal control tissue, were well represented.
Fluorescence In Situ Hybridization
FISH was performed as follows: BAC clone CTD-2257H21 encompassing the EGFR sequence was purchased from Children’s Hospital Oakland Research Institute (Oakland, CA). The BAC clone DNA was prepared using a QIAGEN kit (QIAGEN, Valencia, CA). One microgram of the EGFR BAC clone DNA was labeled with SpectrumGreen-dUTP (Abbott Molecular, Abbott Park, IL) using a nick translation kit (Abbott). Labeled DNA was ethanol-precipitated and reconstituted by hybridization buffer (50% formamide, 2× saline sodium citrate [SSC], 50 mmol/L phosphate buffer, and 10% dextran sulfate). CEP7 SpectrumAqua was diluted by following the manufacturer’s instructions (Abbott).
Paraffin tissue microarray slides were incubated at 60°C overnight, deparaffinized in xylene, dehydrated in 100% ethanol, and air dried. After incubation in tris(hydroxymethyl)-aminomethane (Tris)-EDTA at 100°C for 45 minutes, the slide was treated with 150 μL of Zymed Digest-All (Zymed-Invitrogen, South San Francisco, CA) under a plastic coverslip at 37°C for 20 minutes and then washed in phosphate-buffered saline and dehydrated in an ethanol series. Next, 400 ng of EGFR probe and 4 μL of CEP7 probe (total volume, 20 μL) were applied and sealed under a coverslip with rubber cement. The probed slide was denatured at 95°C for 3 minutes, and hybridization was carried out in a moist chamber at 37°C for about 44 hours. Hybridized slides were washed in 0.5× SSC at 72°C for 5 minutes, in 0.025% polysorbate/phosphate-buffered saline at room temperature for 2 minutes, and dehydrated in an ethanol series. Finally, the slide was mounted with DAPI II (Abbott) and coverslipped.
Slides were analyzed by using an Olympus fluorescent microscope (Olympus America, Center Valley, PA). For each core, 3 or 4 areas were screened and 50 tumor nuclei were analyzed for EGFR and CEP7 signals by 2 cytogeneticists (Y.X. and C.L.). Images were taken by an equipped CCD camera and Duet software (Bioview, Billerica, MA). The gene copy number was classified according to previously published criteria as follows13: disomy, low polysomy (≤4 copies of EGFR in >40% of cells), high polysomy (≥4 copies of EGFR in >40% of cells), or gene amplified (homogeneously staining regions with ≥15 copies in ≥10% of cells or a gene/chromosome ratio per cell of ≥2) Image 1.
Image 1.
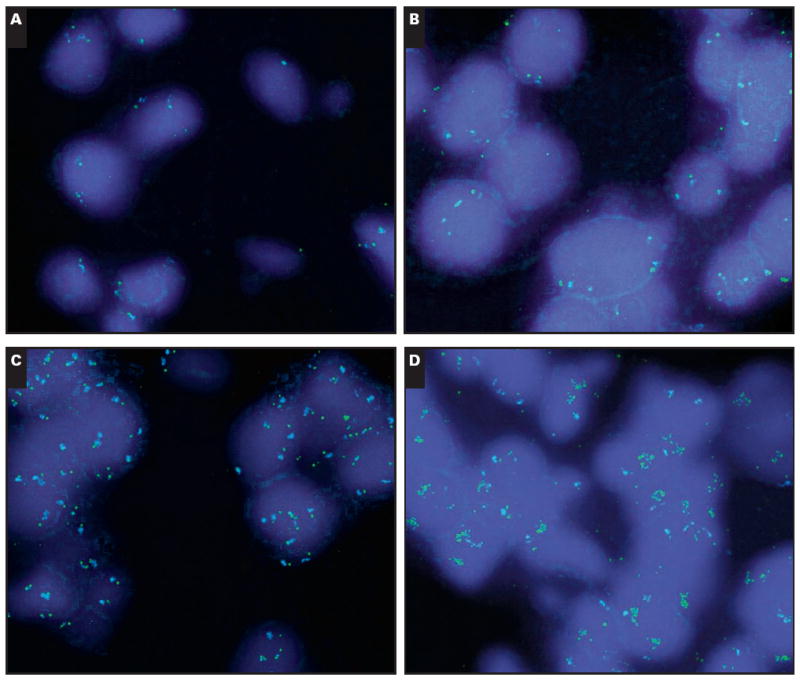
Fluorescent in situ hybridization for epidermal growth factor receptor (EGFR) (green signal) and centromeric 7 (blue signal) showing disomy (A), low polysomy (B), high polysomy (C), and gene amplification (D) in the form of homogeneously staining regions for EGFR (A-D, ×1,000).
Chromogenic In Situ Hybridization
CISH was performed by using the EGFR Amplification Probe (Zymed-Invitrogen) and Zymed CISH detection kit (Zymed-Invitrogen), according to published protocols.17 Briefly, 5-μm sections from the tissue microarray were deparaffinized, dehydrated in ethanol, and washed in distilled water. Slides were boiled in CISH pretreatment buffer for 30 minutes and rinsed in distilled water for 5 minutes at room temperature. The tissue was digested for 10 minutes with pepsin digestion solution at room temperature, washed in distilled water, dehydrated in alcohol, and dried at 37°C. The prepared microarray was incubated with 5 to 7 μL of EGFR probe overnight at 37°C followed by washing in SSC. Immunodetection was performed by using hydrogen peroxide followed by mouse antidigoxigenin antibody and then by horseradish peroxidase–conjugated goat antimouse antibody with a diaminobenzidine chromogen (Zymed-Invitrogen). Slides were counterstained with hematoxylin. Slides were examined under bright-field microscopy, and modal EGFR copy numbers were scored independently by 2 pathologists (L.M.S. and N.I.L.) and categorized as no amplification/low polysomy (<5 per cell), high polysomy (5-8 per cell), or amplified (>8 per cell or homogeneously staining regions) Image 2.
Image 2.
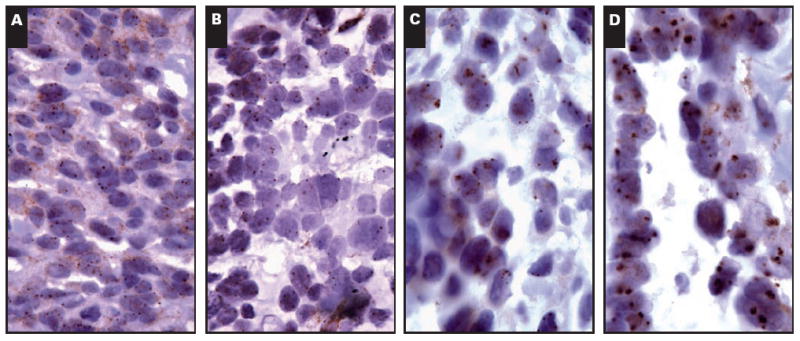
Chromogenic in situ hybridization for epidermal growth factor receptor showing disomy (A), low polysomy (B), high polysomy (C), and gene amplification (D) (A-D, ×400).
Immunohistochemical Studies
Immunohistochemical studies were performed on 5-μm-thick tissue microarray sections. The slides were baked at 60°C for 1 hour; rehydrated with 100% xylene (4 washes for 3 minutes each), 100% ethanol (4 washes for 3 minutes each), and running water (5 minutes); blocked for endogenous peroxidase activity with 1.5% hydrogen peroxidase in methanol (15 minutes); and washed under running water for 5 minutes. The sections were digested with 0.01% bacterial protease type XXIV (Sigma Chemical, St Louis, MO) in prewarmed 5 mmol/L Tris buffer, pH 7.6, at 37°C for 10 minutes; washed under running water for 5 minutes; and transferred into Tris-buffered saline. The slides were incubated for 30 minutes with EGFR antibody clone H11 (DAKO North America, Carpinteria, CA) at a 1:200 dilution and then incubated in horseradish peroxidase–labeled polymer (DAKO) for 30 minutes according to the manufacturer’s instructions. The slides were washed with Tris-buffered saline between incubations. The tissue sections were developed using 3,3′-diaminobenzidine as the chromogen (DAKO) and counterstained with Mayer hematoxylin. The positive control was glioma tumor tissue. Negative controls consisted of incubating the slides with negative control rabbit immunoglobulin (DAKO) in the absence of the primary antibody.
A modified EGFR expression scoring system was based on previously published criteria.24,25 The staining intensity was categorized as follows: 0, no staining; 1+, partial membrane staining; 2+, weak, complete membrane staining; 3+, moderate, complete membrane staining; and 4+, strong, complete membrane staining. The intensity was then multiplied by the percentage of tumor cells staining to give a total score (possible range, 0-400).26 The immunohistochemical data were analyzed according to the following: (1) the intensity alone (cases with intensity ≥2 considered positive); (2) the overall score, with any score of 100 or more considered positive; and (3) by using 10% or more of tumor cells staining as a positive cutoff.26 Immunohistochemical interpretation was independently performed by 2 pathologists (L.M.S. and N.I.L.), and a consensus score was established for all cases Image 3.
Image 3.
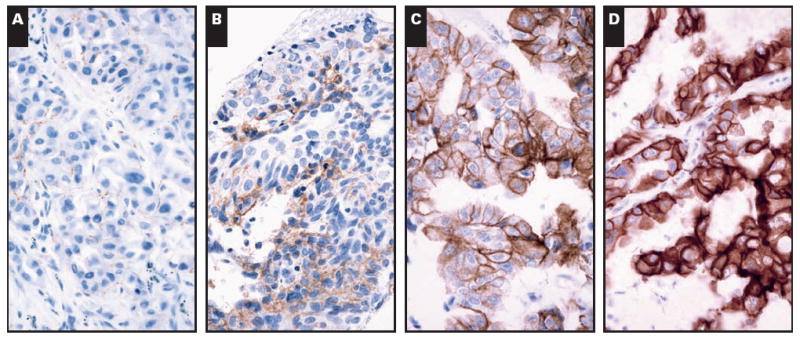
Immunohistochemical staining for epidermal growth factor receptor showing 1+ staining (A), 2+ staining (B), 3+ staining (C), and 4+ staining (D) (A-D, ×400).
Statistical Analysis
The Cohen κ was used to assess CISH score interobserver variability. The level of agreement between CISH and FISH scores was correlated by using nonparametric analysis (Spearman correlation). Associations between copy number and immunohistochemical data were analyzed by using the Jonckheere-Terpstra test. Comparison of assay status vs response outcome following TKI therapy was performed by using the Fisher exact test. Progression-free survival was measured from the date of TKI therapy initiation to the date of progression or relapse as defined by the RECIST criteria. The log-rank (Mantel-Cox) test was used to examine progression-free and overall survival. All reported P values are based on a 2-sided hypothesis. The data analysis was conducted primarily using GraphPad Prism 5 (GraphPad Software, La Jolla, CA) and StatXact 6.0 (Cytel Software, Cambridge, MA) by a biostatistician (B.Y.Y.).
Results
Overall, there were 13 patients with a partial response, 11 patients with stable disease, 15 patients with progressive disease, and 1 patient who discontinued therapy owing to side effects. Patient sex, age, and smoking history in relation to mutation status are detailed in Table 1.
Table 1.
Patient Sex, Age, and Smoking History in Relation to Mutation Status*
| All Cases | Mutated | Wild Type | |
|---|---|---|---|
| Overall | 40 | 19 (48) | 21 (53) |
| Sex | |||
| Female | 26 (65) | 14 (54) | 12 (46) |
| Male | 14 (35) | 5 (36) | 9 (64) |
| Age (y) | |||
| Mean (range) | 64 (35-91) | 61 (41-77) | 70 (35-91) |
| Median | 69 | 62 | 74 |
| > Median | 20 (50) | 5 (25) | 15 (75) |
| Tobacco use | |||
| Current or former | 29 (73) | 11 (38) | 18 (62) |
| No | 11 (28) | 8 (73) | 3 (27) |
Data are given as number (percentage) unless otherwise indicated.
EGFR sequence data were available for all tumors, as the study was designed to include approximately 50% mutated and 50% wild-type tumors. A minority of cases could not be assessed by CISH (3 cases) or FISH (3 cases) owing to low signal. Tumor tissue was exhausted on deeper levels of the microarray in 8 cases (20% core dropout rate) and, therefore, could not be assessed by immunohistochemical analysis. The overall numbers of EGFR-mutated, copy number–positive, and immunohistochemically positive tumors are shown in Table 2.
Table 2.
Number of Cases With EGFR Mutation, Copy Number Positivity, or EGFR Protein Expression Positivity*
| EGFR Alteration | Positive | Negative | Assay Failure | Total |
|---|---|---|---|---|
| Mutation | 19 (48) | 21 | — | 40 |
| Copy number | ||||
| Chromogenic in situ hybridization | 16 (43) | 21 | 3 | 37 |
| Fluorescence in situ hybridization | 20 (54) | 17 | 3 | 37 |
| Immunohistochemical results | ||||
| Intensity | 14 (44) | 18 | 8 | 32 |
| Score | 10 (31) | 22 | 8 | 32 |
| ≥10% cutoff | 21 (66) | 11 | 8 | 32 |
EGFR, epidermal growth factor receptor.
Data are given as number (percentage) or number of cases.
Of the 19 mutated tumors, 15 (79%) contained exon 19 deletion mutations, 3 (16%) had L858R mutations, and 1 (5%) had a G719C mutation.
Of 37 analyzable tumors, 16 (43%) and 20 (54%) were CISH+ and FISH+, respectively (Table 2). CISH and FISH showed good correlation (Spearman r = 0.75; P < .0001) (data not shown), consistent with previous reports.17 CISH scoring was readily reproducible for most low-copy-number (<4 signals per cell; 87% interobserver agreement, κ = 0.72) and high-copy-number (>5 signals per cell; 92% interobserver agreement, κ = 0.81) cases. However, CISH scoring for cases borderline between low and high polysomy (between 4 and 5 signals per cell) had higher interobserver variability (83% interobserver agreement, κ = 0.59; data not shown).
Of 32 tumors, 10 (31%) had an immunohistochemical score of 100 or more. We also examined more sensitive immunohistochemical evaluation systems. We categorized tumors according to modal immunohistochemical intensity, without regard for number of cells staining; 14 tumors (44%) had a positive intensity score (≥2). We also categorized tumors as positive or negative based on a cutoff of 10% or more tumor cells staining; 21 (66%) were considered positive with this method.
EGFR alteration was correlated with outcome following TKI therapy. Patients with mutated tumors were significantly more likely to respond than patients with copy number or immunohistochemical positivity Table 3. Conversely, 12 (92%) of 13 responders had an EGFR-mutated tumor, whereas only 4 (36%) of 11 patients with stable disease and 2 (14%) of 14 patients with progressive disease had an EGFR-mutated tumor (P = .0001) Figure 1. A total of 8 cases negative for an EGFR mutation demonstrated a favorable outcome (1 responder and 7 patients with stable disease). Of these, 2 (25%) of 8 were copy number–positive, 3 (50%) of 6 were immunohistochemical score positive, and 4 (67%) of 6 were immunohistochemical intensity positive. Copy number positivity did not correlate with response to therapy or with disease control (Table 3, Figure 1). Likewise, immunohistochemical positivity, whether qualified as a score of 100 or more, an intensity of 2 or more, or 10% or more of cells staining, did not correlate with response to therapy or with disease control (Table 3) Figure 2.
Table 3.
Patient Outcomes According to EGFR Mutation, Copy Number, and Immunohistochemical Positivity or Negativity*
| Assay | Total | Response | P† | Stable | Disease Controlled | P‡ | Disease Progression |
|---|---|---|---|---|---|---|---|
| Mutation | >.0001 | .008 | |||||
| Positive | 19 | 12 (63) | 4 (21) | 16 (84) | 3 (16) | ||
| Negative | 20 | 1 (5) | 7 (35) | 8 (40) | 12 (60) | ||
| Copy number | |||||||
| CISH | 1 | 1 | |||||
| Positive | 15 | 5 (33) | 4 (27) | 9 (60) | 6 (40) | ||
| Negative | 21 | 6 (29) | 7 (33) | 13 (62) | 8 (38) | ||
| FISH | .5 | 1 | |||||
| Positive | 19 | 7 (37) | 5 (26) | 12 (63) | 7 (37) | ||
| Negative | 17 | 4 (24) | 6 (35) | 10 (59) | 7 (41) | ||
| Immunohistochemical results | |||||||
| Score | 1 | .4 | |||||
| Positive | 9 | 3 (33) | 4 (44) | 7 (78) | 2 (22) | ||
| Negative | 22 | 7 (32) | 5 (23) | 12 (55) | 10 (45) | ||
| Intensity | 1 | .2 | |||||
| Positive | 13 | 4 (31) | 6 (46) | 10 (77) | 3 (23) | ||
| Negative | 18 | 6 (33) | 3 (17) | 9 (50) | 9 (50) | ||
| Cutoff | 1 | .3 | |||||
| ≥10% | 20 | 7 (35) | 7 (35) | 14 (70) | 6 (30) | ||
| <10% | 11 | 3 (27) | 2 (18) | 5 (45) | 6 (55) |
EGFR, epidermal growth factor receptor; CISH, chromogenic in situ hybridization; FISH, fluorescence in situ hybridization.
Data are given as number (percentage).
Reflects comparison of responders in positive vs negative assay groups.
Reflects comparison of all patients with disease control in positive vs negative assay groups; Fisher exact test.
Figure 1.
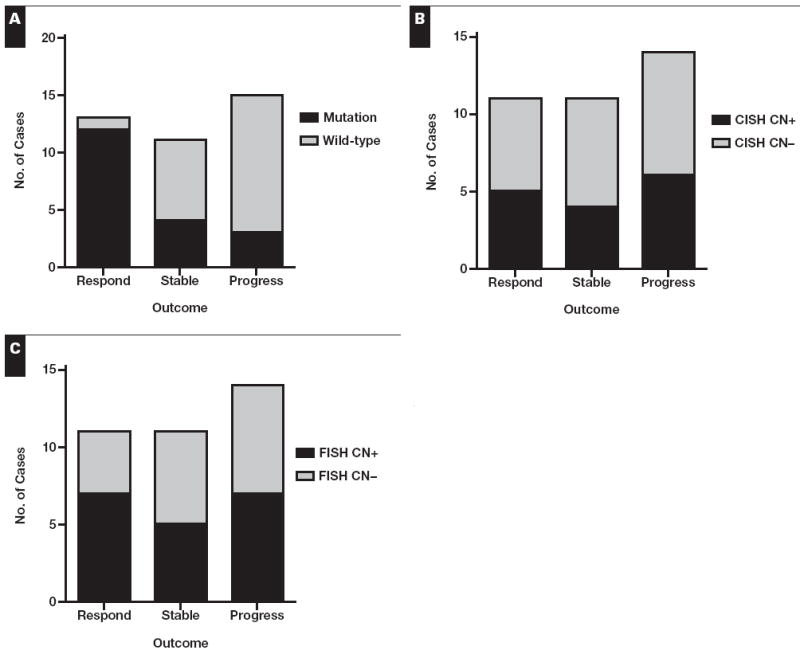
Comparison of assay result vs clinical outcome for epidermal growth factor receptor mutation (A), chromogenic in situ hybridization score (B), and FISH score (C). A, P = .0001; B, P = 1; C, P = .8; Fisher exact test. CN, copy number.
Figure 2.
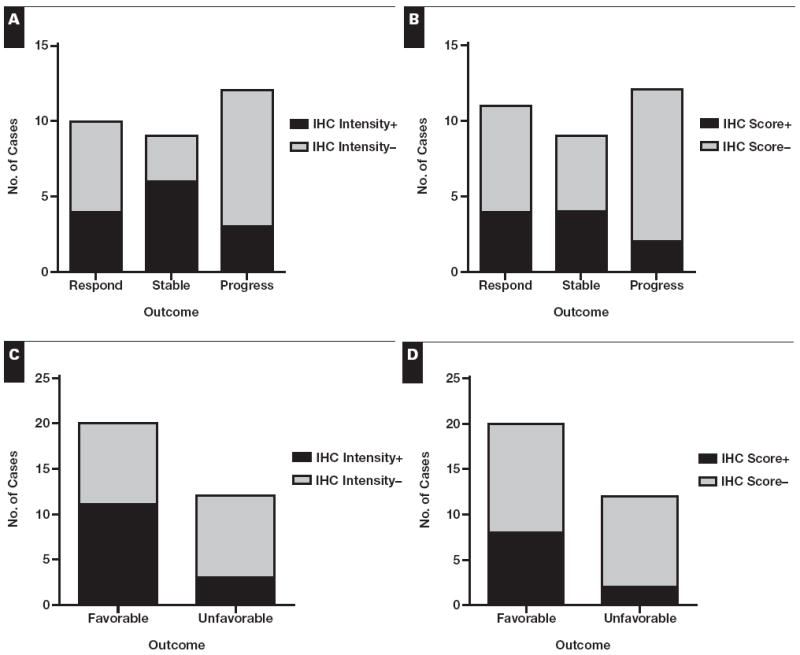
Comparison of immunohistochemical (IHC) result vs clinical outcome. Data are shown for IHC stains evaluated according to intensity (≥2 considered positive) (A and C) and score (intensity multiplied by percentage of cells staining; ≥100 considered positive) (B and D). The responders and patients with stable disease are grouped under “favorable” in C and D. Although they appear different, the findings in C and D are nonsignificant owing to low power and would require n = 52 in C and n = 82 in D for 80% power at a 5% significance level. A, P = .16; B, P = .4; C, P = .15; D, P = .25.
The sensitivity and specificity of each assay for predicting response to therapy are detailed in Table 4. Mutation analysis is the most sensitive and specific assay for predicting response to TKI therapy. CISH and FISH both have poor sensitivity and specificity for predicting response, stable disease, or any disease control. Of note, the immunohistochemical score has poor sensitivity for predicting response to TKI but equivalent specificity to mutation analysis for predicting response and superior specificity for predicting stable disease. Immunohistochemical intensity has slightly better but still poor sensitivity and slightly less specificity than overall score for predicting response to TKIs. Immunohistochemical positivity based on a 10% cutoff showed improved sensitivity over other immunohistochemical scoring methods for response, stable disease, or disease control but showed poor specificity overall.
Table 4.
Sensitivity and Specificity of Each Assay for Predicting for Response, Stable Disease, or Any Disease Control
| Assay | Response
|
Stable
|
Disease Control
|
|||
|---|---|---|---|---|---|---|
| Sensitivity (%) | Specificity (%) | Sensitivity (%) | Specificity (%) | Sensitivity (%) | Specificity (%) | |
| Mutation | 92 | 76 | 36 | 48 | 67 | 86 |
| Copy number | ||||||
| CISH | 45 | 60 | 36 | 56 | 41 | 57 |
| FISH | 64 | 52 | 45 | 44 | 55 | 50 |
| Immunohistochemical results | ||||||
| Score | 30 | 71 | 44 | 77 | 37 | 83 |
| Intensity | 40 | 57 | 67 | 68 | 53 | 75 |
| 10% cutoff | 70 | 38 | 78 | 41 | 74 | 50 |
We next examined whether copy number or immunohistochemical positivity impacted on outcomes when analyzed in the context of the mutation status. For the mutated cases, all of the copy number–positive tumors showed disease control following TKI therapy, whereas the 2 cases with disease progression were copy number–negative (among mutated tumors, copy number positivity in disease-controlled cases vs progressive cases trends toward significance, P = .1). In contrast, for the wild-type cases, the majority of copy number–positive cases involved progressive disease Figure 3A and Figure 3B. Likely owing to the relatively low number of cases examined, these observations were not statistically significant. Similar patterns were observed for immunohistochemical positivity and outcome Figure 3C and Figure 3D.
Figure 3.
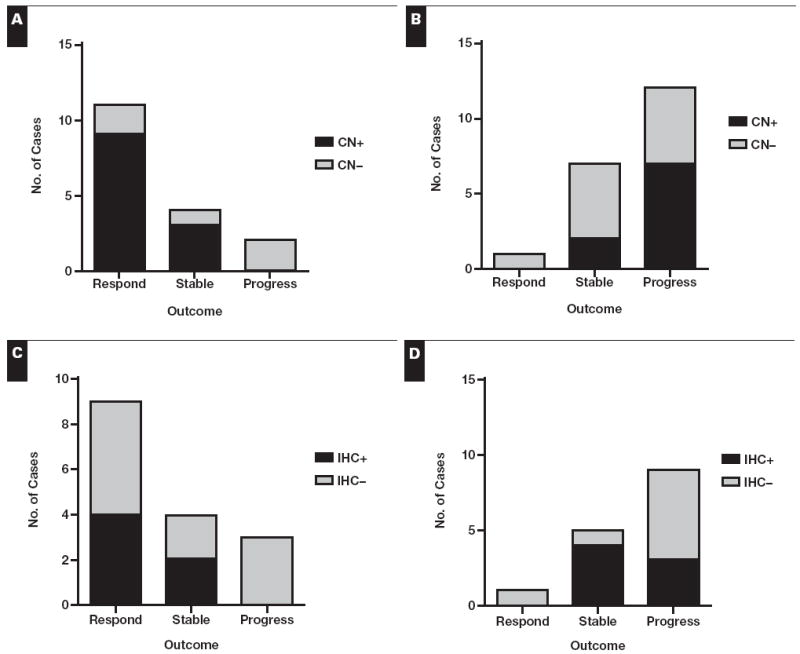
Comparison of copy number (CN) vs clinical outcome in mutated cases only (A) and wild-type cases only (B). The fluorescence in situ hybridization result was used in this comparison for all cases except for 2 with only chromogenic in situ hybridization results available. Comparison of immunohistochemical (IHC) score vs clinical outcome in epidermal growth factor receptor–mutated cases only (C) and wild-type cases only (D). Comparison of IHC positivity vs outcome based on intensity or 10% cutoff showed similar patterns.
Time to progression (TTP) and overall survival data were available for 35 patients. However, 1 of the patients with progressive disease and an EGFR mutation was subsequently found to have a T790M resistance mutation in multiple meta-static sites27,28 and, thus, was excluded from the survival analysis. The median follow-up time was 14.8 months; all patients had died at the last follow-up. Mutation status was the only statistically significant predictor of time to progression, with a median TTP of 13.2 months in mutation-positive patients vs 3.7 months in mutation-negative patients (P = .0004) Figure 4. Although patients with EGFR-mutated tumors had longer overall survival than patients with wild-type tumors, this difference was not statistically significant (19.2 vs 9.4 months; P = .16). CISH, FISH, and immunohistochemical (by score, intensity, or 10% cutoff) positivity failed to predict improved TTP or overall survival.
Figure 4.
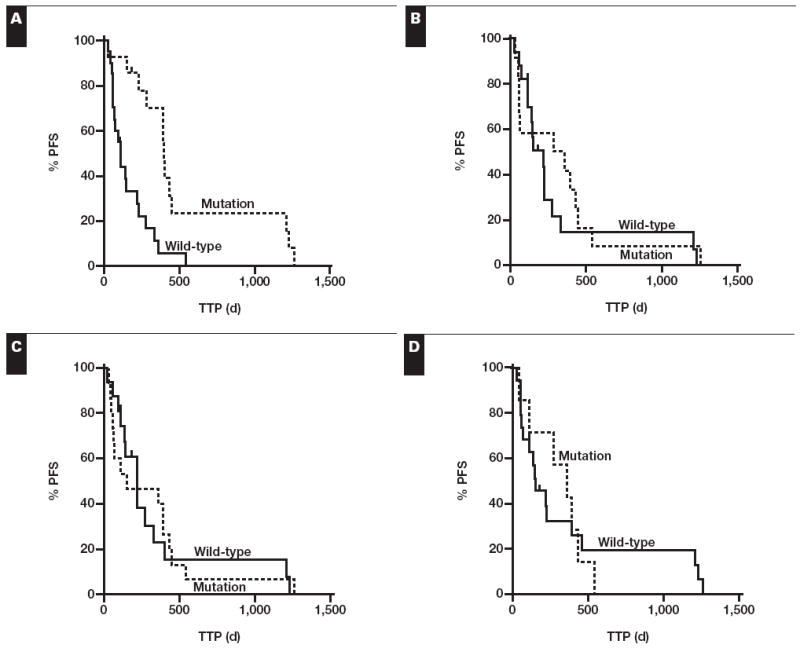
Kaplan-Meier survival curves comparing time to progression (TTP) for wild-type vs epidermal growth factor receptor–mutated cases (A), chromogenic in situ hybridization (CISH) copy number–negative vs copy number–positive cases (B), fluorescence in situ hybridization (FISH) copy number–negative vs copy number–positive cases (C), and immunohistochemical (IHC) score–negative vs IHC score–positive cases (D). A, P = .0004; B, P = .5; C, P = 1; D, P = .9. PFS, progression-free survival.
Correlation of mutation and copy number status revealed no statistically significant difference in the frequency of CISH positivity in EGFR-mutated (9/17 [53%]) and wild-type (7/20 [35%]) tumors (P = .3). Similarly, FISH positivity occurred in 11 (65%) of 17 EGFR-mutated vs 9 (45%) of 20 wild-type tumors (P = .3). There was no significant difference between the frequency of immunohistochemical score positivity in the EGFR-mutated (4/16) and EGFR wild-type (6/16) tumors (P = .7) or for positivity based on immunohistochemical intensity (6/16 mutated vs 8/16 wild type; P = .7) or 10% cutoff (11/16 mutated vs 10/16 wild type; P = 1.0).
In contrast, EGFR copy number and immunohistochemical results did correlate positively, with stronger staining in the presence of higher copy number. Immunohistochemical intensity demonstrated the best correlation with EGFR FISH (P = .0005) and EGFR CISH (P = .0096). The association of immunohistochemical score was still positive but slightly weaker with EGFR FISH (P = .0108) and EGFR CISH (P = .0123). Immunohistochemical positivity based on the 10% cutoff correlated with EGFR FISH (P = .006) but was not significantly associated with EGFR CISH (P = .06).
Discussion
In this study, we demonstrated that EGFR mutation status is the best predictor of response to TKI therapy in a heterogeneous Western population with advanced adenocarcinoma. Because somatic EGFR mutations are relatively rare in Western populations with NSCLC (ie, ~10%), we chose to design a retrospective study enriched for the presence of tumors with mutations. We then examined the usefulness of EGFR kinase domain sequencing vs copy number and immunohistochemical analysis in predicting outcomes following TKI therapy.
By design, about 50% of tumors contained an EGFR-activating mutation. We found copy number alterations by CISH and FISH also in approximately half of the cases, albeit in a combination of mutated and wild-type tumors. Likewise, by EGFR immunohistochemical analysis, we found at least focal complete membranous staining in tumor cells in half of the cases and 10% or more of tumor cells staining in 66% of cases. When more stringent criteria for immunohistochemical positivity were used (ie, at least weak complete membranous staining in ≥50% of tumor cells), only about a third of cases were considered positive.
The presence of an EGFR mutation independently predicted for progression-free survival following TKI therapy. In contrast, CISH, FISH, and immunohistochemical analysis did not independently predict for this outcome. In our analysis, mutation status was highly sensitive (92%) and moderately specific (76%) for predicting response to therapy. The sensitivity is higher than previously reported,15,29,30 which may reflect sampling bias. The specificity, however, is similar to previous reports.2 We noted a trend toward immunohistochemical positivity predicting for stable disease. Immunohistochemical score positivity also demonstrated moderate specificity (up to 83%) but poor sensitivity for predicting disease control. Not surprisingly, the use of a 10% cutoff to define immunohistochemically positive (the method that most often called cases positive) demonstrated good sensitivity but poor specificity in predicting favorable outcomes.
The response rate (63% among patients with mutated tumors) is similar to previous reports.31-33 One of the EGFR-mutated progressive cases was found to have a T790M resistance mutation in subsequent metastasis samples. Possible mechanisms underlying failure to respond in the other cases include undetected secondary EGFR resistance mutations27,28 or MET oncogene activation.34,35
Prior reports have demonstrated that copy number positivity predicts for improved outcomes following TKI therapy.11,18,29 This may not be an independent association, however. In fact, whereas 1 group noted improved relative response in tumors with increased copy number by univariate analysis, this association was lost with a multivariate analysis taking mutation status into account.18 Similarly, we demonstrated a clear trend toward increased copy number in the mutated tumors that responded to TKIs. In contrast, wild-type tumors with copy number positivity tended to progress during therapy. These findings suggest that EGFR copy number changes in the context of an associated EGFR mutation may contribute to the dependence of the tumor cell on signaling through the EGFR pathway (so-called oncogene addiction),2 whereas copy number changes in EGFR wild-type tumors may simply reflect underlying aneuploidy.
EGFR protein expression and copy number showed a positive correlation, as has been previously reported.36 Protein expression, like copy number positivity, tended to occur more commonly in mutated tumors that showed a favorable response to therapy. In wild-type tumors, it tended to occur more commonly in patients with stable disease. However, in both situations, this association was not significant. A larger study is needed to establish whether EGFR immunohistochemical positivity may be a useful predictor of stable disease in TKI-treated patients with EGFR wild-type tumors.
Our study is potentially limited by several factors. Our use of a tissue microarray for the in situ assays provides a limited sampling of tumor tissue. Lung cancer is being increasingly recognized as molecularly heterogeneous,37,38 particularly in regard to copy number changes. We sampled up to 5 different areas of each tumor to account for the possibility of focal areas of EGFR copy number gain. However, because we did not examine full sections of tumor, the possibility remains that we underestimated the number of cases with EGFR copy number or immunohistochemical positivity. In addition, we did not include KRAS mutation or MET activation analysis in this study, so we cannot exclude the possibility that our time to progression and survival data may be influenced in part by underlying KRAS mutations or alterations in other unexamined oncogenes. However, recent studies have demonstrated that patients with EGFR-wild type tumors treated with first-line erlotinib or gefitinib do poorly regardless of the KRAS mutation status.39
Data on the usefulness of EGFR mutation analysis as a prospective tool in NSCLC treatment decisions are evolving. A recently published large, multicenter study of EGFR mutation screening in patients with NSCLC demonstrated that prospective mutation analysis can identify a population with an erlotinib response rate of 70%,40 and an analysis of prospective trials of gefitinib monotherapy vs chemotherapy as first-line therapy in patients with EGFR mutations has demonstrated a significant improvement in progression-free survival in patients receiving gefitinib.41 Although clinical outcome data for our center are not yet available, prospective EGFR mutation testing has been implemented to guide therapy.
Based on the results of this study, EGFR mutation analysis is the preferred test method for selecting patients with advanced, chemorefractory lung adenocarcinoma who are most likely to respond to erlotinib or gefitinib therapy. Although copy number or immunohistochemical positivity may have a role for predicting progression-free survival within an EGFR-mutated subset of patients, these tests are not independently informative.
Acknowledgments
Supported by grant R01 CA114465 from National Institutes of Health, Bethesda, MD (Dr Jänne).
References
- 1.Sordella R, Bell DW, Haber DA, et al. Gefitinib-sensitizing EGFR mutations in lung cancer activate anti-apoptotic pathways. Science. 2004;305:1163–1167. doi: 10.1126/science.1101637. [DOI] [PubMed] [Google Scholar]
- 2.Sharma SV, Bell DW, Settleman J, et al. Epidermal growth factor receptor mutations in lung cancer. Nat Rev Cancer. 2007;7:169–181. doi: 10.1038/nrc2088. [DOI] [PubMed] [Google Scholar]
- 3.Lynch TJ, Bell DW, Sordella R, et al. Activating mutations in the epidermal growth factor receptor underlying responsiveness of non–small-cell lung cancer to gefitinib. N Engl J Med. 2004;350:2129–2139. doi: 10.1056/NEJMoa040938. [DOI] [PubMed] [Google Scholar]
- 4.Paez JG, Janne PA, Lee JC, et al. EGFR mutations in lung cancer: correlation with clinical response to gefitinib therapy. Science. 2004;304:1497–1500. doi: 10.1126/science.1099314. [DOI] [PubMed] [Google Scholar]
- 5.Pao W, Miller V, Zakowski M, et al. EGF receptor gene mutations are common in lung cancers from “never smokers” and are associated with sensitivity of tumors to gefitinib and erlotinib. Proc Natl Acad Sci U S A. 2004;101:13306–13311. doi: 10.1073/pnas.0405220101. [DOI] [PMC free article] [PubMed] [Google Scholar]
- 6.Shigematsu H, Lin L, Takahashi T, et al. Clinical and biological features associated with epidermal growth factor receptor gene mutations in lung cancers. J Natl Cancer Inst. 2005;97:339–346. doi: 10.1093/jnci/dji055. [DOI] [PubMed] [Google Scholar]
- 7.Ding L, Getz G, Wheeler DA, et al. Somatic mutations affect key pathways in lung adenocarcinoma. Nature. 2008;455:1069–1075. doi: 10.1038/nature07423. [DOI] [PMC free article] [PubMed] [Google Scholar]
- 8.Fukuoka M, Yano S, Giaccone G, et al. Multi-institutional randomized phase II trial of gefitinib for previously treated patients with advanced non–small-cell lung cancer (The IDEAL 1 Trial) J Clin Oncol. 2003;21:2237–2246. doi: 10.1200/JCO.2003.10.038. correction appeared in J Clin Oncol. 2004;22:4811. [DOI] [PubMed] [Google Scholar]
- 9.Kris MG, Natale RB, Herbst RS, et al. Efficacy of gefitinib, an inhibitor of the epidermal growth factor receptor tyrosine kinase, in symptomatic patients with non–small cell lung cancer: a randomized trial. JAMA. 2003;290:2149–2158. doi: 10.1001/jama.290.16.2149. [DOI] [PubMed] [Google Scholar]
- 10.Testa JR, Siegfried JM. Chromosome abnormalities in human non–small cell lung cancer. Cancer Res. 1992;52(9 suppl):2702s–2706s. [PubMed] [Google Scholar]
- 11.Cappuzzo F, Hirsch FR, Rossi E, et al. Epidermal growth factor receptor gene and protein and gefitinib sensitivity in non–small-cell lung cancer. J Natl Cancer Inst. 2005;97:643–655. doi: 10.1093/jnci/dji112. [DOI] [PubMed] [Google Scholar]
- 12.Takano T, Ohe Y, Sakamoto H, et al. Epidermal growth factor receptor gene mutations and increased copy numbers predict gefitinib sensitivity in patients with recurrent non–small-cell lung cancer. J Clin Oncol. 2005;23:6829–6837. doi: 10.1200/JCO.2005.01.0793. [DOI] [PubMed] [Google Scholar]
- 13.Hirsch FR, Varella-Garcia M, McCoy J, et al. Increased epidermal growth factor receptor gene copy number detected by fluorescence in situ hybridization associates with increased sensitivity to gefitinib in patients with bronchioloalveolar carcinoma subtypes: a Southwest Oncology Group study. J Clin Oncol. 2005;23:6838–6845. doi: 10.1200/JCO.2005.01.2823. [DOI] [PubMed] [Google Scholar]
- 14.Zhu CQ, da Cunha Santos G, Ding K, et al. Role of KRAS and EGFR as biomarkers of response to erlotinib in National Cancer Institute of Canada Clinical Trials Group Study BR.21. J Clin Oncol. 2008;26:4268–4275. doi: 10.1200/JCO.2007.14.8924. [DOI] [PubMed] [Google Scholar]
- 15.Sequist LV, Martins RG, Spigel D, et al. First-line gefitinib in patients with advanced non–small-cell lung cancer harboring somatic EGFR mutations. J Clin Oncol. 2008;26:2442–2449. doi: 10.1200/JCO.2007.14.8494. [DOI] [PubMed] [Google Scholar]
- 16.Bell DW, Lynch TJ, Haserlat SM, et al. Epidermal growth factor receptor mutations and gene amplification in non–small-cell lung cancer: molecular analysis of the IDEAL/INTACT gefitinib trials. J Clin Oncol. 2005;23:8081–8092. doi: 10.1200/JCO.2005.02.7078. [DOI] [PubMed] [Google Scholar]
- 17.Sholl LM, John Iafrate A, Chou YP, et al. Validation of chromogenic in situ hybridization for detection of EGFR copy number amplification in nonsmall cell lung carcinoma. Mod Pathol. 2007;20:1028–1035. doi: 10.1038/modpathol.3800946. [DOI] [PubMed] [Google Scholar]
- 18.Miller VA, Riely GJ, Zakowski MF, et al. Molecular characteristics of bronchioloalveolar carcinoma and adenocarcinoma, bronchioloalveolar carcinoma subtype, predict response to erlotinib. J Clin Oncol. 2008;26:1472–1478. doi: 10.1200/JCO.2007.13.0062. [DOI] [PubMed] [Google Scholar]
- 19.Veale D, Ashcroft T, Marsh C, et al. Epidermal growth factor receptors in non–small cell lung cancer. Br J Cancer. 1987;55:513–516. doi: 10.1038/bjc.1987.104. [DOI] [PMC free article] [PubMed] [Google Scholar]
- 20.Hirsch FR, Varella-Garcia M, Cappuzzo F, et al. Combination of EGFR gene copy number and protein expression predicts outcome for advanced non–small-cell lung cancer patients treated with gefitinib. Ann Oncol. 2007;18:752–760. doi: 10.1093/annonc/mdm003. [DOI] [PubMed] [Google Scholar]
- 21.Parra HS, Cavina R, Latteri F, et al. Analysis of epidermal growth factor receptor expression as a predictive factor for response to gefitinib (“Iressa,” ZD1839) in non–small-cell lung cancer. Br J Cancer. 2004;91:208–212. doi: 10.1038/sj.bjc.6601923. [DOI] [PMC free article] [PubMed] [Google Scholar]
- 22.Therasse P, Arbuck SG, Eisenhauer EA, et al. New guidelines to evaluate the response to treatment in solid tumors. J Natl Cancer Inst. 2000;92:205–216. doi: 10.1093/jnci/92.3.205. [DOI] [PubMed] [Google Scholar]
- 23.Sequist LV, Joshi VA, Janne PA, et al. Epidermal growth factor receptor mutation testing in the care of lung cancer patients. Clin Cancer Res. 2006;12(14 pt 2):4403s–4408s. doi: 10.1158/1078-0432.CCR-06-0099. [DOI] [PubMed] [Google Scholar]
- 24.Dacic S, Flanagan M, Cieply K, et al. Significance of EGFR protein expression and gene amplification in non–small cell lung carcinoma. Am J Clin Pathol. 2006;125:860–865. doi: 10.1309/H5UW-6CPC-WWC9-2241. [DOI] [PubMed] [Google Scholar]
- 25.Li AR, Chitale D, Riely GJ, et al. EGFR mutations in lung adenocarcinomas: clinical testing experience and relationship to EGFR gene copy number and immunohistochemical expression. J Mol Diagn. 2008;10:242–248. doi: 10.2353/jmoldx.2008.070178. [DOI] [PMC free article] [PubMed] [Google Scholar]
- 26.Hirsch FR, Dziadziuszko R, Thatcher N, et al. Epidermal growth factor receptor immunohistochemistry: comparison of antibodies and cutoff points to predict benefit from gefitinib in a phase 3 placebo-controlled study in advanced nonsmall-cell lung cancer. Cancer. 2008;112:1114–1121. doi: 10.1002/cncr.23282. [DOI] [PMC free article] [PubMed] [Google Scholar]
- 27.Kobayashi S, Boggon TJ, Dayaram T, et al. EGFR mutation and resistance of non–small-cell lung cancer to gefitinib. N Engl J Med. 2005;352:786–792. doi: 10.1056/NEJMoa044238. [DOI] [PubMed] [Google Scholar]
- 28.Pao W, Miller VA, Politi KA, et al. Acquired resistance of lung adenocarcinomas to gefitinib or erlotinib is associated with a second mutation in the EGFR kinase domain. PLoS Med. 2005;2:e73. doi: 10.1371/journal.pmed.0020073. [DOI] [PMC free article] [PubMed] [Google Scholar]
- 29.Hirsch FR, Varella-Garcia M, Bunn PA, Jr, et al. Molecular predictors of outcome with gefitinib in a phase III placebo-controlled study in advanced non–small-cell lung cancer. J Clin Oncol. 2006;24:5034–5042. doi: 10.1200/JCO.2006.06.3958. [DOI] [PubMed] [Google Scholar]
- 30.Niho S, Kubota K, Goto K, et al. First-line single agent treatment with gefitinib in patients with advanced non–small-cell lung cancer: a phase II study. J Clin Oncol. 2006;24:64–69. doi: 10.1200/JCO.2005.02.5825. [DOI] [PubMed] [Google Scholar]
- 31.Inoue A, Suzuki T, Fukuhara T, et al. Prospective phase II study of gefitinib for chemotherapy-naive patients with advanced non–small-cell lung cancer with epidermal growth factor receptor gene mutations. J Clin Oncol. 2006;24:3340–3346. doi: 10.1200/JCO.2005.05.4692. [DOI] [PubMed] [Google Scholar]
- 32.Jackman DM, Yeap BY, Lindeman NI, et al. Phase II clinical trial of chemotherapy-naive patients ≥70 years of age treated with erlotinib for advanced non–small-cell lung cancer. J Clin Oncol. 2007;25:760–766. doi: 10.1200/JCO.2006.07.5754. [DOI] [PubMed] [Google Scholar]
- 33.Sunaga N, Tomizawa Y, Yanagitani N, et al. Phase II prospective study of the efficacy of gefitinib for the treatment of stage III/IV non–small cell lung cancer with EGFR mutations, irrespective of previous chemotherapy. Lung Cancer. 2007;56:383–389. doi: 10.1016/j.lungcan.2007.01.025. [DOI] [PubMed] [Google Scholar]
- 34.Bean J, Brennan C, Shih JY, et al. MET amplification occurs with or without T790M mutations in EGFR mutant lung tumors with acquired resistance to gefitinib or erlotinib. Proc Natl Acad Sci U S A. 2007;104:20932–20937. doi: 10.1073/pnas.0710370104. [DOI] [PMC free article] [PubMed] [Google Scholar]
- 35.Engelman JA, Zejnullahu K, Mitsudomi T, et al. MET amplification leads to gefitinib resistance in lung cancer by activating ERBB3 signaling. Science. 2007;316:1039–1043. doi: 10.1126/science.1141478. [DOI] [PubMed] [Google Scholar]
- 36.Gupta R, Dastane AM, Forozan F, et al. Evaluation of EGFR abnormalities in patients with pulmonary adenocarcinoma: the need to test neoplasms with more than one method. Mod Pathol. 2009;22:128–133. doi: 10.1038/modpathol.2008.182. [DOI] [PubMed] [Google Scholar]
- 37.Tang X, Varella-Garcia M, Xavier AC, et al. Epidermal growth factor receptor abnormalities in the pathogenesis and progression of lung adenocarcinomas. Cancer Prev Res (Phila Pa) 2008;1:192–200. doi: 10.1158/1940-6207.CAPR-08-0032. [DOI] [PMC free article] [PubMed] [Google Scholar]
- 38.Yatabe Y, Takahashi T, Mitsudomi T. Epidermal growth factor receptor gene amplification is acquired in association with tumor progression of EGFR-mutated lung cancer. Cancer Res. 2008;68:2106–2111. doi: 10.1158/0008-5472.CAN-07-5211. [DOI] [PubMed] [Google Scholar]
- 39.Jackman DM, Miller VA, Cioffredi LA, et al. Impact of epidermal growth factor receptor and KRAS mutations on clinical outcomes in previously untreated non–small cell lung cancer patients: results of an online tumor registry of clinical trials. Clin Cancer Res. 2009;15:5267–5273. doi: 10.1158/1078-0432.CCR-09-0888. [DOI] [PMC free article] [PubMed] [Google Scholar]
- 40.Rosell R, Moran T, Queralt C, et al. Screening for epidermal growth factor receptor mutations in lung cancer. N Engl J Med. 2009;361:958–967. doi: 10.1056/NEJMoa0904554. [DOI] [PubMed] [Google Scholar]
- 41.Morita S, Okamoto I, Kobayashi K, et al. Combined survival analysis of prospective clinical trials of gefitinib for non–small cell lung cancer with EGFR mutations. Clin Cancer Res. 2009;15:4493–4498. doi: 10.1158/1078-0432.CCR-09-0391. [DOI] [PubMed] [Google Scholar]


