

Abstract
Structural biology plays a central role in gaining a full understanding of the myriad roles of RNA in biology. In recent years, innovative approaches in RNA purification and crystallographic methods have lead to the visualization of an increasing number of unique structures, providing new insights into its function at the atomic level. This article presents general protocols which have streamlined the process of obtaining a homogeneous sample of properly folded and active RNA in high concentrations that crystallizes well in the presence of a suitable heavy-atom for phasing. Of particular importance are approaches toward RNA crystallography that include exploring “construct space” as opposed to “condition space”. Moreover, development of a highly flexible method for experimentally phasing RNA crystals may open the door to a relatively simple means of solving these structures.
Keywords: RNA purification, RNA synthesis, riboswitch, aptamer, RNA crystallography, heavy-atom derivative
1. Introduction
The last decade has witnessed a rapid growth in the number of RNA structures determined by X-ray crystallography. Landmark structures such as the minimal hammerhead ribozyme (1, 2) and the P4–P6 domain of the Tetrahymena thermophila group I intron (3) substantially eroded the myth that RNA is extremely difficult to crystallize. Since then, the growing catalog of RNA structures has begun to reveal motifs such as the ribose zipper, the dinucleotide-platform, kink-turns, tetraloops, and the A-minor triple that serve as the foundation for establishing complex tertiary architecture (1, 3–5). Biological non-coding RNAs and artificial aptamers are being discovered at an accelerating pace, and their potential applications in the fields of medicine and biotechnology is increasing the demand for high-resolution structures to fully understand their function. This prompts a need for new and improved methods for RNA purification and crystallization to facilitate its structure determination.
The widespread use of labor-intensive denaturing purification techniques and the lack of a universal tool for obtaining phase information are among the most difficult issues faced in RNA structural biology (6). Towards this end, a number of laboratories have developed techniques that address these problems and have generated strategies for engineering RNA that facilitate its crystallization. Choosing the correct set of approaches often determines the success of a crystallization effort. In this article, this process will be described with an emphasis on four steps specific for RNA (see Fig. 9.1): designing constructs for crystallization trials, RNA synthesis by T7 RNA polymerase using DNA templates generated by PCR, RNA purification under denaturing or native conditions, and initial screening for diffraction-quality crystals.
Fig. 9.1.
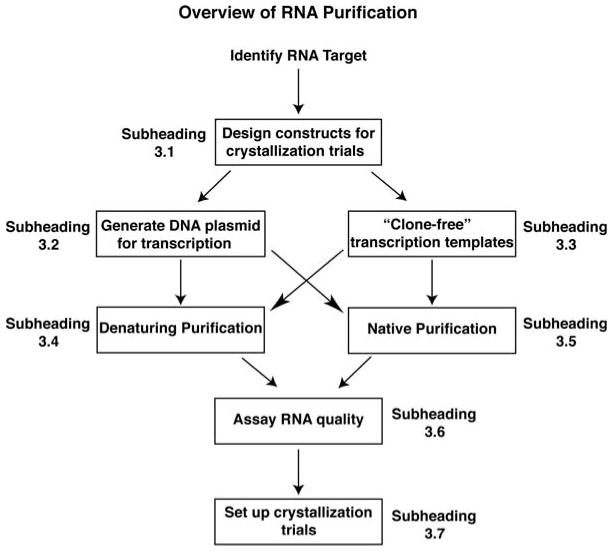
Flowchart of RNA synthesis, purification, and initial crystallization trials as described in this chapter. Within this scheme, alternative protocols are presented for the synthesis of transcription templates (Sections 3.2 and 3.3) and for the purification of RNA (Sections 3.4 and 3.5). The arrows denote how each section can be linked to the next step in the process.
2. Materials
2.1. Designing a Library of RNA Variants
Access to Rfam database (rfam.sanger.ac.uk).
Access to GeneDesign (slam.bs.jhmi.edu/gd/index.html).
2.2. Construction of Plasmid Vectors for the Expression of RNA
2.2.1. PCR Construction of a DNA Gene
Milli-Q (18 mΩ) water.
5 U/μL (working concentration) Taq DNA polymerase (New England Biolabs, Ipswich, MA).
10× Thermophilic DNA polymerase buffer: 200 mM Tris–HCl, pH 8.8, 100 mM KCl, 100 mM (NH4)2SO4, 20 mM MgSO4, 1% Triton X-100.
100 μM Stock concentration of DNA oligonucleotide primers (stored at −20°C).
10 mM dNTPs mixture (stored at −20°C).
Thermocycling PCR machine.
QIAquick PCR purification kit (QIAGEN, Valencia, CA).
Restriction enzymes: EcoRI, NcoI, and KpnI (New England Biolabs, Ipswich, MA).
Calf intestinal alkaline phosphatase (CIP), 0.2 U/μL (New England Biolabs).
Agarose gel electrophoresis equipment.
Shortwave ultraviolet (UV) illuminator.
QIAquick Gel Extraction Kit (QIAGEN).
1× TE buffer: 10 mM Tris–HCl, pH 8.0, 1 mM EDTA.
Ethidium bromide (10 mg/mL aqueous stock).
2.2.2. Cloning into the pRAV Plasmid Vectors
DNA vectors (pRAV12 or pRAV23, see Note 1).
T4 DNA ligase (Invitrogen, Carlsbad, CA).
10 mM ATP.
PCR thermocycler.
Luria broth (LB) agar plates containing ampicillin (50 μg/mL). Ampicillin stock solution is 50 mg/mL in 50% ethanol/50% water and stored at −20°C.
DH5α chemically competent E. coli cells (Stratagene, San Diego, CA).
Incubator at 37°C.
DNA Miniprep Kit (QIAGEN).
TE buffer: 10 mM Tris–HCl pH 8.0, 1 mM EDTA pH 8.0.
Sequencing primers: 10 μM stock concentration of M13 forward or reverse (New England Biolabs, Cat. # S1201 and S1212).
2.3. Clone-Free Generation of dsDNA Transcription Templates
Milli-Q (18 mΩ) water.
2.5 U/μL (stock concentration) Pfu DNA polymerase (Stratagene).
10× Thermophilic DNA polymerase buffer.
100 μM Stock concentration of DNA oligonucleotide primers (stored at −20°C).
10 mM dNTPs mixture (stored at −20°C).
Thermocycling PCR machine.
QIAquick PCR purification kit (QIAGEN).
2.4. Synthesis of RNA by In Vitro Transcription and Denaturing Purification
2.4.1. Large-Scale PCR Synthesis of Template
10× Thermophilic DNA polymerase buffer.
10 mM dNTP mixtures.
5 U/μL Working concentration of Taq DNA polymerase (New England Biolabs).
100 μM Stock concentration of DNA oligonucleotide primers.
Agarose gel electrophoresis equipment.
2.4.2. Preparation of rNTP Stocks
Ribonucleotide 5′-triphosphate disodium salt: ATP, CTP, GTP, and UTP (Sigma-Aldrich, St. Louis, MO).
Milli-Q water.
5 M NaOH.
pH-indicator strips.
2.4.3. Synthesis of RNA by T7 RNA Polymerase for Denaturing Purification
50 mL Disposable conical tube.
10× Transcription buffer: 400 mM Tris–HCl, pH 8.0, 100 mM DTT, 20 mM spermidine, 0.1% Triton X-100.
100 mM rNTP stocks (stored at −20°C and thawed immediately prior to application).
Inorganic pyrophosphatase (Sigma-Aldrich), lyophilized powder, suspended in storage buffer (20 mM KH2PO4 pH 7.0, 100 mM NaCl, 50% glycerol (v/v), 10 mM DTT, 0.1 mM EDTA pH 8.0, 0.2% (w/v) NaN3) to a stock concentration of 20 U/μL. This is to be stored at −20°C and kept on ice while adding the appropriate aliquot to the reaction mixture.
T7 RNA polymerase (New England Biolabs or a 0.25 mg/mL working concentration of home-made). This enzyme should be stored at −20°C and kept on ice while adding the appropriate aliquot to the reaction mixture.
Incubator at 37°C.
2.4.4. Denaturing Polyacrylamide Gel Electrophoretic Purification of RNA
100% Ethanol.
8 M Urea.
0.5 M Na2EDTA, pH 8.0.
40% Acrylamide/bisacrylamide solution (29:1).
10% Ammonium persulfate solution.
N,N,N',N'-tetramethylethylenediamine (TEMED).
5× TBE buffer: 0.5 M Tris base, 0.42 M boric acid, and 5 mM Na2EDTA.
Vertical polyacrylamide gel electrophoresis apparatus with 0.3 mm spacers.
Fluorescent thin layer chromatography plate (Sigma-Aldrich).
Shortwave ultraviolet (UV) lamp.
Electroelution apparatus (Elutrap) (Whatman, Florham Park, NJ).
10,000 molecular weight cutoff centrifugal concentrators (Millipore, Billerica, MA).
1× Exchange buffer: 10 mM Na-MES, pH 6.0, 2 mM MgCl2, and 0.1% NaN3 or a suitable alternative of choice.
2.5. Purification of RNA Using Native Ni-NTA Chromatography
2.5.1. Synthesis of RNA for Native Purification
10× HEPES Thermophilic DNA polymerase buffer: 200 mM Na-HEPES, pH 8.6, 100 mM KCl, 100 mM (NH4)2SO4, 20 mM MgSO4, 1% Triton X-100.
10 mM dNTP mixtures (stored at −20°C).
Taq DNA polymerase, 5 U/μL working concentration (New England Biolabs).
100 μM Stock concentration of DNA oligonucleotide primers (stored at −20°C).
Agarose gel electrophoresis equipment.
50 mL Disposable conical tube.
10× HEPES Transcription buffer: 400 mM Na-HEPES, pH 8.0, 100 mM DTT, 20 mM spermidine, 0.1% Triton X-100.
100 mM rNTP stocks.
Inorganic pyrophosphatase (Sigma-Aldrich).
T7 RNA polymerase (New England Biolabs or a ∼10 mg/mL stock concentration of home-made).
37°C Incubator or waterbath.
2.5.2. Preparation of HMM Tagging Protein
Chemically competent BL21(DE3) E. coli cells (Novagen, Madison, WI).
pHMM expression vector (see Note 1).
Luria broth (LB) agar plates containing kanamycin (30 μg/mL). Kanamycin stock solution is 30 mg/mL in water and stored at −20°C.
Isopropyl-thio-ß-galactopyranoside (IPTG), molecular biology grade (Sigma-Aldrich, St. Louis, MO). Prepare a working 1,000× stock of 1 M in ddH2O, filter sterilize, and store at −20°C.
E. coli protease inhibitor solution (#P8849, Sigma-Aldrich, St. Louis, MO)
Lysis buffer: 50 mM sodium phosphate, pH 8.0, 300 mM NaCl, 10% glycerol, 0.5% Tween-20, 10 mM imidazole.
Cell sonic disruptor.
Ni-NTA agarose (QIAGEN).
SP-Sepharose (GE Healthcare, Piscataway, NJ).
2.5.3. Ni-NTA Purification of RNA
Ni-NTA agarose (QIAGEN).
Econo-Pac 20 mL columns (BioRad, Hercules, CA).
RNA wash buffer: 50 mM K+-HEPES, pH 7.5, 150 mM NaCl, 10 mM MgCl2, 10 mM imidazole.
Glucosamine-6-phosphate (GlcN6P), 0.1 M working concentration in ddH2O (Sigma-Aldrich).
Stripping buffer: 50 mM K+-HEPES, pH 7.5, 150 mM NaCl, 10 mM MgCl2, 250 mM imidazole.
10,000 molecular weight cutoff centrifugal concentrators (Millipore).
2.6. Assaying RNA Quality
Vertical polyacrylamide gel electrophoresis apparatus with 1 mm spacers.
5× TBE buffer.
40% Acrylamide/bisacrylamide solution (29:1) stored at 4°C.
10% Ammonium persulfate solution stored at 4°C.
N,N,N',N'-tetramethylethylenediamine (TEMED) stored at 4°C.
Ethidium bromide solution (10 mg/mL in H2O).
Ultraviolet (UV) transilluminator box.
2.7. Crystallization of RNA
2.7.1. Screening of RNA for Crystallizability
24-well Linbro trays (Hampton Research, Aliso Viejo, CA).
Siliconized glass cover slips (Hampton Research).
Sparse Matrix screening kits (Hampton Research).
0.22 μm Cellulose acetate microcentrifuge tube filters (Corning Inc., Corning, NY)
Incubator at 30°C.
2.7.2. A Simple Synthesis of Iridium(III) Hexamine
Heavy-walled Ace pressure tube (35 mL volume) (Sigma-Aldrich).
Silicone oil bath.
Teflon tape.
Iridium (III) chloride (Sigma-Aldrich).
Ammonium hydroxide.
Rotary evaporator.
Concentrated hydrochloric acid.
Absolute (100%) ethanol.
3. Methods
3.1. Designing a Library of RNA Variants
Before undertaking a crystallization effort, it is highly advisable to devise a strategy for systematically surveying a number of RNA constructs containing the motif or activity of interest, as well as a means of obtaining phase information. It is now generally appreciated that small changes in an RNA, particularly in peripheral helices and terminal loops, have a significant effect on the formation of productive lattice contacts. Therefore, it is useful to identify nucleotide positions or regions in the RNA that are highly variable by sequence comparison of phylogenetic variants; this information is often available in a database such as Rfam (rfam.sanger.ac.uk) (7). These regions are often not required for function, and thus are prime candidates for sequence alteration. Combined with biochemical and genetic information, often one can be very confident that alterations to an RNA sequence will not be deleterious to its function or structure.
Systematic variation of the length and sequence composition of peripheral elements is the primary means of generating a library of constructs for crystallization trials. Each variant in the library is synthesized and purified, refolded if necessary, and subjected to several commercially available sparse matrix screens (see Section 3.7.1) at a single temperature (30°C) to assess whether it is inherently crystallizable. Only those individuals that yield crystals in a number of conditions within the initial survey are further examined for suitably diffracting crystals via further condition screening. In this fashion, our crystallization strategy focuses initially upon “construct space” with only those RNAs showing an inherent tendency to crystallize subjected to refinement in “condition space” (see Note 2). The following are two recent examples from our laboratory as to how we specifically approached this problem. Other examples in the literature can be found detailing how crystals were found for the U1A–RNA complex (8, 9), signal recognition particle (10), hammerhead ribozyme (11), hepatitis delta ribozyme (12), and the guanine riboswitch (13).
3.1.1. The SAM-I Riboswitch: A Case Study in Exploring Construct Space
The SAM-I riboswitch is an mRNA element that binds S-adenosylmethionine to regulate gene expression in a variety of bacteria (14, 15). In our strategy for this RNA, we decided to use a tactic often employed in protein crystallography – thermophilic variants (16). As riboswitches are found in thermophilic species (Thermotoga maritima and Thermus thermophilus, for example), we identified in Rfam a promising RNA that controlled the metF-H2 operon in Thermoanaerobacter tengcongensis (see Fig. 9.2A). Phylogenetic alignment of this RNA motif revealed several highly variable peripheral regions: the lengths of the P1, P3, and P4 helices and the composition of the terminal loops of P3 and P4.
Fig. 9.2.
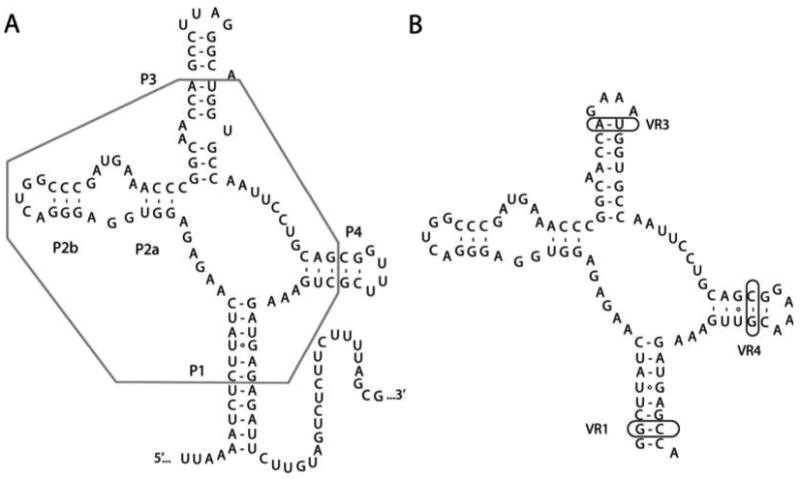
Conversion of the SAM-I riboswitch to a sequence that was successfully crystallized. (A) Raw sequence of the SAM-I riboswitch aptamer domain that controls the metF-H2 operon in T. tencongensis. The box encloses all sequence elements that are >90% conserved across phylogeny and implicated in ligand binding. (B) Sequence of the RNA that was crystallized complexed with S-adenosylmethionine. VR1, VR2, and VR3 denote the three regions of the P1, P3, and P4 helices that contained expansions to create a library of different variants of the SAM-I aptamer domain.
Based upon the available phylogenetic and biochemical data, we employed a directed engineering strategy involving two approaches. First, the terminal tetraloops in the natural sequence were changed to GAAA tetraloops (see Fig. 9.2B). The GAAA tetraloop has been observed in a large number of crystal structures to mediate formation of lattice contacts (10, 17), often via the use of A-minor triples (18, 19). Second, the lengths of the P1, P3, and P4 helices were systematically varied such that an array of RNAs was produced (13). Subsequent screening of these variants against three commercially available sparse matrices (Crystal Screen I, Natrix, and Nucleic Acid Mini Screen; Hampton Research) showed a strong trend towards the smaller SAM-I RNAs being more crystallizable. The 8/3/5 variant (eight base pairs in P1, three base pairs above a conserved internal loop in P3, and five base pairs in P4) yielded crystals in a large number of conditions in the initial survey, and with a little fine tuning of the mother liquor, crystals were reproducibly obtained that diffracted X-rays to 2.9 Å resolution (20).
3.1.2. The SAM-II Riboswitch: A Case Study in Exploring Phylogenetic Variants
The SAM-II riboswitch (21) presented a significant problem toward implementing the directed engineering strategy described above. The pseudoknot that forms the conserved functional core of this RNA (see Fig. 9.3) did not allow us to simply take one species variant and alter its peripheral elements. Instead, we initially screened phylogenetic variants in which the lengths of the P1 and P2 stems naturally differed (see Note 3). Using a published phylogenetic alignment of RNAs bearing the SAM-II sequence signature (see Fig. 9.3A), we targeted 13 variants for initial crystallization trials (21). From this series, two RNAs (6/2 and 7/6) yielded diffraction-quality crystals from initial screens. Characterization of each crystal revealed that the 7/6 variant crystallized in a P1 space group, making data collection and phasing more difficult. Therefore it was abandoned in favor of the 6/2 variant (see Fig. 9.3B) that yielded a more favorable C2 space group. After further engineering (see Fig. 9.3C, see Section 3.1.3), this RNA yielded a 2.8 Å structure (22).
Fig. 9.3.
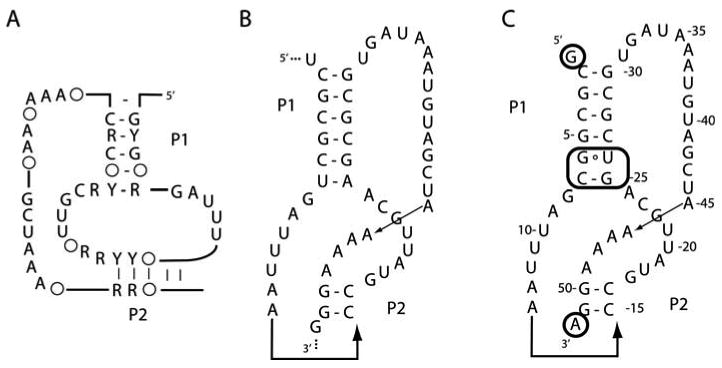
Conversion of the SAM-II riboswitch to a sequence that was successfully crystallized. (A) Phylogenetic conservation of the SAM-II aptamer domain; letters denote sequence elements that are >90% conserved (Y, pyrimidine; R, purine) and circles denote the presence of a base pair at that position in >90% of sequences. Adapted from (21) (B) Sequence and secondary structure of the SAM-II aptamer domain that controls the metX gene in a sequence from the Sargasso Sea metagenome. (C) Sequence of the RNA that was successfully crystallized. Circled nucleotides are sequences that were changed in order to facilitate synthesis (G at the 5′-end), processing by the H∂V ribozyme (A at the 3′-end), or phasing (pairs in the P1 helix).
3.1.3. The Phasing Module
It is never too early to think about how to solve the phase problem. For RNA, this is a significant issue because there is no generally accepted and simple means of creating a heavy-atom derivative as there is for proteins via bioincorporation of selenomethionine. Over the last decade, a number of approaches have been employed including the use of an RNA binding protein to provide selenium sites (12), incorporation of 5-bromouracil (23, 24) or 2′-selenoribose (25, 26), and standard “soak-and-pray” methods using multivalent cations (27). A more recent technique that we have pioneered is the use of a small sequence motif that can be placed into virtually any A-form helix based upon the observation that a single G•U wobble pair often has cations bound to its major groove face and does not significantly alter the helical geometry (28). A systematic survey of single G•U pairs with differing flanking sequences (Watson–Crick A–U or G–C pairs) reveals a striking trend: the nucleotide on the 5′-side of the G•U pair has a strong influence on the strength of a metal's interaction with the RNA. If a guanine or uracil occupies each of these two positions (see Fig. 9.4), the G•U pair has a very high likelihood of binding a hexammine ion or cesium ion with both high occupancy and low B-factor, making it a favorable derivative for phasing. This “phasing module” was placed into the P1 helix of the SAM-II 6/2 variant RNA (see Fig. 9.3C) to yield a cesium derivative that was used for phasing by the SIRAS (single isomorphous replacement with anomalous scattering) method.
Fig. 9.4.
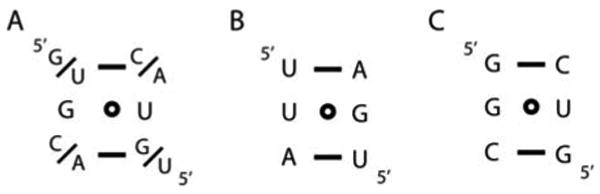
Sequence of the iridium(III) hexammine binding motif (the “phasing module”). (A) The consensus sequence of the module consisting of a single wobble G•U pair flanked by two Watson–Crick pairs. (B) The phasing module containing two A–U pairs. (C) The phasing module containing two G–C pairs.
3.2. Construction of Plasmid Vectors for the Expression of RNA
For each RNA in the library, the corresponding DNA sequence is created by PCR with overlapping DNA oligonucleotides and placed into one of two plasmid vectors. The choice of vector is based upon the purification approach, which in turn depends upon the RNA being studied. In general, the majority of small RNA species (<50 nucleotides in length) can be folded into an active conformation following denaturation. Thus, a purification scheme involving classical denaturing gel electrophoresis is the most straightforward method. For this approach, we clone into the pRAV12 vector (see Note 1) (6), placing the RNA of interest upstream of the H∂V ribozyme for processing of the 3′-end (29).
Larger RNAs, on the other hand, are susceptible to kinetic folding traps, presenting the researcher with the dilemma of testing a number of refolding protocols before a homogeneously folded and active RNA population is achieved. In this case, a native purification scheme may be the best route. Therefore, we clone into the pRAV23 vector (see Note 1) containing a glmS ribozyme/MS2 coat protein affinity tag for Ni-NTA chromatography (30). In our experience, assaying different phylogenetic variants of the RNA of interest by native gel electrophoresis (see Section 3.6.2) allows us to assess the ability of each RNA to refold and thus make an informed decision about the purification strategy. As these types of initial decisions about the experimental strategy are often crucial to success, it is advisable to try a number of approaches proven to generate diffraction-quality crystals of RNA and its complexes with small molecules and proteins.
Once sequences and a purification strategy have been chosen, it is a relatively straightforward process to convert the sequence into a series of DNA primers to construct a transcription template. For example, to clone the SAM-I RNA (see Figs. 9.2B and 9.5A) into pRAV12, an EcoR1 site and the T7 promoter sequence is added upstream of the desired RNA sequence and a H∂V/NcoI site on the 3′ side (see Fig. 9.5B). This sequence is then input into the GeneDesign website (slam.bs.jhmi.edu/gd/index.html, “oligo design” component) which breaks it up into a series of overlapping DNA oligonucleotides of approximately the same length (see Fig. 9.5C). These are output as a set of oligonucleotides (see Fig. 9.5D) to be synthesized for use as inner primers in a PCR reaction that will reconstruct the intact double-stranded DNA template (see Section 3.2.1).
Fig. 9.5.

Conversion of an RNA sequence into a DNA sequence suitable for cloning into the pRAV12 expression vector. (A) Sequence of the RNA used to crystallize the SAM-I riboswitch in complex with S-adenosylmethionine. (B) DNA sequence encoding this RNA (third block of letters) with the addition at the 5′-end of an EcoRI restriction site (bold, block 1) and T7 RNA polymerase promoter (block 2) and the H∂V ribozyme/NcoI restriction sequence at the 3′-end (block 4). (C) Output from the GeneDesign website, in which the sequence of (B) was input with target primer length of 60 nucleotides, 18 base pair overlap, and 56°C overlap melting temperature. (D) The four DNA oligonucleotides that would be synthesized for use in a PCR reaction to create the full length DNA insert.
3.2.1. PCR Construction of a DNA Gene
The PCR amplification reaction is assembled as follows: 10 μL of 10× Taq DNA polymerase buffer, 2 μL dNTP solution (10 mM each dNTP), 2 μL of a 100 nM solution of each inner DNA oligonucleotide (see Note 4), 1 μL 100 μM 5′-GEN outer primer (see Table 9.1), 1 μL 100 μM outer primer 3′-H∂V (see Table 9.1), 1 μL Taq DNA polymerase, and 82 μL of ddH2O (100 μL total volume).
The reaction is amplified in a PCR machine with the program: initial melt for 1 min at 95°C; 30 cycles of 94°C for 30 s, 50°C for 30 s, and 72°C for 60 s; 5 min final extension at 72°C; hold at 4°C.
The PCR amplification product is purified using the QIAquick PCR Purification Kit (QIAGEN) according to the manufacturer's instructions and recovered in 50 μL of TE buffer (or ddH2O, which works equally well).
Restriction digestion of the purified PCR product is performed by adding the following constituents to the 50 μL of purified DNA from the previous step: 6 μL of the appropriate 10× restriction buffer provided from New England Biolabs, 1 μL of EcoR1, and 1 μL of either NcoI (pRAV12) or KpnI (pRAV23) and incubating at 37°C for 1 h. 20 μg of Plasmid vector is also digested using the same reaction except that 1 μL of calf intestinal alkaline phosphatase (CIAP) is added to the reaction to reduce ligation background.
The product is purified using a 2% (PCR inserts) or 0.5% (plasmid) agarose gel in TAE buffer. The correct band is visualized by staining with ethidium bromide (1:1,000 dilution of 10 mg/mL stock), illuminated by short-wave UV, and rapidly excised from the gel with a clean razor blade.
The DNA fragment is removed from the gel matrix and purified using the QIAquick Gel Extraction Kit (QIAGEN) according to manufacturer's instructions and recovered in 50 μL of TE buffer.
Table 9.1. General DNA primers for use with pRAV12 and −23 vector systems.
| Name | Sequence |
|---|---|
| 5′-GEN | 5′-GCGCGCGAATTCTAATACGACTCACTATAG |
| 5′ H∂V | 5′-GCCGGCCATGGTCCCAGCCTCCTCG |
| 5′ glmS | 5′-GCGCCCGAACACCGGTACC |
| 3′-glmS | 5′-TACCGGTACCGGTAGTTCGGGCGCT |
| 3′-GEN12 | 5′-AGAGGTCCCATTCGCCATGCCGAAGCATGTTG |
| 3′-MS2 | 5′-CAGACCCTGATGGTGTCTGAA |
| 3′-H∂V | 5′-CTGGGACCATGGCCGGC |
3.2.2. Cloning into the pRAV Plasmid Vectors
Ligation of the PCR insert into the DNA vector is performed in the following reaction: 4 μL 5× ligase buffer, 2 μL 10 mM ATP, 1 μL 0.1 μg/μL vector, 1 μL 1:5 dilution of PCR insert, and 1 μL T4 DNA ligase (see Note 5). Incubate the reaction at 16°C for 2 h or overnight (16 h).
Transform 2 μL into a standard E. coli strain used for plasmid propagation (DH5α or XL-10) and plate on LB-agar plates containing 50 μg/mL ampicillin for resistance selection.
Pick individual colonies and inoculate 5 mL LB broth supplemented with 50 μg/mL ampicillin. Use a DNA miniprep kit (QIAGEN) to purify plasmid DNA.
Verify the sequence of the resulting plasmid using the M13 reverse sequencing primer. While the M13 forward primer also works, artifacts may arise from sequencing in this direction because the RNA structure is reflected in the DNA being sequenced.
3.3. Clone-Free Generation of dsDNA Transcription Templates
In the initial stages of high-throughput screening of RNA constructs, the rate-limiting factor is often the cloning process. While cloning provides a reliable and sequence-verified DNA template, during initial screening stages we prefer to circumvent this step in favor of rapidly identifying crystallizable constructs. This system allows the use of simple PCR protocols to generate a sequence of interest conjugated to the 3′ processing ribozyme of choice (see Fig. 9.6).
Fig. 9.6.
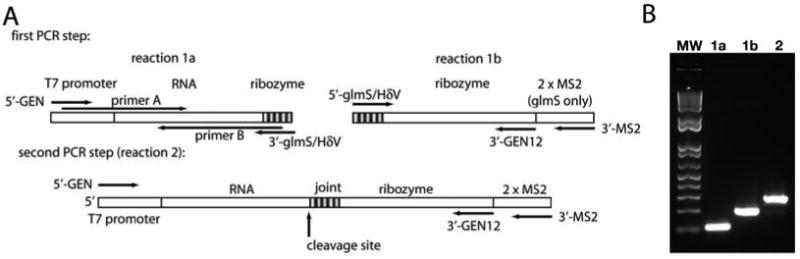
Recombinant PCR as a means of generating a DNA fragment for use as a transcription template without the need for cloning. (A) Schematic of the PCR reactions needed to generate a full length fragment for transcription. Reactions 1a, 1b, and 1c are analogous to the reactions outlined in Sections 3.3.1, 3.3.2, and 3.3.3, respectively. (B) Ethidium bromide stained gel showing fragments generated in Step 1 (lane a, b) and Step 2 (lane c) of the scheme.
It should be noted that cloning is still recommended based on aforementioned criteria, particularly once promising leads have been identified.
3.3.1. Design of Primers and PCR Synthesis of RNA of Interest
Design a set of DNA oligonucleotides that contain the RNA gene of interest with the sequence of the 5′-GEN outer primer (see Table 9.1) appended to the 5′ end and the sequence of the 3′ ribozyme of choice at the 3′-end (3′-H∂V or 3′-glmS, see Table 9.1).
Amplify the RNA of interest using primers described above in the following reaction: 10 μL 10× Thermophilic DNA polymerase buffer, 2 μL 10 mM dNTPs mix, 1 μL of 100 μM 5′ outer primer, 1 μL of 100 μM 3′ outer primer, 1 μL of inner DNA primer mix (see Fig. 9.6A, “reaction 1a” this corresponds to the inner primers A and B; see Note 4), 1 μL Pfu polymerase (see Note 6) and 84 μL ddH2O.
Amplify in a PCR thermocycler using the following protocol: initial melt for 1 min at 95°C; 30 cycles of 94°C for 30 s, 50°C for 30 s, and 72°C for 60 s; 5 min final extension at 72°C; hold at 4°C.
Load the entire 100 μL PCR reaction aliquot in large wells of a 2% electrophoresis grade agarose gel containing 1 μg/mL ethidium bromide and run at 100 V for 45 min. Visualize the band using a short-wave UV lamp, and cut out the band corresponding to the expected size.
Extract DNA for gel slice with the QIAquick gel extraction kit using the protocol provided by the manufacturer.
Make a 1:100 dilution of this stock into TE buffer. This dilution will be used in the subsequent recombination reaction (see Section 3.3.4).
3.3.2. PCR Synthesis of H • V Ribozyme (Denaturing Purification Protocol)
Set up a PCR reaction with the following components: 10 μL 10× Thermophilic DNA polymerase buffer, 2 μL 10 mM dNTPs mix, 1 μL of 100 μM 5′-H∂V primer (see Table 9.1), 1 μL of 100 μM 3′-GEN12 primer (see Table 9.1), 1 μL pRAV12 vector, 1 μL Pfu enzyme (see Note 6) and 84 μL ddH2O (see Fig. 9.6A, “reaction 1b”).
Follow Steps 3–5 outlined in Section 3.3.1.
3.3.3. PCR Synthesis of glmS Ribozyme (Native Purification Protocol)
Set up a PCR reaction with the following components: 10 μL 10× Thermophilic DNA polymerase buffer, 2 μL 10 mM dNTPs mix, 1 μL of 100 μM 5′-glmS primer (see Table 9.1), 1 μL of 100 μM 3′-MS2 primer (see Table 9.1), 1 μL pRAV23 vector, 1 μL Pfu polymerase (see Note 6) and 84 μL ddH2O (see Fig. 9.6A, “reaction 1b”).
Follow Steps 3–5 outlined in Section 3.3.1.
3.3.4. Recombination Reaction
Set up following PCR reaction: 10 μL of 10× Thermophilic DNA polymerase buffer, 2 μL 10 mM dNTPs mix, 1 μL of 100 μM 5′-GEN, 1 μL of 100 μM 3′-GEN12 or 3′-MS2 (depending on the ribozyme choice), 1 μL of a 1:100 dilution of your RNA gene (from Section 3.3.1), 1 μL of 1:100 dilution of ribozyme DNA piece (from Section 3.3.2 or 3.3.3), 1 μL Pfu enzyme and 84 μL ddH2O (see Fig. 9.6A, “reaction 2”).
Follow Steps 2 and 3 from Section 3.3.1. Note that an apparent shift in the overall length of the product by about 90 or 200 base pairs, as judged by a 2% agarose gel, indicates successful conjugation of the H∂V or glmS ribozymes, respectively (see Fig. 9.6B).
Gel purify the product according to Step 4 in Section 3.3.1. This will then serve as the template for large-scale PCR reactions to generate template for RNA synthesis by T7 in vitro transcription.
3.4. Synthesis of RNA by In Vitro Transcription and Denaturing Purification
3.4.1. Large-Scale PCR Synthesis of Template
Assemble in a 1.5 mL Eppendorf tube the following 1 mL reaction: 847 μL ddH2O, 100 μL 10× Thermophilic DNA polymerase buffer, 10 μL of 100 μM 5′-GEN (see Table 9.1), 10 μL of 100 μM 3′-GEN12 (see Table 9.1), 20 μL 10 mM mixture of dNTPs, 3 μL of template plasmid (see Section 3.2) or product from clone-free PCR reaction (see Section 3.3) and 10 μL of Taq DNA polymerase (5 U/μL).
After vortexing the reaction to mix it thoroughly, make eight 125 μL aliquots into 200 μL thin-walled PCR tubes.
Amplify the target gene in a PCR thermocycler using the following protocol: initial melt for 1 min at 95°C; 30 cycles of 94°C for 30 s, 50°C for 30 s, and 72°C for 30 s; 5 min final extension at 72°C; hold at 4°C.
Pool the eight 125 μL reaction aliquots into a single tube. Assay 5 μL on a 2% agarose gel next to an appropriate size marker (1 Kb Plus DNA ladder, Invitrogen) to ensure strong amplification has occurred.
Freeze DNA solution at −20°C until use for transcription. No other purification of the reaction is necessary as residual dNTPs, Taq polymerase, and primers do not interfere with RNA synthesis by T7 RNA polymerase.
3.4.2. Preparation of rNTP Stocks
For large-scale RNA synthesis, the most economical option for obtaining ribonucleotide 5′-triphosphate precursors is to purchase dry powder from Sigma or a comparable supplier and dissolve each in a sufficient amount of ddH2O to yield a 100 mM working stock. Most importantly, the solution's pH must be adjusted such that it is approximately 7.5. The amount of sodium hydroxide needed to adjust the pH will differ depending upon manufacturer of the rNTPs, so it is prudent to add the base slowly and monitor the pH by spotting 1–2 μL on pH strips. Thus, the recipes below will likely need to be slightly modified. All of the working stocks are stored in 1 mL aliquots at −20°C and thawed immediately prior to application.
1 g of ATP (Sigma, A3377) is dissolved in ddH2O to a final volume of 10 mL. Then the pH is adjusted to 7.5 by adding 580 μL 5 N NaOH and adjusting the final volume to 16 mL with ddH2O to yield a working stock of 100 mM.
1 g of CTP (Sigma, C1506) is dissolved in ddH2O to a final volume of 10 mL. Then the pH is adjusted to 7.5 by adding 600 μL 5 N NaOH and adjusting the final volume to 17.1 mL with ddH2O to yield a working stock of 100 mM.
1 g of GTP (Sigma, G8877) dissolved in ddH2O to a final volume of 10 mL. Then the pH is adjusted to 7.5 by adding 310 μL 5 N NaOH and adjusting the final volume to 16.5 mL with ddH2O to yield a working stock of 100 mM.
1 g of UTP (Sigma, U6570) dissolved in ddH2O to a final volume of 10 mL ddH2O. Then the pH is adjusted to 7.5 by adding 270 μL 5 N NaOH and adjusting the final volume to 17 mL with ddH2O to yield a working stock of 100 mM.
3.4.3. Preparation of T7 RNA Polymerase
Synthesis of crystallographic quantities (5–20 mg) of RNA requires a substantial amount of T7 RNA polymerase, such that it is impractical to buy it from a commercial source. Most laboratories studying RNA structure over-express and purify their own polymerase using one of several published protocols (31–33). Our laboratory uses the expression vector pT7-911Q transformed into BL21 E. coli cells and purified using a single immobilized nickel ion affinity column (34). The protein obtained from this procedure is stored in a buffer containing 20 mM potassium phosphate, pH 7.5, 100 mM NaCl, 10 mM DTT, 0.1 mM Na2EDTA, 0.2% NaN3, and 50% glycerol at a stock concentration of ∼10 mg/mL.
3.4.4. Synthesis of RNA by T7 RNA Polymerase for Denaturing Purification
Assemble in a disposable 50 mL conical tube the following 12.5 mL reaction: 7.25 mL of ddH2O, 1.25 mL 10× transcription buffer, 300 μL 1 MgCl2, 100 μL 1 M DTT, 500 μL 100 mM ATP, 500 μL 100 mM CTP, 500 μL 100 mM GTP, 500 μL 100 mM UTP, 1 mL PCR reaction containing the appropriate template, 100 μL inorganic pyrophosphate (20 U/μL), 250 μL of 10 mg/mL T7 RNA polymerase. Vortex the reaction to ensure complete mixing.
Incubate the reaction for 1–2 h at 37°C. While further reaction may result in minor increases in overall yield, the reaction is generally complete after 1 h and additional synthesis tends to initiate with 2 or 3 nucleotide abortive products, yielding 5′-end heterogeneity (35).
3.4.5. Denaturing Polyacrylamide Gel Electrophoretic Purification of RNA
Add 37.5 mL of −20°C ethanol to the 12.5 mL transcription reaction and incubate for at least 1–2 h at −20°C (incubation overnight is also permissible).
Centrifuge the reaction for 30 min at 4°C and 4,000g to collect the precipitate. Decant off the supernatant and dry the pellet under a vacuum for 10–15 min.
Suspend the pellet in 2 mL of 8 M urea, 500 μL 0.5 M EDTA pH 8.0, and 1 mL of formamide load dye. Vortex vigorously to resuspend all of the precipitate and heat to 65°C for 5 min to ensure a complete denaturation of the RNA.
Apply solution to a denaturing polyacrylamide gel (8–15% 29:1 acrylamide/bisacrylamide, 1× TBE buffer, 8 M urea). The dimensions of the gel we typically use are 35 cm wide, 23 cm long and 3 mm thick. The gel is electrophoresed in 1× TBE with constant power at 30 W until the desired RNA has migrated approximately 80% down the gel. The amount of time required for this step will depend on the size of the RNA. An analytical denaturing gel (described in Section 3.6.1) can be run prior to purification in order to gauge the extent of RNA migration relative to load dye migration.
Remove the spacers and the top plate from the gel. Then transfer the gel to a piece of plastic wrap. Gently, remove the other glass plate and place another piece of plastic wrap over the other side. In a dark room, place the gel on a fluorescent TLC plate and shadow the RNA with a short-wave UV lamp.
Working quickly to minimize UV-induced damage, outline the appropriate band on the plastic wrap with a marker.
Remove the other piece of plastic wrap and excise the band using a clean razor blade. Cut gel into equal sized pieces.
Place the gel slices into an electroeluter cell (three pieces side-by-side until the elutrap is full) and elute into 1× TBE at 100 V, constant voltage, at 4°C overnight. The elution of RNA from the gel slices can be monitored by removing them and shadowing them in a dark room using a short-wave UV lamp; they will be clear when the RNA is completely gone from the gel. An alternative protocol for extracting RNA out of a polyacrylamide gel is the “crush and soak” method as described by Golden (36).
Remove the buffer from the trap and place in a 15 mL 10,000 molecular weight cutoff centrifugal concentrator. Centrifuge the sample at 4,000g for 20 min at 4°C in order to concentrate the sample.
Add 15 mL of an appropriate exchange buffer (such as 10 mM K-HEPES, pH 7.5 or 10 mM Na-MES, pH 6.0). Centrifuge for 20 min at 4°C and 4,000g.
Repeat Step 10 twice more.
After the final round of buffer exchange, concentrate the RNA to approximately 200 μL.
Calculate the concentration of the RNA by measuring the absorbance of an appropriately diluted RNA sample (1:1,000) at a wavelength of 260 nm. The extinction coefficient of the RNA can be calculated by summing the individual extinction coefficients for each nucleotide in the RNA.
Store the RNA at −20°C until use.
3.5. Purification of RNA Using Native Ni-NTA Chromatography
This method describes a means of native purification using an affinity-immobilization column, requiring the glmS-MS2 coat 3′-tag on the RNA of interest (30). Another means to accomplish an entirely native purification of RNA on the milligram scale has been developed by Puglisi and coworkers that involves the use of size exclusion chromatography (37). Each of these techniques has certain advantages that will influence their adoption for a specific RNA.
3.5.1. Synthesis of RNA for Native Purification
Amplify DNA template using the same protocol outlined in Section 3.4.1. However, the 10× Thermophilic DNA polymerase PCR buffer must be replaced by 10× HEPES Thermophilic DNA polymerase buffer (see Note 7).
Synthesis of RNA is performed according to the protocol of Section 3.4.4. However, 10× Transcription buffer is replaced by 10× HEPES Transcription buffer (see Note 7).
3.5.2. Preparation of HMM Tagging Protein
Transform pHMM expression vector into chemically competent BL21(DE3) cells and plate on LB-Agar supplemented with 30 μg/mL kanamycin. Incubate overnight at 37°C.
Grow a 50 mL of starter culture (10 aliquots of 5 mL culture) in LB supplemented with 30 μg/mL kanamycin at 37°C and 220 rpm until the OD600 reaches saturation.
Inoculate 1 L of LB broth containing 30 μg/mL kanamycin with 10 mL of starter culture and incubate at 37°C and 220 rpm while monitoring turbidity at OD600.
When the OD600 reaches ∼0.6, add IPTG to a final concentration of 0.5 mM. Continue incubation at 37°C and 220 rpm for 4 h.
Pellet cells by centrifugation at 4°C and 6,000g for 10 min. Suspend cell pellet in Lysis Buffer (37.5 mL of buffer per liter of cell culture). The cell suspension can be stored at −80°C until further use.
Into a 600 mL stainless steel beaker, combine cell suspension aliquots to a total of 75 mL and add 500 μL of E. coli protease inhibitor solution.
Lyse the cells on ice with sonication for a total of 5 min (15 s bursts with a 45 s rest between pulses) at 75% total power.
Centrifuge the cell lysate at 30,000g at 4°C for 20 min. Immediately remove the supernatant and discard the pellet.
Apply the supernatant to a clean column containing a 10 mL bed volume of Ni-NTA agarose equilibrated in Lysis Buffer. Collect the flow-through in a single fraction.
Wash column with 20 column volumes of Lysis Buffer containing 20 mM imidazole.
Elute the protein with Lysis Buffer supplemented with 250 mM imidazole. Collect 10 mL fractions; the majority of the protein usually elutes in fractions 2 and 3. The concentration of protein can be obtained by measuring the A280 (the extinction coefficient for HMM protein is 83,310 M−1cm−1 and has a molecular weight of 59,050 g/mol).
Dialyze the protein solution exhaustively against three 1 L exchanges of a buffer containing 10 mM Na-MES, pH 6.0 and 10 mM NaCl at 4°C.
Apply protein to a Sepharose-SP column, and wash with ten column volumes of 10 mM Na-MES, pH 6.0 or until the absorption of the eluate returns to baseline, as monitored by the A280. Elute the protein using a NaCl concentration gradient from 0 to 1 M in 10 mM Na-MES, pH 6.0.
Pool fractions containing protein and dialyze into Storage Buffer overnight at 4°C.
Determine the final protein concentration by measuring the A280 and store the solution at −20°C until needed.
3.5.3. Ni-NTA Purification of RNA
Add 20 mg of HMM protein directly to the transcription reaction (see Section 3.5.1) and incubate the reaction at 37°C for 15 min to allow the protein to bind to full length RNA transcript.
Apply the reaction to a 5 mL bed volume of Ni-NTA agarose in a disposable 20 mL gravity flow column and collect the flow-through fraction.
Wash the column three times with 15 mL of ice-cold RNA Wash Buffer.
Initiate cleavage of the glmS ribozyme by adding 10 mL of room temperature RNA Wash Buffer supplemented with 1 μM glucosamine-6-phosphate (Gln6P) and collect this fraction.
Close the column at the bottom and apply 500 μL of RNA Wash Buffer to the top of the column in order to prevent the resin from drying, and allow the column to sit at room temperature for 15 min to allow the ribozyme to fully cleave.
Apply a second 10 mL aliquot of room temperature RNA elution buffer and collect the elution fraction.
Remove the bound protein using Stripping buffer. The recovered protein can be saved and purified again using the protocol described in Section 3.5.2.
Pool elution fractions containing RNA (to ensure fractions contain RNA check the absorption at 260 nm). Add these fractions to a 10,000 molecular weight cutoff centrifugal concentrator.
Concentrate the RNA sample by centrifugation at 4,000g and 4°C for 20 min.
Add 15 mL of an appropriate exchange buffer such as 10 mM K-HEPES, pH 7.5 or 10 mM Na-MES, pH 6.0. Centrifuge for 20 min at 4,000g and 4°C.
Repeat Step 10 twice more.
After the final exchange, the RNA should be recovered in 200 μL volume.
Determine the concentration of the RNA by measuring the absorption at 260 nm in the fashion described in Section 3.4.5.
Store the RNA sample at −20°C. Alternatively, to avoid potential aggregation of the RNA upon freezing, it can be stored at 4°C if the RNA is to be used within 1 week.
3.6. Assaying RNA Quality
The simplest method for assaying overall RNA quality is to examine the homogeneity of the sample preparation by running denaturing and native polyacrylamide gels followed by staining with ethidium bromide or SYBR Green (Invitrogen). The denaturing gel reveals whether the purification was successful and if any significant RNA degradation occurred. A native gel is used to assess whether the RNA species is folded uniformly, multimerizing, or aggregating allowing the researcher to optimize a folding protocol. The gels are typically 6–12% acrylamide (29:1 acrylamide/bisacrylamide), depending on the RNA size and desired resolution (see Fig. 9.7). The analytical gel dimensions are 16.0 cm high, 20.0 cm wide, and 2.0 cm thick; this size of gel is run at 15 W, constant power.
Fig. 9.7.
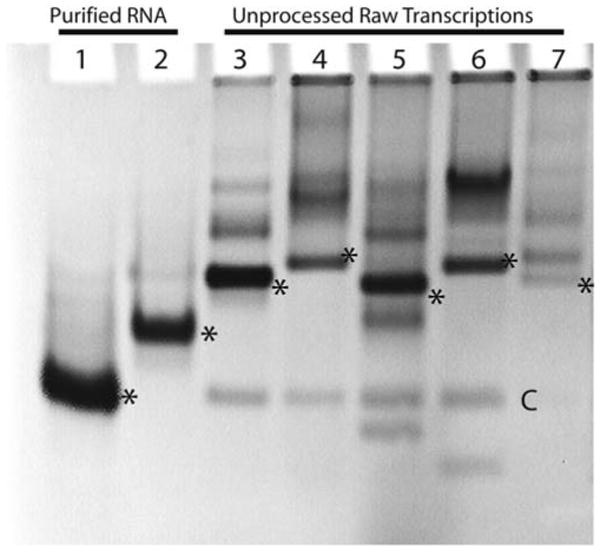
Assessing RNA quality using an 8% native polyacrylamide gel electrophoresis as described in Section 3.6.1 to identify well-folded phylogenetic variants of an RNA currently under investigation. Asterisks denote natively folded species and “C” highlights the 3′-H∂V tag that cleaved off during transcription (all of the RNAs were cloned into pRAV12). Lanes 1 and 2 are the adenine and SAM-I riboswitches, respectively, purified using denaturing gel electrophoresis and refolded. Lanes 3–7 represent samples from small scale (100 μL) trial transcriptions of lysine riboswitch variants from Bacillus subtilis, Escherichia coli, Haemophilus influenzae, Shigella flexneri, and Thermotoga maritima, respectively. The B. subtilis and H. influenzae appear to be mostly monomeric, suggesting that these may provide better starting points in the pursuit of diffraction-quality crystals. Also the relative intensities of the banding patterns suggest that the efficiency of transcription can be effected by the starting template as observed with T. maritima. Unlabeled bands above the monomer are likely multimeric, aggregate, or uncleaved species.
3.6.1. Analytical Polyacrylamide Gel Electrophoresis Under Denaturing Conditions
Remove the purified RNA sample from storage at −20°C and allow it to thaw at room temperature.
Mix 5 μL of RNA sample with 5 μL of formamide load dye, and load the RNA sample onto a denaturing acrylamide gel (6–12% (29:1) acrylamide/bisacrylamide, 8 M urea, 1× TBE buffer).
Run the gel at 15 W, constant power until the desired resolution is achieved.
Remove the spacers and gel from the plates. Place the gel in a bath of 1× TBE containing 1 μg/mL of ethidium bromide. Alternatively, SYBR Green may be used as per the manufacturer's instructions.
Visualize and assay the RNA quality by exposing the gel to short-wave UV light.
If there appears to be a significant number of extra bands on the gel, then it is recommended to repeat the purification procedure (see Note 8), as this RNA may not be suitable for crystallization trials (see Section 3.7.1).
3.6.2. Analytical Polyacrylamide Gel Electrophoresis Under Native Conditions
Prior to using the purified RNA sample for structural or biochemical studies, it is useful to assay the overall folded state of the sample preparation. This is especially important if the RNA of interest was purified under denaturing conditions. For small RNA species (<50 nucleotides in length) a heating step at 90°C for 3 min followed by cooling for 5 min on slushy ice is usually sufficient to refold the sample. Keep in mind that each RNA species is unique. Therefore, one folding protocol will not necessarily translate well from one RNA species to the next, even for very closely related RNAs in sequence.
Fold the purified RNA by starting with the simplest folding protocol and working your way toward more difficult strategies.
Mix 1 μL of folded RNA with 5 μL of type III load dye (30% (w/v) glycerol in H2O, 0.05% xylene cyanol and 0.05% bromophenol blue) and load the sample onto the gel.
Run the native gel using a native gel running buffer (0.5× TBE, 2 mM MgCl2) at 7 W of constant power (the gel should remain cool to the touch during electrophoresis) until the desired resolution is achieved.
Visualize and assay the RNA quality as described in Steps 4 and 5 of Section 3.4.1.
3.7. Crystallization of RNA
3.7.1. Screening of RNA for Crystallizability
The most important aspect of crystallography at this stage is to adopt techniques that are capable of yielding crystals in a reproducible fashion. An excellent resource that describes in detail many techniques pertaining to screening macromolecules for crystallization can be found in the Hampton Research Catalog (www.hamptonresearch.com). What follows is a brief overview of the initial screening step. Commercial screens including Natrix, Crystal Screen 1, Nucleic Acids Mini Screen and PEG-Ion (Hampton Research) are typically employed in early trials to identify good crystallization conditions. Further trials can be attempted using variation of drop size, screening temperature, and the evaporation time allowed before inversion of drops in order to identify suitable techniques. Initial conditions that yield crystals as identified from sparse matrix screening are then used as a starting point to optimize crystal growth (38).
Add 500 μL of each crystallization solution from a sparse matrix screen to individual well in a Linbro tray (Hampton). Line the well edges with petroleum jelly to act as a seal when the glass cover slip is applied. Incubate the trays at room temperature for 30 min to allow the crystallization solutions to come to room temperature.
Remove an aliquot of RNA sample and pass through a 0.22 μm centrifugal filter to remove particulate matter that may interfere with the crystallization process. At this point, for our riboswitch RNAs, we add sufficient ligand to the solution to yield a 2:1 molar ratio of ligand/RNA.
Incubate the ligand/RNA complex at room temperature for 30 min.
Using a clean pressurized air source, blow off any particulate matter from individual cover slips and place them along the edge of the lid of the Linbro tray.
Pipette 2.0 μL RNA sample onto the center of a cover slip and add an equal volume of the mother liquor (well buffer). Invert the cover slip over the source well and press down lightly until the petroleum forms an air-tight seal.
Repeat Step 5 until tray is complete.
Incubate the tray for 3–4 days at 30°C (our preferred temperature, but room temperature can suffice as long as there is not significant temperature fluctuations).
Examine drops under a stereomicroscope to determine if each drop remains clear, contains precipitate, or some form of crystalline material. RNA constructs that show crystallization (microcrystalline precipitate through discrete single crystals) under a number of conditions (usually >5% of conditions tested) become the focus of further screening and refinement of crystallization conditions.
3.7.2. A Simple Synthesis of Iridium(III) Hexammine
One of the primary reagents used for phase determination is iridium hexammine, a compound that is not commercially available. Nonetheless, its synthesis is very easy to accomplish using the following protocol to yield sufficient material for heavy-atom soaks or co-crystallization.
In a heavy-walled Ace pressure tube (Aldrich), add 2 g of iridium chloride (IrCl3) and 35 mL (fill tube) of ammonium hydroxide. Seal the tube well with teflon tape, particularly around the O-ring seal. Screw the top on tightly and place it halfway into a silicone oil bath that is set at 150°C. Incubate for 4 days. (If volume decreases, remove, cool down, and refill with fresh ammonium hydroxide, but this means that the seal is leaking and you need to reseal with teflon tape).
Solution should be light-brown and clear with most of the solid dissolved at the end of the reaction period. Allow it to completely cool and then incubate it in an ice-water bath.
Pass solution through a sintered-glass filter to remove solid material.
In a 50°C waterbath, use a rotovap in order to distill the solution to dryness.
Suspend solid in 5 mL of water. Solid material will not completely go into solution; do not worry about this.
Remove two 500 μL aliquots and place each in a separate Eppendorf tube. Add 200 μL conc. HCl to each tube; a significant amount of white precipitate should come out of solution. Spin down for 1 min at 10,000g at room temperature.
Remove supernatant (usually light yellow) and wash pellet with a 1 mL solution of 2:1 (v/v) water/conc. HCl by vortexing. Centrifuge for 1 min at 10,000g at room temperature and remove supernatant.
Repeat Step 7 twice more.
Wash pellet three times with 10 mL of ice-cold absolute ethanol.
Air dry for 1 h and resuspend in ddH2O in order to bring most of the white solid into solution. Spin down insoluble material and transfer supernatant to fresh Eppendorf tubes.
Take an absorbance spectrum of the material. There should be a clear peak at 251 nm. Calculate the concentration of iridium(III) hexammine using the extinction coefficient of 92 M−1cm−1.
Store solution at −20°C.
Acknowledgments
The contents of this work comprise much of the collected wisdom of a number of colleagues and members of the Batey laboratory. In particular, we would like to thank Jeffrey Kieft of the C.U. Health Sciences Center who has been instrumental in developing many of the ideas presented in this article. This work was made possible by a Research Scholar Grant from the American Cancer Society and support from the National Institutes of Health to R.T.B.
Footnotes
These plasmids are available from the laboratory of the authors upon request.
This approach is based upon the idea that a macromolecule's ability to crystallize is primarily determined by inherent properties such as the shape, the presence of functional groups on the molecule's surface, and conformational homogeneity in the sample. In this sense, the solution conditions and temperature act secondarily to promote a controlled precipitation event. Thus, we refer to “construct space” as the range of RNA sequences that contain a particular motif of interest that can be tested for crystallization and “condition space” as the range of solution conditions (mother liquors) that can be tested.
The 13 sequences used in an initial screen for an RNA sequence that was crystallizable was: Env17 (5/2), Env15 (5/3), Bth (5/4), Env01 (5/5), Env12 (6/2), Bja3 (6/3), Mma2 (6/4), Atu2 (6/5), Rpa2 (6/6), Env49 (7/2), Env03 (7/6), Env13 (8/2), and Env24 (8/5) (21). The numbers in parentheses refer to the length of the P1 and P2 helices in the pseudoknot, respectively. These sequences were chosen to maximize the diversity of the size of the pseudoknot within the library of RNAs. Conversion of the mRNA sequence into a SAM-binding RNA for crystallization involved using only the sequence between the 5′-side of the P1 helix to the 3′-side of the P2 helix. An additional guanine residue (see Fig. 9.3C, circled) was added to the 5′-end to ensure efficient transcription by T7 RNA polymerase and an adenosine residue was added to the 3′-end to facilitate cleavage of a downstream H∂V ribozyme.
The concentration of the inner oligonucleotides should be much less than the outer primers in order to limit the number of incorrect products and favor the full-length PCR product. A range between 500 and 100,000-fold excess of outer primers to inner oligonucleotides works well, such that in our typical PCR reaction the outer primers at 1 μM concentration while the inner primers are at 0.1 nM.
A molar ratio of between 3 and 6 of PCR insert to vector works well for ligation reactions. Therefore, to ensure a successful ligation it is advisable to first estimate the ratio of cut PCR product to cut vector. This can be done by simply running a 1% agarose gel and comparing the band intensities to a known amount of DNA, perhaps from a ladder. Then the molar quantity of PCR insert and vector can be estimated based on the molecular weight of each species.
It is important to use Pfu polymerase in the clone-free reactions until a full length template has been generated. This is due to Taq polymerase adding a non-templated adenosine to the 3′ end of each strand resulting in insertions within the ribozyme during the recombination reaction. Conversely, Pfu polymerase creates clean 3′ ends and has higher inherent fidelity yielding a template that is of the desired sequence.
The use of a HEPES buffer system for PCR and transcription reactions associated with the native purification method is necessitated by the use of the glmS ribozyme. It has been shown by several laboratories that this ribozyme is weakly activated by Tris buffer, causing cleavage before the addition of the activating ligand GlcN6P (39, 40).
The nature of contaminants will depend on the chosen purification method and the presence or absence of a 3′-end processing ribozyme. For RNA purification under denaturing conditions, an impure RNA sample most often is the result of a failure to resolve the sample RNA band from degradation products, the cleaved HδV ribozyme, or the uncleaved RNA–ribozyme sample depending on the RNA size. Either decreasing the percentage of acrylamide in the gel for large RNA species or increasing the percentage of acrylamide for small RNA species may alleviate this problem.
References
- 1.Pley HW, Flaherty KM, McKay DB. Three-dimensional structure of a hammerhead ribozyme. Nature. 1994;372:68–74. doi: 10.1038/372068a0. [DOI] [PubMed] [Google Scholar]
- 2.Scott WG, Finch JT, Klug A. The crystal structure of an all-RNA hammerhead ribozyme: a proposed mechanism for RNA catalytic cleavage. Cell. 1995;81:991–1002. doi: 10.1016/s0092-8674(05)80004-2. [DOI] [PubMed] [Google Scholar]
- 3.Cate JH, Gooding AR, Podell E, Zhou K, Golden BL, Kundrot CE, Cech TR, Doudna JA. Crystal structure of a group I ribozyme domain: principles of RNA packing. Science. 1996;273:1678–1685. doi: 10.1126/science.273.5282.1678. [DOI] [PubMed] [Google Scholar]
- 4.Cate JH, Gooding AR, Podell E, Zhou K, Golden BL, Szewczak AA, Kundrot CE, Cech TR, Doudna JA. RNA tertiary structure mediation by adenosine platforms. Science. 1996;273:1696–1699. doi: 10.1126/science.273.5282.1696. [DOI] [PubMed] [Google Scholar]
- 5.Klein DJ, Schmeing TM, Moore PB, Steitz TA. The kink-turn: a new RNA secondary structure motif. EMBO J. 2001;20:4214–4221. doi: 10.1093/emboj/20.15.4214. [DOI] [PMC free article] [PubMed] [Google Scholar]
- 6.Kieft JS, Batey RT. A general method for rapid and nondenaturing purification of RNAs. RNA. 2004;10:988–995. doi: 10.1261/rna.7040604. [DOI] [PMC free article] [PubMed] [Google Scholar]
- 7.Griffiths-Jones S, Moxon S, Marshall M, Khanna A, Eddy SR, Bateman A. Rfam: annotating non-coding RNAs in complete genomes. Nucleic Acids Res. 2005;33:D121–124. doi: 10.1093/nar/gki081. [DOI] [PMC free article] [PubMed] [Google Scholar]
- 8.Oubridge C, Ito N, Teo CH, Fearnley I, Nagai K. Crystallisation of RNA-protein complexes. II. The application of protein engineering for crystallisation of the U1A protein-RNA complex. J Mol Biol. 1995;249:409–423. doi: 10.1006/jmbi.1995.0306. [DOI] [PubMed] [Google Scholar]
- 9.Price SR, Ito N, Oubridge C, Avis JM, Nagai K. Crystallization of RNA-protein complexes. I. Methods for the large-scale preparation of RNA suitable for crystallographic studies. J Mol Biol. 1995;249:398–408. doi: 10.1006/jmbi.1995.0305. [DOI] [PubMed] [Google Scholar]
- 10.Batey RT, Sagar MB, Doudna JA. Structural and energetic analysis of RNA recognition by a universally conserved protein from the signal recognition particle. J Mol Biol. 2001;307:229–246. doi: 10.1006/jmbi.2000.4454. [DOI] [PubMed] [Google Scholar]
- 11.Scott WG, Finch JT, Grenfell R, Fogg J, Smith T, Gait MJ, Klug A. Rapid crystallization of chemically synthesized hammerhead RNAs using a double screening procedure. J Mol Biol. 1995;250:327–332. doi: 10.1006/jmbi.1995.0380. [DOI] [PubMed] [Google Scholar]
- 12.Ferre-D'Amare AR, Doudna JA. Crystallization and structure determination of a hepatitis delta virus ribozyme: use of the RNA-binding protein U1A as a crystallization module. J Mol Biol. 2000;295:541–556. doi: 10.1006/jmbi.1999.3398. [DOI] [PubMed] [Google Scholar]
- 13.Gilbert SD, Montange RK, Stoddard CD, Batey RT. Structural studies of the purine and SAM binding riboswitches. Cold Spring Harb Symp Quant Biol. 2006;71:259–268. doi: 10.1101/sqb.2006.71.015. [DOI] [PubMed] [Google Scholar]
- 14.Grundy FJ, Henkin TM. The S box regulon: a new global transcription termination control system for methionine and cysteine biosynthesis genes in grampositive bacteria. Mol Microbiol. 1998;30:737–749. doi: 10.1046/j.1365-2958.1998.01105.x. [DOI] [PubMed] [Google Scholar]
- 15.Winkler WC, Nahvi A, Sudarsan N, Barrick JE, Breaker RR. An mRNA structure that controls gene expression by binding S-adenosylmethionine. Nat Struct Biol. 2003;10:701–707. doi: 10.1038/nsb967. [DOI] [PubMed] [Google Scholar]
- 16.McPherson A. Crystallization of Biological Macromolecules. Cold Spring Harbor Press; Cold Spring Harbor, NY: 1999. [Google Scholar]
- 17.Pley HW, Flaherty KM, McKay DB. Model for an RNA tertiary interaction from the structure of an intermolecular complex between a GAAA tetraloop and an RNA helix. Nature. 1994;372:111–113. doi: 10.1038/372111a0. [DOI] [PubMed] [Google Scholar]
- 18.Doherty EA, Batey RT, Masquida B, Doudna JA. A universal mode of helix packing in RNA. Nat Struct Biol. 2001;8:339–343. doi: 10.1038/86221. [DOI] [PubMed] [Google Scholar]
- 19.Nissen P, Ippolito JA, Ban N, Moore PB, Steitz TA. RNA tertiary interactions in the large ribosomal subunit: the A-minor motif. Proc Natl Acad Sci U S A. 2001;98:4899–4903. doi: 10.1073/pnas.081082398. [DOI] [PMC free article] [PubMed] [Google Scholar]
- 20.Montange RK, Batey RT. Structure of the S-adenosylmethionine riboswitch regulatory mRNA element. Nature. 2006;441:1172–1175. doi: 10.1038/nature04819. [DOI] [PubMed] [Google Scholar]
- 21.Corbino KA, Barrick JE, Lim J, Welz R, Tucker BJ, Puskarz I, Mandal M, Rudnick ND, Breaker RR. Evidence for a second class of S-adenosylmethionine riboswitches and other regulatory RNA motifs in alpha-proteobacteria. Genome Biol. 2005;6:R70. doi: 10.1186/gb-2005-6-8-r70. [DOI] [PMC free article] [PubMed] [Google Scholar]
- 22.Gilbert SD, Rambo RP, Van Tyne D, Batey RT. Structure of the SAM-II riboswitch bound to S-adenosylmethionine. Nat Struct Biol. 2008;15:177–182. doi: 10.1038/nsmb.1371. [DOI] [PubMed] [Google Scholar]
- 23.Baugh C, Grate D, Wilson C. 2.8 A crystal structure of the malachite green aptamer. J Mol Biol. 2000;301:117–128. doi: 10.1006/jmbi.2000.3951. [DOI] [PubMed] [Google Scholar]
- 24.Kieft JS, Zhou K, Grech A, Jubin R, Doudna JA. Crystal structure of an RNA tertiary domain essential to HCV IRES-mediated translation initiation. Nat Struct Biol. 2002;9:370–374. doi: 10.1038/nsb781. [DOI] [PubMed] [Google Scholar]
- 25.Carrasco N, Buzin Y, Tyson E, Halpert E, Huang Z. Selenium derivatization and crystallization of DNA and RNA oligonucleotides for X-ray crystallography using multiple anomalous dispersion. Nucleic Acids Res. 2004;32:1638–1646. doi: 10.1093/nar/gkh325. [DOI] [PMC free article] [PubMed] [Google Scholar]
- 26.Hobartner C, Rieder R, Kreutz C, Puffer B, Lang K, Polonskaia A, Serganov A, Micura R. Syntheses of RNAs with up to 100 nucleotides containing site-specific 2′-methylseleno labels for use in X-ray crystallography. J Am Chem Soc. 2005;127:12035–12045. doi: 10.1021/ja051694k. [DOI] [PubMed] [Google Scholar]
- 27.Golden BL, Kundrot CE. RNA crystallization. J Struct Biol. 2003;142:98–107. doi: 10.1016/s1047-8477(03)00042-x. [DOI] [PubMed] [Google Scholar]
- 28.Keel AY, Rambo RP, Batey RT, Kieft JS. A general strategy to solve the phase problem in RNA crystallography. Structure. 2007;15:761–772. doi: 10.1016/j.str.2007.06.003. [DOI] [PMC free article] [PubMed] [Google Scholar]
- 29.Ferre-D'Amare AR, Doudna JA. Use of cis- and trans-ribozymes to remove 5′ and 3′ heterogeneities from milligrams of in vitro transcribed RNA. Nucleic Acids Res. 1996;24:977–978. doi: 10.1093/nar/24.5.977. [DOI] [PMC free article] [PubMed] [Google Scholar]
- 30.Batey RT, Kieft JS. Improved native affinity purification of RNA. RNA. 2007;13:1384–1389. doi: 10.1261/rna.528007. [DOI] [PMC free article] [PubMed] [Google Scholar]
- 31.Grodberg J, Dunn JJ. ompT encodes the Escherichia coli outer membrane protease that cleaves T7 RNA polymerase during purification. J Bacteriol. 1988;170:1245–1253. doi: 10.1128/jb.170.3.1245-1253.1988. [DOI] [PMC free article] [PubMed] [Google Scholar]
- 32.Zawadzki V, Gross HJ. Rapid and simple purification of T7 RNA polymerase. Nucleic Acids Res. 1991;19:1948. doi: 10.1093/nar/19.8.1948. [DOI] [PMC free article] [PubMed] [Google Scholar]
- 33.Li Y, Wang E, Wang Y. A modified procedure for fast purification of T7 RNA polymerase. Protein Expr Purif. 1999;16:355–358. doi: 10.1006/prep.1999.1083. [DOI] [PubMed] [Google Scholar]
- 34.Ichetovkin IE, Abramochkin G, Shrader TE. Substrate recognition by the leucyl/phenylalanyl-tRNA-protein transferase. Conservation within the enzyme family and localization to the trypsin-resistant domain. J Biol Chem. 1997;272:33009–33014. doi: 10.1074/jbc.272.52.33009. [DOI] [PubMed] [Google Scholar]
- 35.Pleiss JA, Derrick ML, Uhlenbeck OC. T7 RNA polymerase produces 5′ end heterogeneity during in vitro transcription from certain templates. RNA. 1998;4:1313–1317. doi: 10.1017/s135583829800106x. [DOI] [PMC free article] [PubMed] [Google Scholar]
- 36.Golden BL. Preparation and crystallization of RNA. Methods Mol Biol. 2007;363:239–257. doi: 10.1007/978-1-59745-209-0_12. [DOI] [PubMed] [Google Scholar]
- 37.Kim I, McKenna SA, Viani Puglisi E, Puglisi JD. Rapid purification of RNAs using fast performance liquid chromatography (FPLC) RNA. 2007;13:289–294. doi: 10.1261/rna.342607. [DOI] [PMC free article] [PubMed] [Google Scholar]
- 38.Bergfors T. Screening and optimization methods for nonautomated crystallization laboratories. Methods Mol Biol. 2007;363:131–151. doi: 10.1007/978-1-59745-209-0_7. [DOI] [PubMed] [Google Scholar]
- 39.McCarthy TJ, Plog MA, Floy SA, Jansen JA, Soukup JK, Soukup GA. Ligand requirements for glmS ribozyme self-cleavage. Chem Biol. 2005;12:1221–1226. doi: 10.1016/j.chembiol.2005.09.006. [DOI] [PubMed] [Google Scholar]
- 40.Roth A, Nahvi A, Lee M, Jona I, Breaker RR. Characteristics of the glmS ribozyme suggest only structural roles for divalent metal ions. RNA. 2006;12:607–619. doi: 10.1261/rna.2266506. [DOI] [PMC free article] [PubMed] [Google Scholar]