Abstract
Atherosclerotic plaque rupture is the main cause of myocardial infarction and stroke. Both clinical and computational studies indicate that the shoulder region, where a plaque joins the vessel wall, is rupture-prone. Previous mechanistic studies focused on mechanical properties of the fibrous cap and tensile stresses which could lead to tearing of the cap. Based on clinical observations of “mobile floating plaques,” we postulate that de-adhesion between the fibrous cap and the underlying vessel wall may also play a role in plaque failure. Thus, measuring adhesive strength of the bond between plaque and vascular wall may provide useful new insights into plaque stability. Delamination experiments, widely used in examining inter-laminar adhesive strength of biological materials, were used to measure adhesive strength of advanced plaques in apolipoprotein E knockout (apoE-KO) mice after 8 months on Western diet. We measured adhesive strength in terms of local energy release rate, , during controlled plaque delamination. As a measure of the fracture energy required to delaminate a unit area of plaque from the underlying internal elastic lamina (IEL), provides a quantitative measure of local adhesive strength of the plaque-IEL interface. The values for acquired from 16 plaques from nine apoE-KO mouse aortas formed a positively skewed distribution with a mean of 24.5 J/m2, median of 19.3 J/m2, first quartile of 10.8 J/m2, and third quartile of 34.1 J/m2. These measurements are in the lower range of values reported for soft tissues. Histological studies confirmed delamination occurred at the interface between plaque and IEL.
Keywords: atherosclerosis, plaque rupture, fibrous cap, fracture energy, delamination, peel test
1. Introduction
Atherosclerotic plaque rupture is the main cause of myocardial infarction, coronary thrombosis and stroke. Since plaque rupture has taken more lives than any other disease in the Western world over the past century, a better understanding of this pathology is needed to develop effective approaches for treatment or intervention.
A normal elastic artery is composed of concentric layers of intima, which is a layer of endothelial cells on a basement membrane, media, which consists of multiple smooth muscle cell layers separated by elastin lamellae, and adventitia. Atherosclerotic disease progression results in a dramatically thickened intima. Clinical observations indicate that a vulnerable plaque features a thin, collagen-rich fibrous cap overlying a large necrotic core (Libby et al., 1996). Clinically, plaque rupture is defined as failure of the plaque resulting in exposure of the necrotic core. Plaque rupture and plaque vulnerability (susceptibility to rupture) were initially defined based on pathological features seen in autopsy specimens; namely, an apparent break in the fibrous cap, often with superimposed thrombus (Virmani et al., 2000). Pathological observations reveal two classes of rupture sites: 63% of ruptures occur in the shoulder region, where the plaque joins the more normal intima, while the remainder (37%) occur in the center of the fibrous cap (Richardson et al., 1989; Maehara et al., 2002). Pathological studies of ruptured plaques reveal little of the actual failure mechanism, since they focus on the endpoint rather than the event itself. Previous mechanistic studies of plaque rupture have focused on mechanical properties of the fibrous cap (Lendon et al., 1991; Holzapfel et al., 2004) and local tensile stresses which could lead to tearing of the cap (Loree et al., 1992; Cheng et al., 1993; Vengrenyuk et al., 2006).
Autopsy studies have confirmed that the shoulder region, where a plaque joins the surrounding vascular wall, is rupture-prone (Richardson et al. 1989; Cheng et al., 1993). Rupture in the shoulder region may be due to tearing of the fibrous cap adjacent to the vessel wall, physical separation of the plaque from the artery along their interface in a manner similar to delamination processes in bonded materials, or a combination of both mechanisms. Thus, shoulder rupture may involve propagation of the separation in a direction that is parallel to one surface of the plaque (Richardson, et al., 2002). Support for this mechanism comes from clinical observations of “mobile floating plaques” (Ferrero, et al., 2009; Cho, et al., 2002), which present as plaque segments that are fully separated from the vessel wall, consistent with shoulder region rupture processes. One approach for quantifying rupture resistance is to determine the adhesive strength of the bond between the plaque and the vascular wall. This approach provides a promising candidate metric for shoulder rupture resistance, which has not previously been studied. A relatively well-known approach for experimentally quantifying the adhesive strength of the bond between two materials is to employ a class of well-developed experimental protocols that are widely used to examine interlaminar adhesive strength of various biological materials (Ahsan et al., 1999; Smolek and McCarey, 1990; Sommer et al., 2008). A summary of related experimental data is given in Table 1.
Table 1.
| Tissue | Fracture energy (J/m2) | Reference |
|---|---|---|
| Bovine articular cartilage, repaired |
16 | [Ahsan, et al, 1999] |
| Rabbit corneal stroma, repaired | 36 | [Maurice, et al, 1990] |
| Rat skin, grafted | 20 | [Dong, et al, 1993] |
| Porcine aorta | 18.8±8.9 ~ 113.4±40.5 | [Roach, et al, 1994] |
| Human abdominal aorta | 51±6 ~ 76±27 | [Sommer, et al, 2007] |
| Mouse atherosclerotic plaque- internal elastic lamina interface |
24.5±18.6 | Present study |
As distinct from previous studies, the focus of this work is on development and application of a methodology to quantify the adhesive strength between the atherosclerotic plaque and the underlying vascular wall in a mouse model using the local energy release rate, , as a quantifiable metric for direct comparison of plaque separation strengths. In addition, our mechanical experiments are complemented by histology to explore the location and microstructural characteristics of the separated surfaces.1
2. Materials and Methods
2.1 Animal Model and Specimen Preparation
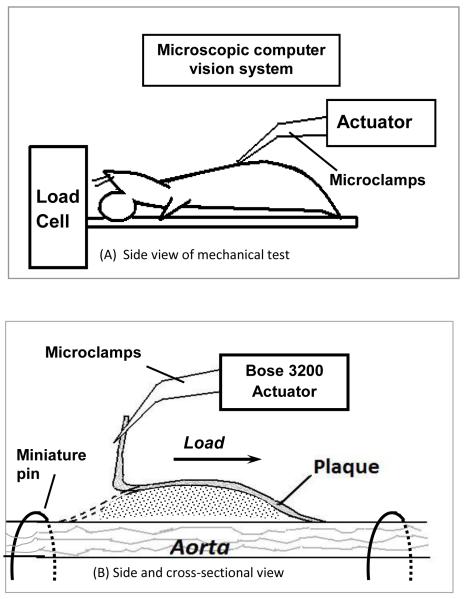
Nine apolipoprotein E-knockout (apo E-KO) male mice were used in this study. Six-week old apo E-KO mice were fed a high-fat (42% of total calories) Western diet for 8 months to develop atherosclerosis throughout the aorta (Nakashima et al., 1994). Mice were sacrificed by carbon dioxide asphyxiation and perfused through the left ventricle with heparinized normal saline for 5 minutes at physiological pressure. The transparency of the mouse aorta enables us to open it longitudinally to expose each plaque without introducing additional damage. To initiate surface separation (delamination), a small initial flaw was carefully introduced at the proximal end of the plaque using a pair of fine forceps under the microscope. Since the plaques were delaminated in situ, the surrounding and underlying tissue provides considerable stiffness, restricting the outward motion of the aorta during mechanical loading. For the thoracic aorta, the intercostal branches secured the aorta within the thoracic cavity. For the abdominal aorta, additional restraint was required due to the paucity of dorsally-oriented vascular branches. To further restrain the abdominal aorta, bent insect pins were placed on both ends of a plaque to prevent excessive outward motion of the aorta during delamination, as shown schematically in Figure 1B.2 Animals used in this study were euthanized by humane methods in accordance with PHS guidelines and as approved by the Institutional Animal Care and Use Committee of the University of South Carolina.
Figure 1. Schematic of the delamination process (longitudinal view).
The overall mechanical test setup is shown in A. The boxed area in A is shown in B as an enlarged side and cross-sectional view.
2.2 Shoulder Rupture by Plaque-Vessel Separation: Delamination Experiments
2.2.1 Experimental Device
The plaque delamination experiments were performed on a computer-controlled biomechanical test machine (Bose ElectroForce 3200 Test Instrument, Eden Prairie, MN, USA). The accuracy of the displacement transducer and the load cell were estimated to be 30 μm and 0.02 g, respectively. The mechanical test bed was interfaced with a stereomicroscope computer vision system, comprised of a Nikon SMZ-U light microscope, a monochrome Q-Imaging QICAM 10-bit camera, a 1934 PCMCIA card for image acquisition, and a Nikon FOI-150 fiber optic illuminator. The apparatus was placed on a floating optical bench for vibration isolation.
2.2.2 Experimental Protocol
A schematic of the experimental setup is shown in Figure 1. A mouse carcass with exposed aorta was secured to a small plate with tape as shown in Figure 1A. The plate was connected to the load cell of the Bose ELF 3200 for load data recording. The small delamination on the proximal end of the plaque was gripped by a pair of micro-clamps connected to the Bose ELF 3200 actuator. The actuator applied sequential loading-unloading cycles to the plaque as the delamination process proceeded at a displacement rate of 0.05 mm/s towards the distal end of the plaque. During the displacement process, which was incremented in steps from 0.3 mm to 0.8 mm (step size depended on the size of the plaque; small steps were used for smaller plaques), a sequence of plaque delamination events was generated. The load and displacement measurements during all delamination events were recorded by the Bose system.
2.2.3. Load-Displacement Measurements during Delamination
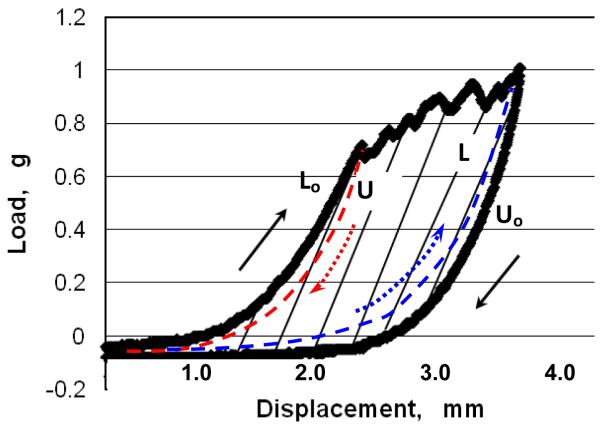
Figure 2 shows a typical load-displacement measurement during a delamination event. It should be noted that the initial ramp of the load vs. displacement curve is not part of the delamination stage. The initial ramp corresponds to the deformation energy of the peel arm, i.e. the energy associated with deformation of the plaque prior to the separation event. The beginning of the delamination process occurs as the measured load reaches a maximum and drops.3 The process continues until unloading is initiated.
Figure 2. Schematic of load-displacement curve during a single loading-unloading cycle with plaque delamination.
The jagged horizontal segments indicate the rupture between the plaque and the underlying vascular wall that occurs during delamination. The black arrows show the original loading path, Lo, and unloading path, Uo, respectively, during the delamination process. The area within the black curves corresponds to a first order estimate of the fracture energy for this delamination event. The paths identified by dashed lines are additional unloading and loading paths discussed in the Appendix.
2.2.4. Delamination Area
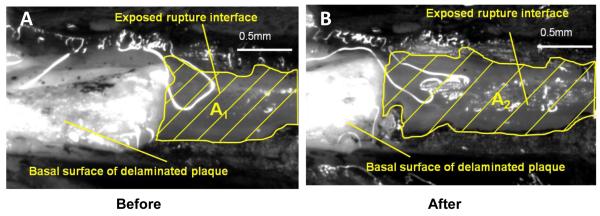
Each loading-unloading cycle generates newly exposed area. Sequentially exposed areas of the vessel wall underlying the plaque were imaged by the computer vision system described above. To identify the newly exposed area, we applied black marking tissue dye (Polysciences, Inc. Warrington, PA, USA) to the surface of the plaque and its surrounding area before sequential delamination cycles. Figure 3 shows a pair of images of the delamination surface with two different amounts of delamination.
Figure 3. Top view of exposed rupture interface and basal surface of delaminated plaque before (A) and after (B) a loading-unloading cycle.
The black tissue marking dye clearly outlines the newly-exposed rupture surface (grey) A1 and A2 on the vascular wall. After a loading-unloading cycle, a segment of the plaque (white) was peeled off the vascular wall, so there is more rupture interface exposed in B than in A. Scale bar = 0.5 mm.
2.3 Histology
To locate the rupture surface, we examined longitudinal sections of partially-delaminated plaques using Masson’s Trichrome staining. Lipid distribution in delaminated plaques was visualized using Oil Red O (ORO) staining. All histological methods are described in detail in Appendix A.
2.4 Scanning Electron Microscopy (SEM)
Following completion of mechanical experiments (without applying dye for marking the fracture surface), isolated plaques and underlying vascular wall were fixed with 4% glutaraldehyde overnight and processed using standard techniques for SEM examination. The basal surfaces of the plaques and the exposed upper surface of the vascular wall were imaged to investigate the topography and roughness of the rupture surface.
3. Results
3.1. Determination of Energy Release Rate,
To determine , the delamination area and the energy required to complete the delamination process are measured. The exposed delamination areas shown in Figure 3 are quantified by Image Pro Plus image analysis software (Media Cybernetics, Bethesda, MD). The difference in exposed area before (A1) and after (A2) the delamination cycle, ΔA, represents freshly exposed area resulting from this delamination cycle, which can be calculated as
| (Eqn. 1) |
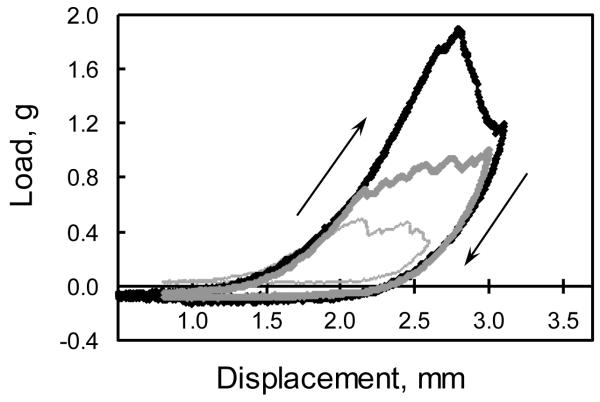
The area between the loading curve at a fixed delamination area and the unloading curve after additional delamination of area ΔA is a measure of the increment of energy, ΔE, required for delamination of additional area ΔA. Examples of three representative loading-unloading curves are shown in Figure 4. To determine the local value, , the fracture energy ΔE from one delamination cycle will be divided by its corresponding exposed area ΔA, as shown below:
| (Eqn. 2) |
where the local value of is the energy per unit area required to delaminate the plaque at the current flaw location. Due to material heterogeneities, may be a function of the local delamination area. As the delamination propagated along the longitudinal axis of the plaque, sequential values of local energy release rate, , were measured and plotted versus total exposed area, A.
Figure 4. Three representative load-displacement curves of 3 single loading-unloading cycles in the plaque delamination test.
The jagged segments indicate the effects of delamination between the plaque and the underlying vessel. The arrows show the loading and unloading paths, respectively. The area within each curve corresponds to the required fracture energy measurement for this delamination event.
3.2. Energy Release Rate Measurements for apo E-KO mice
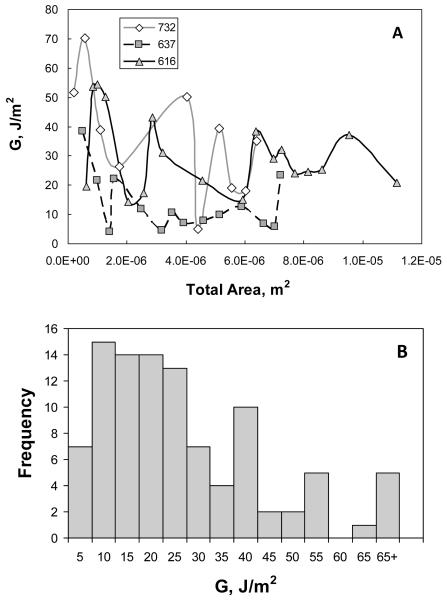
Figure 5A shows curves of vs. A for three representative plaques obtained from three mice (the legend indicates individual animal ID). Figure 5A clearly demonstrates that varies along the length of each individual plaque, as well as among animals. Figure 5B presents a summary in histogram form of the measurements for 99 data points obtained from 16 atherosclerotic plaque delamination experiments performed using aorta specimens from nine mice, where it is evident that is a positively skewed distribution. The statistical parameters describing the distribution of all measured data are given in Table 2.
Figure 5. Energy release rate () vs. total exposed area.
Three representative curves corresponding to all loading and unloading cycles for each of three plaques are shown in (A). Each point represents an individual delamination event (step). The legend indicates individual mouse ID numbers. Panel B summarizes in histogram form values of local energy release rate, , obtained from 16 atherosclerotic plaques from 9 apo E-KO mice. Mean value of with remaining statistical parameters given in Table 2
Table 2.
Statistical Parameters for Distribution of Experimental Measurements
| N | 99 |
|---|---|
| Skewness | 1.43 |
| Kurtosis | 2.15 |
| Median (J/m2) | 19.62 |
| Mean (J/m2) | 24.46 |
| SD (J/m2) | 18.64 |
| quartile 1 (J/m2) | 10.84 |
| quartile 3 (J/m2) | 34.08 |
As shown in Table 2, the positive skewness of 1.42 differs significantly from 0 (P<0.005) indicating a non-normal distribution. The measured kurtosis is also significantly greater than 0 (P<0.01), indicating that the distribution is leptokurtic. The reported standard deviation (SD) remains an indicator of variability, though the first and third quartile values are generally used to describe the variability for non-normal distributions.
In a few cases, we observed values much higher than those typical for most of our plaque delamination experiments due to alternate failure mechanisms, such as delamination within the media, fibrous cap tearing, or delamination within branch arteries where the plaque has extended during development.
3.3. Histology
3.3.1. Masson’s Trichrome
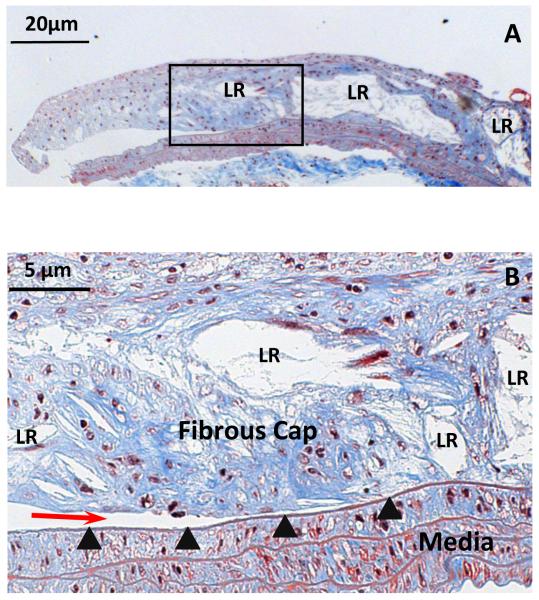
As shown in Figure 6, histological studies at 200X magnification indicate that most delamination propagated along the interface of the plaque and the underlying IEL. Examination by light microscopy revealed an intact IEL after the delamination process. Furthermore, as highlighted in Fig. 6, there are a significant number of broadly distributed lipid-rich regions (LR in Fig. 6) throughout the plaque and in the vicinity of the plaque-IEL boundary.
Figure 6. Histological demonstration of delamination surface location.
A. Masson’s Trichrome staining of a longitudinal section of a partially delaminated plaque, leaving part of it attached to the underlying IEL (50X, scale bar = 50 μm). B. The boxed area in A was enlarged (200X, scale bar = 20 μm), showing the crack front (red arrow) located between the atherosclerotic plaque cap and its underlying IEL (arrowheads). Collagen is stained blue, nuclei purple-black, and SMCs red. Lipid-rich regions in the plaque are identified by LR label.
3.3.2. SEM examination
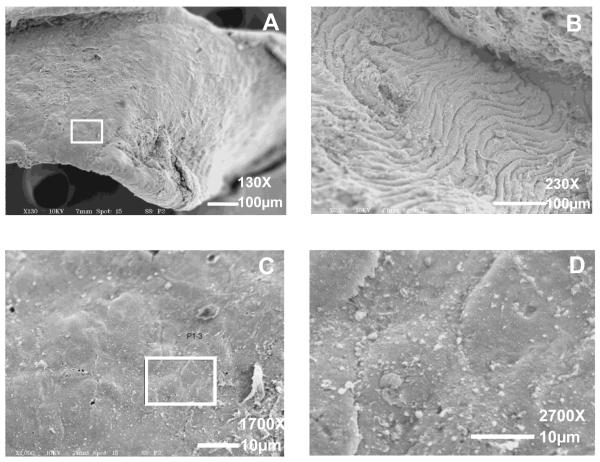
The basal surfaces of five plaques examined by SEM appeared homogeneously smooth under magnifications up to 1700X, as shown by the example in Figure 7A, C. At higher magnification (2700X), individual cell boundaries are evident (Figure 7D). The exposed surface of the vascular wall underlying the plaque is characterized by wrinkling of the IEL and media, since the specimens were not fixed under pressure (Figure 7B). The basal surface of plaques, which can be identified by small deformations made by the micro-clamps, had no obvious differences in surface roughness or surface damage that would suggest the presence of regions of stronger adhesion, even at higher magnifications as shown in Figure 7C, D. For this reason, the total exposed area was considered to be a good estimate for the attachment region between the plaque and the IEL when estimating ΔA and computing .
Figure 7. SEM images of the basal surface of a delaminated plaque (A, C, D) and the exposed upper surface of the underlying IEL (B).
The boxed area in A is shown at higher magnification in C and D, respectively. Magnification = 130X (A); 230X (B). Scale bars = 100 μm. Magnification = 1700X (C); 2700X (D). Scale bars = 10 μm.
3.3.3. Oil Red O Staining
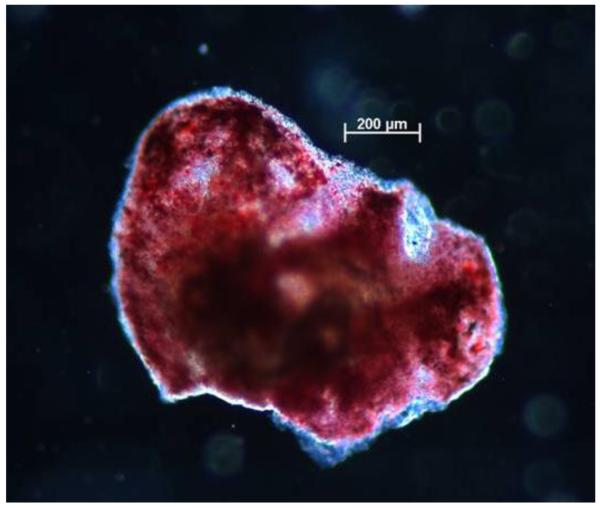
An additional method for identifying the presence and distribution of lipid material in the plaque is to perform Oil Red O (ORO) staining. Figure 8 shows a representative example of lipid distribution, visible as red areas, in an ORO-stained mouse plaque specimen.
Figure 8. Representative image of Oil Red O-stained atherosclerotic plaque.
Presence of lipids (red areas) throughout the plaque is evident, even in regions near the edge of the specimen. Scale bar = 200 μm.
4. Discussion
To the best of our knowledge, quantifying the rupture resistance of atherosclerotic plaques in apo E-KO mouse models using local delamination experiments and the corresponding local energy release rate () has not been reported previously. Delamination measurements provide a reasonable, quantifiable plaque failure metric, consistent with clinical observations of mobile, “floating” plaques and of plaque failure at the shoulder region. Furthermore, histological studies indicate that our delamination experiments reflect the strength of the plaque-IEL interface region during delamination, as measured by the local energy release rate, .
In our study, the mean measured value of for delamination of mouse atherosclerotic plaques is 24.5 J/m2, the first quartile value is 10.8 J/m2 and the third quartile value is 34.1 J/m2. The mean value is consistent with published studies that have reported mean energy release rates for fracture of repaired bovine articular cartilage, repaired rabbit corneal stroma and rat grafted skin as 16 J/m2, 36 J/m2 and 20 J/m2, respectively (Ahsan et al., 1999; Maurice et al., 1990; Dong et al., 1993). The agreement in energy release rates may result from a similar collagen-rich structure in repaired or grafted tissues, in which a wound healing response generates newly deposited extracellular matrix. The variations in energy release rate which we measured are also nominally consistent with reported standard deviation values for previously published measurements that appear to assume a Gaussian distribution, unlike that observed in our study.
A number of groups have studied the dissection properties of human aortic media and porcine aortic media using tear tests to measure fracture toughness (Purslow, 1983a) or delamination experiments (Sommer et al., 2008; Roach, et al., 1994). However, their results are not directly comparable to our own, for at least two reasons. First, these groups investigated delamination properties of normal arterial tissues rather than vascular lesions as in our study. The neointima of the atherosclerotic plaque is not a component of the normal arterial wall, but a lesion which develops over time in response to a chronic inflammatory process. Secondly, the aforementioned groups investigated delamination occurring within the arterial media, which is structurally very different from the neointima, consisting of multiple distinct layers of smooth muscle cells and elastin sheets. In the present study, histological investigation demonstrated that the delamination surface in mouse atherosclerotic lesions lies between the plaque, a relatively acellular tissue, and the underlying IEL rather than within the media. We did observe higher energy release rates in several experiments in which unintentional medial tearing occurred (i.e., instances where the initial defect at the plaque edge was slightly below the interface), but no effort was made to systematically quantify these observations.
As shown in Fig. 5, there is considerable variation in the measured local energy release rate, . A possible source of this variability is an uneven distribution of lipids along the length of the plaque, where it is conjectured that the presence of lipids should reduce plaque-vessel bond strength. As shown in Figure 8, our ORO staining studies for delaminated plaque specimens indicate that lipid rich regions are scattered throughout the plaque-vessel interface region and hence may contribute to the variability in measured energy release rate values for mice of one genotype. Combining this observation with the cross-sectional view in Fig. 6, where lipid-rich regions are identified as lacunae after tissue processing, the results demonstrate that lipid-rich material is distributed throughout the thickness of the plaque and along its zone of attachment to the IEL.
An additional factor which may contribute to the scatter in measured energy release rates is variation in anatomic location and size of the plaques. Since each animal provided only a few plaques suitable for testing, our data includes results from plaques located throughout the length of the descending aorta.
As remarked earlier, plaques with low shoulder region rupture resistance have the potential to fail by detaching at the shoulder region, subject to other factors, such as circumferential stress, shear stress (Slager et al., 2005; Fukumoto et al., 2008), and fatigue (Versluis et al., 2006). Whether plaque failure by delamination occurs in vivo will depend on the loading mechanisms as well as the delamination resistance and tearing resistance of the fibrous cap. In vivo, the wall-plaque interface at the shoulder region is exposed to a mixed stress state, and it is not clear which failure mode dominates. Plaque delamination does not provide an explanation for ruptures which occur in the middle of the fibrous cap, which are better explained by some combination of stress concentration (Vengrenyuk et al., 2006) and reduced material strength in macrophage-rich regions (Lendon et al., 1991).
Since the delamination toughness of our highly viscoelastic material is expected to be strain rate-dependent, we chose an initial strain rate on the same order of magnitude as that used in previous studies (Sommer et al., 2008; Maurice et al., 1990; Wang et al., 2007). Therefore, the results from our study are valid for direct comparison with published data. Published studies of other laminar, biological soft tissues failed to demonstrate a statistically significant difference in tearing toughness as the strain rate changed over one order of magnitude (Purslow, 1983b).
As shown schematically in Figure 1B, the mechanical loading process during plaque delamination results in deformation conditions that translate into relatively complex stress and strain conditions in the vicinity of the delamination front. Though plaque detachment in our experimental system is nominally mixed-mode, with the applied load approximately parallel to the initial plaque surface, our visual observations during the local delamination process suggest that the local displacements in the vicinity of the the delamination front appear to be primarily of an “opening mode” (e.g. nominally mode I), suggesting Mode I dominance of the measured delamination response. Detailed studies including simulations would be needed to fully understand the mode mixity that is present near the delamination front.
Finally, the authors performed a series of loading-unloading studies, highlighted in Appendix B, to show that dissipation effects make a relatively small (<10%) contribution to the measured values of for our experiments.
5. Limitations and Future Work
Our delamination experiments were limited by two specific issues: (1) the development time of plaques and (2) the location of plaques. Relative to the first of these issues, we have been limited to conducting delamination experiments on atherosclerotic plaques at eight months due to the morphological features of atheromas at earlier time points. Most lesions in mice at 6 months or earlier were either xanthomas or early stage fibroatheromas. Xanthomas, lesions composed mainly of lipid-filled foam cells, cannot be peeled from the vascular wall without disintegrating. Early stage fibroatheromas are too small in surface area to be tested in our system. Relative to the second issue, plaques at aortic branches and bifurcations are more difficult to analyze because the complex geometry confounds accurate area measurements, while also modifying the manner in which the plaques are extracted from the branch arteries.
Due to the small dimensions of our samples, the microstructural changes at the delamination interface cannot be imaged directly during delamination experiments. Therefore, the failure mode of load-bearing elements such as collagen fibers has not been observed. Extracellular matrix fibers could potentially be broken, pulled loose, or peeled off from the substrate by a combination of tensile stress and shear stress that may be present in the region of the delamination front.
The aim of the present study is to develop a new measurement protocol to quantify the resistance to detachment from the underlying IEL of advanced atherosclerotic plaques, providing an estimate for the stability of a plaque that undergoes such a failure process. By applying this quantitative approach to mice of different genotypes, which display quantifiable differences in plaque composition, we plan to investigate correlations between plaque composition and adhesive strength at the plaque-IEL interface. The measured values of energy release rate should also prove useful as input to computational studies to estimate the likelihood of various mechanisms of plaque failure (e.g., fibrous cap tearing vs. fibrous cap delamination) under different loading regimes. Such computational studies may provide insight into mechanisms responsible for development of “mobile” or “floating” atherosclerotic plaques.
Supplementary Material
7. Acknowledgements
We would like to thank Jeffrey Davis for SEM specimen preparation and imaging. This work was funded by NSF CMMI-0926301 (S.M.L., M.A.S), American Heart Association 0635396N (S.M.L.), NIH/NCRR P20 RR021949-01A2 (S.M.L.), and NSF EPS-0903795. The study sponsors have played no role in the study design, analysis, or manuscript preparation.
Footnotes
Publisher's Disclaimer: This is a PDF file of an unedited manuscript that has been accepted for publication. As a service to our customers we are providing this early version of the manuscript. The manuscript will undergo copyediting, typesetting, and review of the resulting proof before it is published in its final citable form. Please note that during the production process errors may be discovered which could affect the content, and all legal disclaimers that apply to the journal pertain.
Studies focused on quantifying the resistance to separation of materials joined along a common interface surface are oftentimes known as delamination experiments.
Estimation of in this work assumes the aorta has minimal deformation during delamination. This assumption can be readily modified to include the effect of the elasticity of the aorta, e.g., use of an elastic foundation where the elastic properties of the aorta are determined separately.
The small amount of area under the load-displacement curve up to the first maximum load is not associated with the actual separation. The contribution is quite small so that it is included in the ΔE estimation for each cycle.
6. Conflict of Interest Statement
The authors have no conflicts of interest to report.
References
- Ahsan T, Sah RL. Biomechanics of integrative cartilage repair. Osteoarthritis and Cartilage. 1999;7:29–40. doi: 10.1053/joca.1998.0160. [DOI] [PubMed] [Google Scholar]
- Cheng GC, Loree HM, Kamm RD, Fishbein MC, Lee RT. Distribution of circumferential stress in ruptured and stable atherosclerotic lesions: A structural analysis with histopathological correlation. Circulation. 1993;87:1179–87. doi: 10.1161/01.cir.87.4.1179. [DOI] [PubMed] [Google Scholar]
- Cho YP, Kwon TW, Kim GE. Sonographic appearance of a free-floating atheromatous plaque in a patient with acute stroke. J. Clin. Ultrasound. 2002;30:317–321. doi: 10.1002/jcu.10064. [DOI] [PubMed] [Google Scholar]
- Dong C, Mead E, Shalak R, Fung YC, Debes JC, Zapata-Sirvent RL, Andree C, Greenleaf G, Cooper M, Hansbrough JF. Development of a device for measuring adherence of skin graft to the wound surface. Annals of Biomedical Engineering. 1993;21:51–55. doi: 10.1007/BF02368164. [DOI] [PubMed] [Google Scholar]
- Ferrero E, Gaggiano A, Ferri M, Nessi F. Mobile floating carotid plaque post-trauma. Diagnosis and treatment. Interactive Cardiovascular and Thoracic Surgery. 2009;8:496–497. doi: 10.1510/icvts.2008.198754. [DOI] [PubMed] [Google Scholar]
- Forsell C, Gasser TC. Numerical simulation of the failure of ventricular tissue due to deep penetration: The impact of constitutive properties. Journal of Biomechanics. 2011;44:45–51. doi: 10.1016/j.jbiomech.2010.08.022. [DOI] [PubMed] [Google Scholar]
- Fukumoto Y, Hiro T, Fujii T, Fujimura T, Yamada J, Okamura T, Matsuzaki M. Localized elevation of shear stress is related to coronary plaque rupture: A 3-Dimensional intravascular ultrasound study with in-vivo color mapping of shear stress distribution. Journal of the American College of Cardiology. 2008;51:645–650. doi: 10.1016/j.jacc.2007.10.030. [DOI] [PubMed] [Google Scholar]
- Holzapfel GA, Sommer G, Regitnig P. Anisotropic mechanical properties of tissue components in human atherosclerotic plaques. Journal of Biomechanical Engineering. 2004;126:657–665. doi: 10.1115/1.1800557. [DOI] [PubMed] [Google Scholar]
- Lendon CL, Davies MJ, Born GV, Richardson PD. Atherosclerotic plaque caps are locally weakened when macrophages density is increased. Atherosclerosis. 1991;87:87–90. doi: 10.1016/0021-9150(91)90235-u. [DOI] [PubMed] [Google Scholar]
- Libby P, Geng YJ, Aikawa M, Schoenbeck U, Mach F, Clinton SK, Sukhova GK, Lee RT. Macrophages and atherosclerotic plaque stability. Current Opinions in Lipidology. 1996;7:330–335. doi: 10.1097/00041433-199610000-00012. [DOI] [PubMed] [Google Scholar]
- Loree HM, Kamm RD, Stringfellow RG, Lee RT. Effects of fibrous cap thickness on peak circumferential stress in model atherosclerotic vessels. Circulation Research. 1992;71:850–858. doi: 10.1161/01.res.71.4.850. [DOI] [PubMed] [Google Scholar]
- Maehara A, Mintz GS, Bui AB, Walter OR, Castagna MT, Canos D, Pichard AD, Satler LF, Waksman R, Suddeath WO, Laird JR, Kent KM, Weissman NJ. Morphologic and angiographic features of coronary plaque rupture detected by intravascular ultrasound. Journal of the American College of Cardiology. 2002;40:904–910. doi: 10.1016/s0735-1097(02)02047-8. [DOI] [PubMed] [Google Scholar]
- Maurice DM, Monroe F. Cohesive strength of corneal lamellae. Experimental Eye Research. 1990;50:59–63. doi: 10.1016/0014-4835(90)90011-i. [DOI] [PubMed] [Google Scholar]
- Nakashima Y, Plump AS, Raines EW, Breslow JL, Ross R. Apo E-deficient mice develop lesions of all phases of atherosclerosis throughout the arterial tree. Arteriosclerosis and Thrombosis. 1994;14:133–140. doi: 10.1161/01.atv.14.1.133. [DOI] [PubMed] [Google Scholar]
- Purslow PP. Positional variations in fracture toughness, stiffness and strength of descending thoracic pig aorta. Journal of Biomechanics. 1983a;16:947–953. doi: 10.1016/0021-9290(83)90058-1. [DOI] [PubMed] [Google Scholar]
- Purslow PP. Measurement of the fracture toughness of extensible connective tissue. Journal of Materials Science. 1983b;18:3591–3598. [Google Scholar]
- Richardson PD, Davies MJ, Born GV. Influence of plaque configuration and stress distribution on fissuring of coronary atherosclerotic plaques. Lancet. 1989;2:941–44. doi: 10.1016/s0140-6736(89)90953-7. [DOI] [PubMed] [Google Scholar]
- Richardson PD. Biomechanics of plaque rupture: progress, problems, and new frontiers. Annals of Biomedical Engineering. 2002;30:524–536. doi: 10.1114/1.1482781. [DOI] [PubMed] [Google Scholar]
- Roach MR, Song SH. Variations in strength of the porcine aorta as a function of location. Clin. Invest. Med. 1994;17:308–318. [PubMed] [Google Scholar]
- Slager CJ, Wentzel JJ, Gijsen FJH, Thury A, Wal AC, Schaar JA, Serruys PW. The role of shear stress in the destabilization of vulnerable plaques and related therapeutic implications. Nature Clinical Practice Cardiovascular Medicine. 2005;2(9):456–464. doi: 10.1038/ncpcardio0298. [DOI] [PubMed] [Google Scholar]
- Smolek MK, McCarey BE. Interlamellar adhesive strength in human eyebank corneas. Investigative Opthalmology and Visual Science. 1990;31(6):1087–1095. [PubMed] [Google Scholar]
- Sommer G, Gasser TC, Regitnig P, Auer M, Holzapfel GA. Dissection properties of the human aortic media: An experimental study. Journal of Biomechanical Engineering. 2008;130:021007-1–12. doi: 10.1115/1.2898733. [DOI] [PubMed] [Google Scholar]
- Vengrenyuk Y, Carlier S, Xanthos S, Cardoso L, Ganatos P, Virmani R, Einav S, Gilchrist L, Weinbaum S. A hypothesis for vulnerable plaque rupture due to stress-induced debonding around cellular microcalcifications in thin fibrous caps. Proceedings of the National Academy of Sciences (USA) 2006;103(40):14678–14683. doi: 10.1073/pnas.0606310103. [DOI] [PMC free article] [PubMed] [Google Scholar]
- Versluis A, Bank AJ, Douglas WH. Fatigue and plaque rupture in myocardial infarction. Journal of Biomechanics. 2006;39:339–347. doi: 10.1016/j.jbiomech.2004.10.041. [DOI] [PubMed] [Google Scholar]
- Virmani R, Kolodgie FD, Burke AP, Farb A, Schwartz SM. Lessons from sudden coronary death: A comprehensive morphological classification scheme for atherosclerotic lesions. Arteriosclerosis, Thrombosis, and Vascular Biology. 2000;20:1262–1275. doi: 10.1161/01.atv.20.5.1262. [DOI] [PubMed] [Google Scholar]
- Wang X, Nyman JS. A novel approach to assess post-yield energy dissipation of bone in tension. Journal of Biomechanics. 2007;40:674–677. doi: 10.1016/j.jbiomech.2006.02.002. [DOI] [PMC free article] [PubMed] [Google Scholar]
Associated Data
This section collects any data citations, data availability statements, or supplementary materials included in this article.


