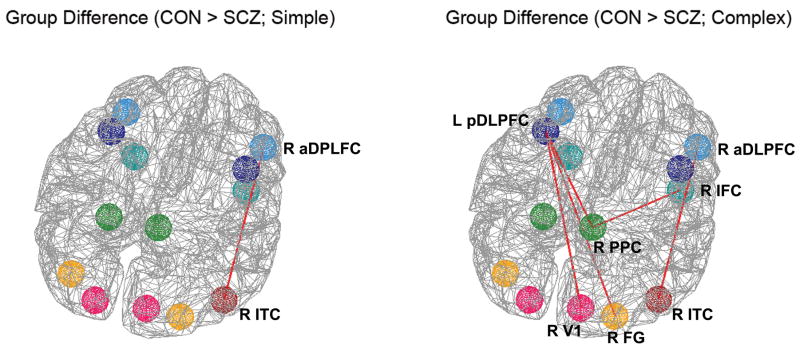
Figure 5.
Group differences in the fMRI time-series temporal correlations in simple (left) and complex (right) conditions. Red lines indicate interregional functional connectivity where group differences were found. In the simple condition, patients had reduced temporal correlations between R aDLPFC and R ITC, while they had reduced temporal correlations in more prefrontal-visual ROI pairs in the complex condition, including L pDLPFC ~ R PPC, L pDLPFC ~ R FG, L pDLPFC ~ R V1, R aDLPFC ~ R ITC, and R IFC ~ R PPC.

