Abstract
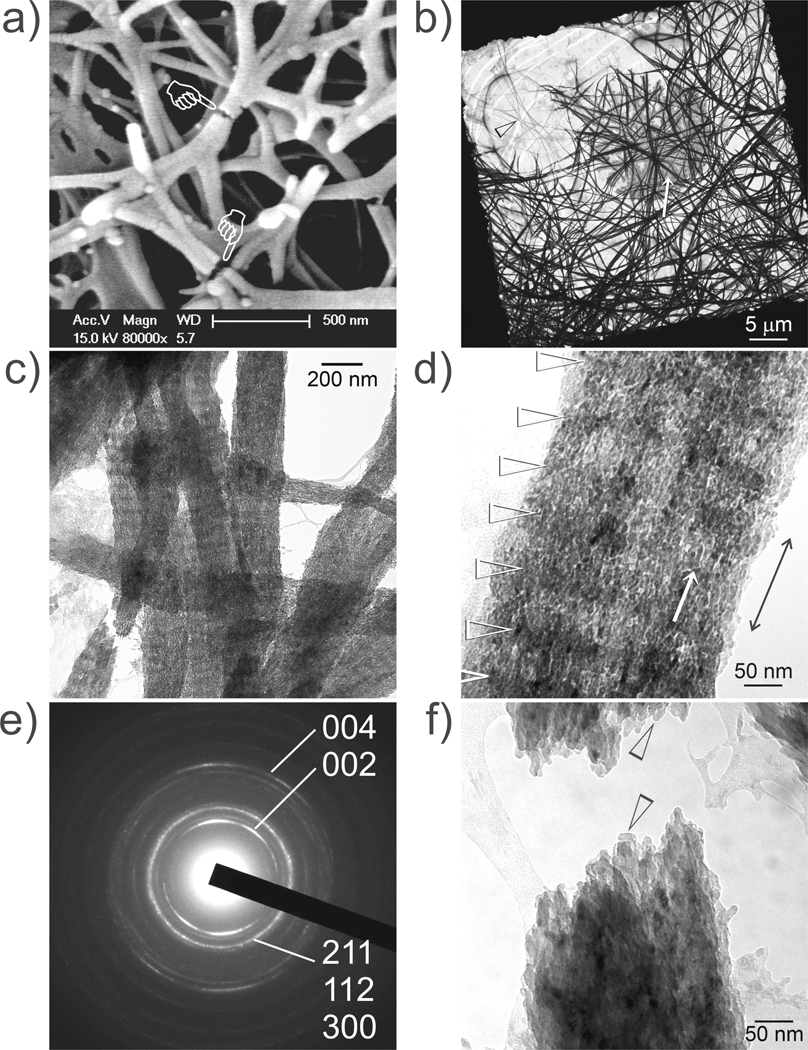
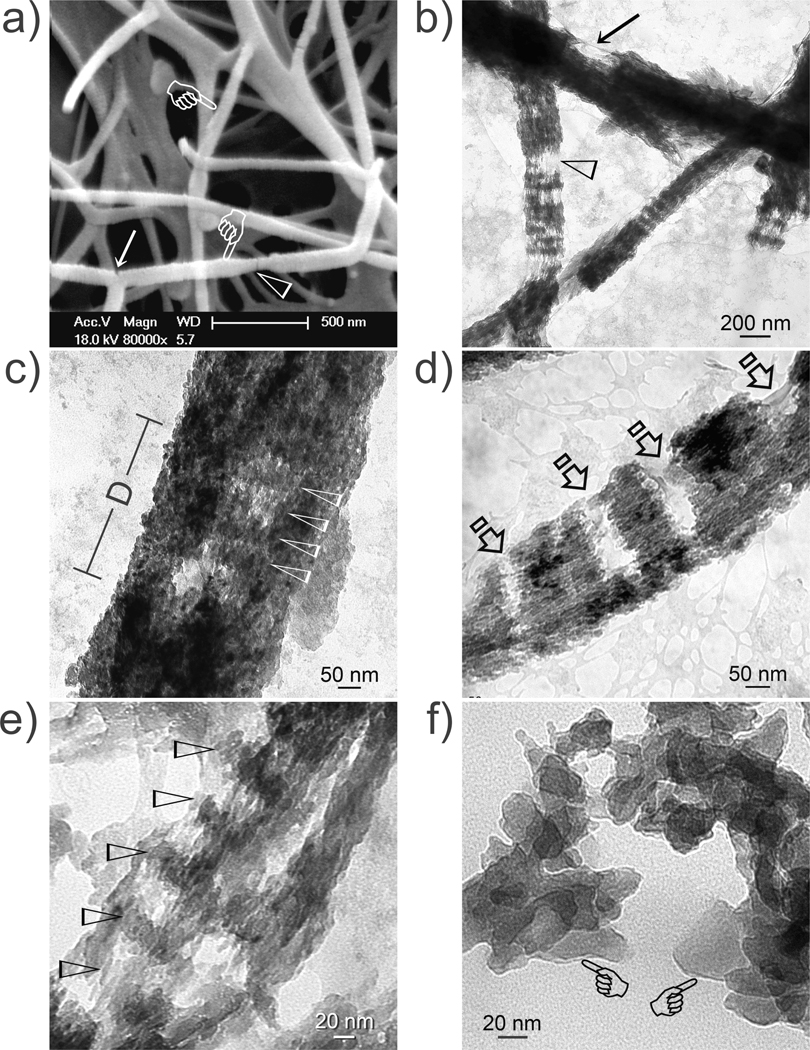
Nanocomposites created with polycarboxylic acid alone as a stabilization agent for prenucleation clusters-derived amorphous calcium phosphate exhibit non-periodic apatite deposition. In the present study, we report the use of inorganic polyphosphate as a biomimetic analog of matrix phosphoprotein for directing polyacrylic acid-stabilized amorphous nanoprecursor phases to assemble into periodic apatite-collagen nanocomposites. The sorption and desorption characteristics of sodium tripolyphosphate to type I collagen was examined. Periodic nanocomposite assembly with collagen as a template was demonstrated with TEM and SEM using a Portland cement-based resin composite and a phosphate-containing simulated body fluid. Apatite was detected within the collagen at 24 hours and became more distinct at 48 hours, with prenucleation clusters attaching to the collagen fibril surface during the initial infiltration stage. Apatite-collagen nanocomposites at 72 hours were heavily mineralized with periodically-arranged intrafibrillar apatite platelets. Defect-containing nanocomposites caused by desorption of TPP from collagen fibrils were observed in regions lacking the inorganic phase.
Keywords: biomimetic synthesis, organic-inorganic nanocomposites, mesophases, polyanions, physisorption
Introduction
Biomimetic synthesis of inorganic-organic composites using functionalized templates has been explored extensively using mesoscale self-assembly approaches.1–3 Apatite inorganic-organic nanocomposites have been produced using synthetic and natural templates such as block-copolymers, polymer nanoparticles, polyelectrolytes, hydrogels, peptide amphiphiles and fibers.4–10 To qualify as a genuine biocomposite, the inorganic phase should be dispersed within the organic phase and not simply precipitate over its surface.11–12 As the amorphous precursor strategy appears to be a common motif in biomineralization,13–15 amorphous calcium phosphate precursors stabilized by polycarboxylic acids at the mesoscopic scale have been used to create apatite-collagen nanocomposite using a liquid precursor mechanism.6,16 This strategy elegantly demonstrated that intrafibillar apatite assembly 16–18 is controlled by charged sites within a collagen fibril,18,19 which results in alignment of the inorganic phase along the fibril’s longitudinal axis. However, mineral nucleation is not site-specific 17 and does not reproduce the coherently aligned apatite arrangement in natural mineralized tissues.20
Polyphosphates are important in biomineralization due to their high affinity for divalent ions.21 Sodium tripolyphosphate (TPP) is used in food processing for chemical phosphorylation or crosslinking of proteins and polysaccharides. Whereas chemical phosphorylation is performed at high temperatures,22 ionic crosslinking of polymers with multiple amine groups may be achieved with polyanionic TPP at ambient temperature.23 Thus, we hypothesize that inorganic polyphosphate binds to fibrillar collagen and direct amorphous calcium phosphate precursors to assemble into periodic apatite-collagen nanocomposites. We have previously shown that periodic biomineralization of collagen may be achieved using TPP as an analog of matrix phosphoproteins.24 The objectives of this work were to investigate the binding characteristics of TPP to reconstituted collagen, to understand how mineral phases are deposited within TPP-treated collagen during the initial stage of biomineralization and to examine the effect of TPP treatment time on the quality of apatite-collagen nanocomposites.
Experimental Section
Adsorption/desorption of TPP
Type I beads derived from bovine skin (SphereCol, Advanced BioMatrix, San Diego, CA, USA; 100–400 µm in diameter) were dialyzed against deionized water for 24 h to remove ions from the phosphate buffered saline and lyophilized. Sorption experiments were performed by mixing 50 mg of lyophilized collagen beads with 1 mL of sodium tripolyphosphate solution (TPP; Na3P3O9, Mw 367.9, Sigma-Aldrich, St. Louis, MO, USA) for 5 min or 1 h at 37°C. Sixteen TPP concentrations were used (0, 0.003, 0.005, 0.014, 0.027, 0.041, 0.054, 0.068, 0.082, 0.109, 0.136, 0.163, 0.190, 0.217, 0.245 and 0.272, in moles/L) with each solution adjusted to pH 7.4. Desorption was performed using 250 mM NaCl for 1 h. Experiments were conducted in triplicate. Reaction mixtures were centrifuged to retrieve the supernatants. The phosphate content in each supernatant was deduced using the ammonium molybdate assay by analysis of the colored phosphomolybdate complex at 820 nm using a 96-well plate spectrophotometer.25 Unreacted ligand concentrations in the supernatants were estimated using a regression equation derived from known TPP concentrations. The amount of bound ligand was calculated by subtracting the amount of TPP in the supernatant from the amount of free ligand in the original solutions. Polynomial regression was used to model the relationship of the sorption and desorption isotherms for statistical analysis using the Wald test.
Simultaneous tests of linear contrasts were used to compare model coefficients for pairwise comparisons of the sorption/desorption isotherms. A Bonferroni adjustment was used to control the overall error rate for appropriately defined “families” of tests. The maximum TPP uptake (Bmax) was estimated based on the fitted curve and the interpolation method was used to estimate the TPP concentration K½ that would yield an uptake of Bmax/2. (K½ is therefore the concentration of TPP required to half-saturate each binding substrate.) Since Bmax is the maximum binding capacity on the y axis, Bmax/2 represents half-saturation. Extrapolation of Bmax/2 to the fitted curve and its 95% confidence bands permits determination of the corresponding TPP concentration and an approximate 95% confidence interval by drawing vertical lines to intersect the x-axis (TPP concentration). This facilitates comparisons of the concentration of TPP required to half-saturate the collagen matrix within the confines of the parameter being investigated. For each isotherm, the approximate 95% confidence interval for K½ was used to derive an approximate standard error for K½. The Wald test with a Bonferroni adjustment was used to compare K½ values of the isotherms using those approximate standard errors. Two-tailed tests with a significance level of 0.05 were used for all statistical comparisons, except where the Bonferroni adjustment was applied.
Scatchard plots of the sorption data were generated by plotting bound/free TPP as the ordinate and bound TPP as the abscissa. Regression analysis was used to obtain the best fit of the data points for each time period. The slope of the regression lines was used to determine the optimal concentration for ionic crosslinking of TPP with collagen for the two time periods.
Fourier Transform–Infrared Spectroscopy (FT-IR)
Fourier transform-infrared spectroscopy was used to identify the effect of time on the deterioration of TPP sorption on collagen at its optimal binding concentration. A Nicolet 6700 FT-IR spectrometer (Thermo Scientific Inc., Waltham, MA, USA) with attenuated total reflection was used to collect spectra from TPP, dried collagen beads, sorption of 0.245 M TPP on collagen after 1 h, as well as competitive desorption with 250 mM for various time periods (10 min to 120 h). Sorption and desorption experiments were performed on dried TPP-doped collagen beads that were re-suspended three times in deionized water and lyophilized to remove loose TPP precipitates from solution. Spectra were collected between 4,000-500 cm−1 at 4 cm−1 resolution using 32 scans and normalized to the collagen amide I band (1,715−1,596 cm−1).
Collagen mineralization
A single layer collagen mineralization model26 was employed to examine mineralization at the second level of the structural hierarchy of mineralized bone.27 With this model, mineralized collagen fibrils are thin enough to be examined by transmission electron microscopy (TEM) without resorting to ultramicrotomy. Formvar-and-carbon-coated 400-mesh Ni grids (Electron Microscopy Sciences, Hatfield, PA, USA) were placed over a 0.15 mg/mL collagen/acetic solution prepared from bovine skin-derived type I (Sigma-Aldrich). Self-assembly of collagen fibrils was achieved by increasing the pH of the collagen solution by ammoniac diffusion (final pH 8.0). The reconstituted collagen fibrils were cross-linked with 0.3 M 1-ethyl-3-(3-dimethylaminopropyl)-carbodiimide (EDC) (Thermo Scientific Pierce, Rockford IL, USA) prior to biomimetic mineralization.
Reconstituted collagen-containing grids were treated with 0.245 M TPP (original pH 8.5 adjusted with HCl to pH 7.4) for 1 h, rinsed and air-dried. The grids were floated over a mineralization assembly comprising an experimental Portland cement-based mineralizing composite and a phosphate-containing simulated body fluid (SBF). The composite contained 45 wt% set Portland cement powder and 5 wt% fumed silica dispersed in a dimethacrylate resin matrix for sustained release of Ca2+ and OH− ions.26 The equilibrium Ca2+ concentration in the system was 7.57×10⁻⁵ moles/L. The OH− ions increased the pH of the system to facilitate direct transformation of ACP to apatite at pH > 9.25 without going through an octacalcium phosphate intermediate phase.28 The SBF contained (in mM) 205.2 NaCl, 6.3 NaHCO3, 4.5 KCl, 1.5 K2HPO4·3H2O, 2.25 MgCl2·6H2O, 3.75 CaCl2 and 0.75 Na2SO4, with 3.08 NaN3 added to prevent bacterial growth.29 To simulate the effect of non-collagenous proteins on collagen mineralization,30 polyacrylic acid (PAA; Mw 1800, 0.28 mM, Sigma-Aldrich) was included in the SBF as a nucleation inhibitor for ACP stabilization.31 The controls consisted of 1) mineralization of collagen without TPP treatment in SBF only (without PAA), 2) mineralization of TPP-treated collagen in SBF only, and 3) mineralization of collagen without TPP treatment in PAA-containing SBF for the same time periods. The grids were incubated for 4–24 h, 48 h and 72 h in a 100% humidity chamber. After retrieval, each grid was examined unstained with a JEM-1230 TEM (JEOL, Tokyo, Japan) at 110 kV. Selected area electron diffraction (SAED) was performed on regions of interest. Representative specimens were stained with 0.5% uranyl acetate for 15 sec to identify the relation between collagen staining patterns and the initial stages of ACP infiltration and apatite transformation. Additional collagen-containing grids that were mineralized for 72 h using a 5 min TPP binding time were also examined without staining.
Mineralization of reconstituted collagen was repeated for scanning electron microscopy (SEM) with the exception that a 3 mg/mL collagen stock solution was employed to create a thicker 3-D collagen matrix. For SEM, the collagen matrices were deposited over poly(lysine)-coated glass cover slips. After mineralization, the cover slips were freeze-dried, coated with gold-palladium and examined with a field emission SEM (XL-30 FEG; Philips, Eindhoven, The Netherlands) at 12–18 kV. Mineralized collagen from additional uncoated cover slips was removed after air-drying for FT-IR evaluation and compared with IR spectra generated from commercially available hydroxyapatite (Sigma-Aldrich). For X-ray diffraction (XRD), the mineralized collagen matrices were pulverized in liquid nitrogen after removal from uncoated cover slips and desiccated with anhydrous calcium sulphate (Drierite, W.A. Hammond, Xenia, OH, USA). Additional pulverized mineralized collagen matrices were sintered in air to 1000°C. Both non-sintered and sintered powder were analyzed with an X-ray diffractometer (Rigaku America, Woodlands, TX, USA) using Ni-filtered Cu Kα radiation (30 KeV, 20 mA), in the 2θ range of 3°–60°, with a scan rate of 4°/min, and a sampling interval of 0.02°.
Results and Discussion
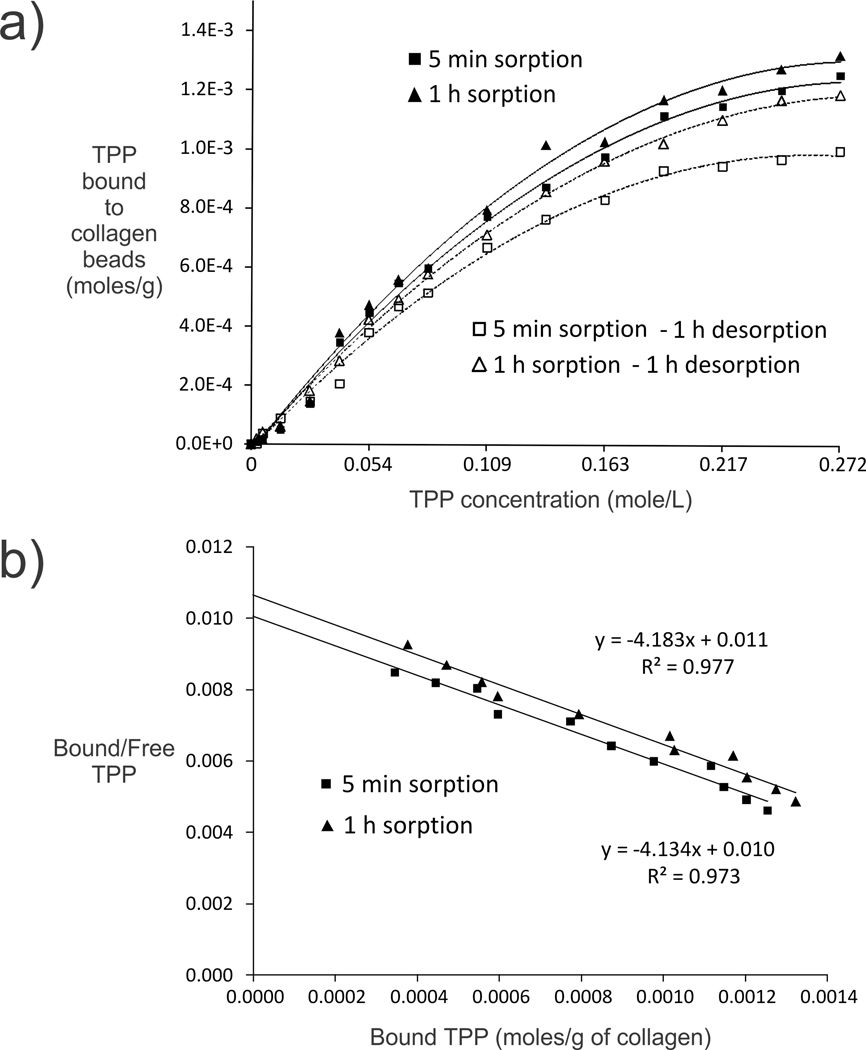
We examined the sorption and desorption characteristics of TPP (pH 7.4) to type I collagen for 5 min or 1 h, followed by desorption with 250 mM NaCl for 1 h (Figure 1). Quadratic models provided an excellent fit for the relationship between TPP concentration and TPP present in the collagen matrix in each isotherm, with highly significant omnibus F-tests (p < 0.0001) and large adjusted R2 values (R2 > 0.993) for each model.
Figure 1.
a) Sorption and desforption isotherms obtained from treating type I collagen beads with different TPP concentrations. b) Scatchard plots of the sorption data yield linear plots from which the optimal binding concentration is derived for each time period.
Statistical analysis of the model coefficients obtained for the four isotherms using the omnibus F test showed a significant difference among the isotherms in the linear term [F(3,52) = 6.17, p = 0.0011] but not in the quadratic term [F(3,52) = 0.75, p = 0.5251]. Pairwise comparisons of model coefficients using a Bonferroni-adjusted significance level of 0.05/4 = 0.0125 yielded a significant difference in the linear term only between the 5 min sorption and the 5 min desorption isotherms [F(1,52) = 10.65, p = 0.0019].
Table 1 contains the details of the estimation of K½ for the four isotherms. The K½ for the 5 min sorption isotherm differed significantly from the K½ for 5 min desorption isotherm (z = 2.61, p = 0.009). No other comparisons of K½ values between groups were statistically significant at the Bonferroni-adjusted level of 0.0125.
Table 1.
Estimates of K½ for TPP bound to type I collagen
| Group | Bmax | Bmax/2 | Estimate of K½ |
95% confidence interval K½) |
Approximated standard error |
|---|---|---|---|---|---|
| 5 min sorption | 1.235 × 10⁻³ | 6.175 × 10⁻⁴ | 3.13 | 2.98 – 3.28 | 0.077 |
| 1 h sorption | 1.304 × 10⁻³ | 6.517 × 10⁻⁴ | 3.10 | 2.93 – 3.28 | 0.087 |
| 5 min desorption | 9.854 × 10⁻⁴ | 4.927 × 10⁻⁴ | 2.86 | 2.72 – 3.00 | 0.069 |
| 1 h desorption | 1.098 × 10⁻³ | 5.490 × 10⁻⁴ | 3.02 | 2.90 – 3.14 | 0.059 |
Scatchard plots of the sorption data yielded straight lines that suggest binding of a homogeneous ligand to a single class of independent sites,32 with the optimal TPP concentration for 1 h binding being 0.242 M (for convenience, 0.245 M was used). Based on these results, TPP treatment of collagen for 1 h was used for subsequent experiments.
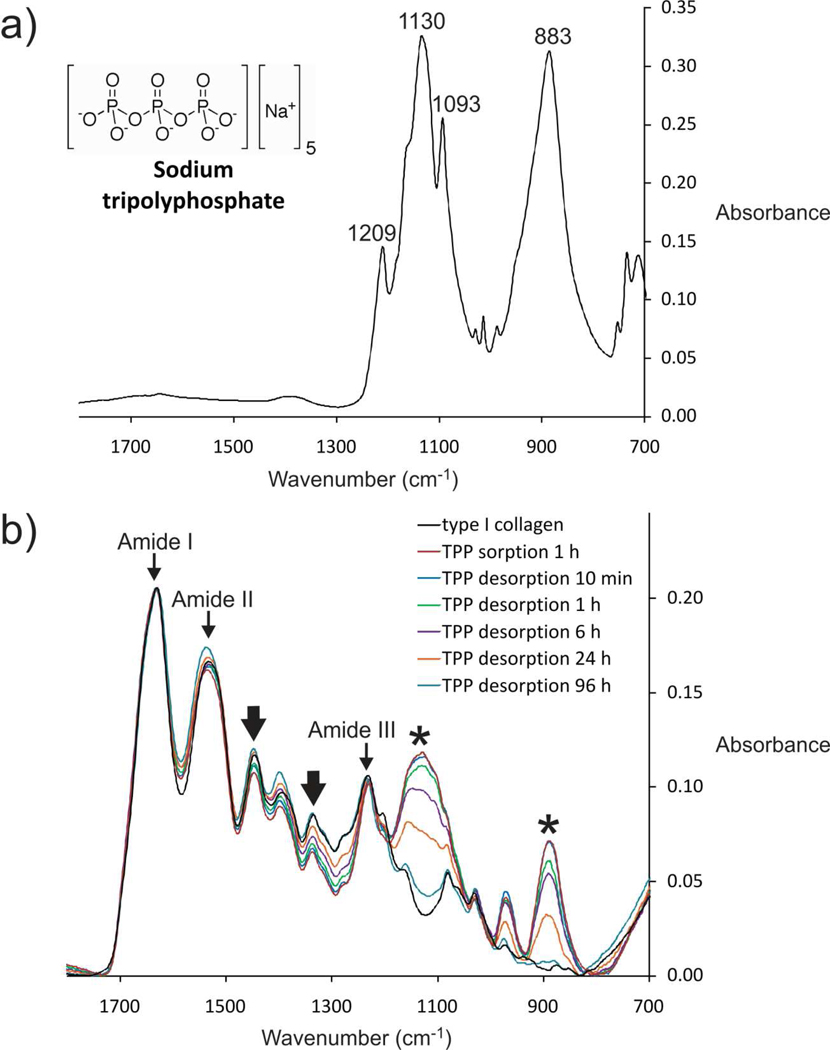
The kinetics of TPP desorption was further examined with Fourier transform-infrared spectroscopy (Figure 2). Infrared spectra of TPP demonstrated characteristic phosphate peaks at 1209 cm−1 (P=O stretching), 1130 cm−1 (symmetric and asymmetric stretching vibrations in PO2 group), 1093 cm−1 (symmetric and asymmetric stretching vibrations in PO3 group) and 883 cm−1 (asymmetric stretching of the P-O-P bridge).33 (Figure 2a). Collagen beads treated with 0.245 M TPP and after competitive desorption with 250 mM NaCl for different time periods are shown in Figure 2b. Peaks at ≈ 1650, 1550 and 1250 cm−1 (thin arrows) are assigned to the amide I, II and III bands of type I collagen, respectively.34 Collagen treated with TPP did not produce new peaks apart from those derived from TPP. After 1 h of TPP treatment, phosphate peaks attributed to TPP appeared at ≈ 1130 and 883 cm−1 (asterisks) with reduction in the series of collagen wagging vibration bands between amide II and III (thick arrows). Those bands are assigned to wagging vibrations from the glycine backbone and proline side chains of the collagen molecules.35 Formation of ionic bridges between collagen and polyphosphate anions probably dampens those vibrations. As the desorption time increased from 10 min to 96 h, there was a gradual decrease in the intensity of the TPP-associated peaks and increase in the wagging vibrations of the collagen molecules. After 120 h of competitive desorption, the spectrum was similar to that of untreated collagen (not shown). Of the collagen amino acids with NH2 side chains, histidine (pI 7.6) is deprotonated at pH 7.4 while lysine (pI 9.8) and arginine (pI 10.8) remain positively charged. The results suggest that TPP binds reversibly to collagen via weak ionic crosslinking.
Figure 2.
Infrared spectra of a) TPP b) Collagen beads treated with 0.245 M TPP and after competitive desorption with 250 mM NaCl for different time periods. As the desorption time increased from 10 min to 96 h, there is a gradual decrease in the TPP-associated peaks. After 120 h, the spectrum (not shown) is similar to that of untreated collagen.
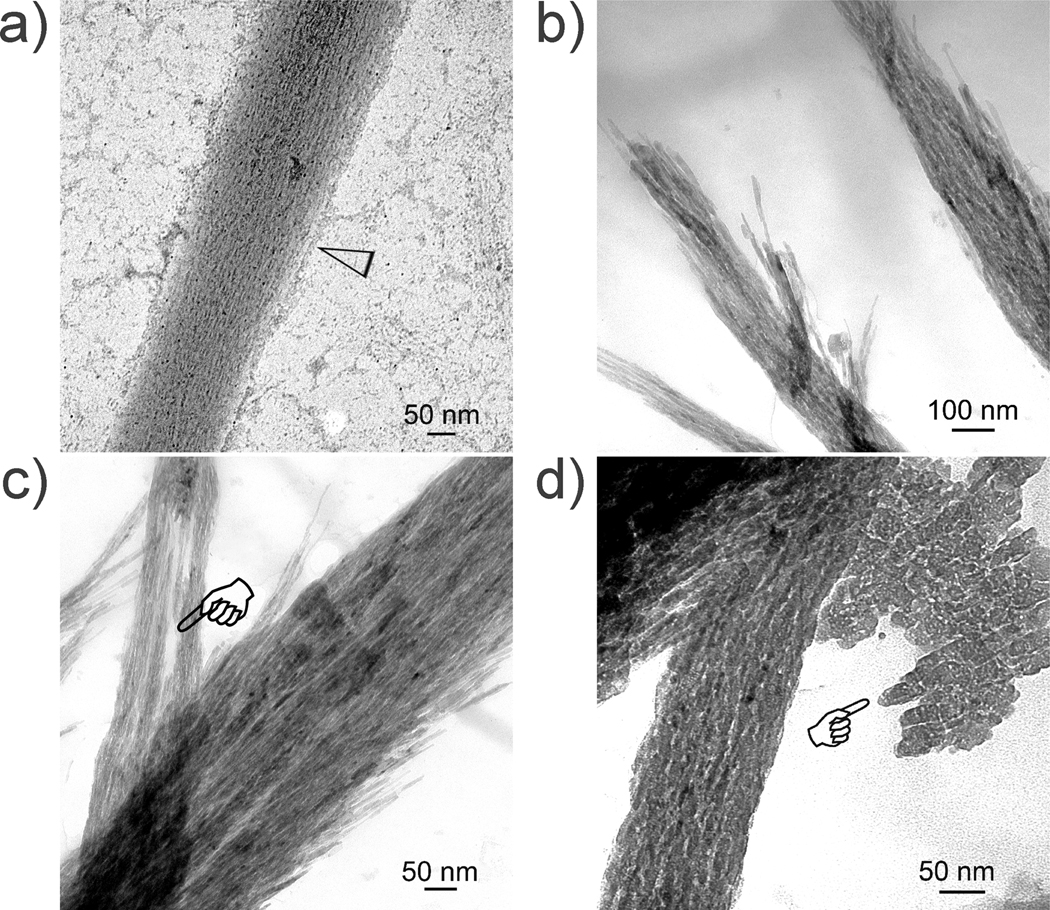
Collagen mineralized without supplements (Supporting Information SI-1) or with TPP treatment only (Supporting Information SI-2) resulted in apatite precipitation in solution or deposition of apatite platelets over the collagen surface, respectively, with no evidence of true nanocomposite formation. Collagen fibrils that were not treated with TPP and mineralized in PAA-containing simulated body fluid exhibit an ACP infiltration stage at 4–24 h with the attachment of calcium phosphate prenucleation clusters13 to the fibril surface. After 48–72 h, non-periodic intrafibrillar mineral deposits could be seen within the fibrils that became increasingly denser with time (Figure 3).
Figure 3.
Unstained TEM images showing different stages of non-periodic mineral assembly after reconstituted collagen was mineralized in simulated body fluid containing polyacrylic acid as a stabilization agent for amorphous calcium phosphate precursors. a) Initial mineralization at 24 h with calcium phosphate prenucleation clusters (open arrowhead) attaching to the fibril’s surface. b) Low magnification of the intrafibrillar deposits at 48 h. c) High magnification of the intrafibrillar deposits at 48 h showing strand-like intrafibrillar deposits. A region devoid of mineral deposition could be seen in one of the fibrils (pointer). d) Most of the fibrils at 72 h became heavily mineralized, with concomitant extrafibrillar mineralization observed in spaces between the mineralized fibrils. A less heavily mineralized fibril along the mineralization front is shown, showing non-periodic mineral deposition. Plate-like extrafibrillar crystals could be seen adjacent to the mineralized fibril (pointer).
Mineralization of TPP-treated collagen in the presence of PAA exhibits a similar initial ACP infiltration stage (Supporting Information SI-3) at 4–24 h that is characterized for the attraction of PAA-stabilized calcium phosphate prenucleation clusters to the fibril surface (Supporting Information SI-4). After infiltration of these prenucleation clusters, fibrils contained an amorphous mineral phase that resisted dehydration shrinkage. Electron-dense nucleation sites appeared in unstained fibrils (Supporting Information SI-5) and produced vague banding patterns resembling those created with anionic stains.36 Comparison of the infrared spectrum of mineralized nanocomposites (3 mg/mL) with that generated from a hydroxyapatite reference confirmed that the minerals formed in the inorganic-organic nanocomposites were apatite (Supporting Information SI-6). X-ray diffraction of both non-sintered and sintered specimens also confirmed that the calcium phosphate phase after 72 h of mineralization was apatite and not octacalcium phosphate (Supporting Information SI-7). Collagen has been assumed to act a passive scaffold for apatite nucleation via interactions with non-collagenous proteins.37 The alternative hypothesis that collagen actively controls mineralization19 was substantiated via attraction of negatively charged polyanion-stabilized prenucleation clusters into positively charged regions of the collagen fibril.18 As mineralization in the present study was conducted under high pH (ca. 9.5–10),26 the paucity of positively charged amino acids on the collagen surface argues against the role of collagen alone as the sole mechanism for oriented apatite nucleation within collagen. While the function of collagen as a structural template for mediating ACP infiltration into collagen and for inducing oriented apatite nucleation along the longitudinal axis of the collagen fibril are undeniable, other controlling agents such as noncollagenous proteins or their analogs may be required for the periodic apatite nucleation along the fiber’s lateral dimension. Although polyaspartic acid has been employed in many studies for stabilization of ACPs,6,7,17,18 infiltration of polyacrylic acid-stabilized ACPs into collagen could also be achieved without TPP in a high pH environment, producing non-periodically mineralized nanocomposites.24 With the adjunctive use of polyvinylphosphonic acid, sodium trimetaphosphate or TPP as analogs of matrix phosphoproteins, mineralized collagen fibrils with periodic intrafibrillar apatite deposition were produced. Although the TPP employed in the present study is similar to the function of sodium trimetaphosphate, it does not require pre-hydrolysis at pH 10.5–12 to convert the cyclic trimetaphosphate into the linear tripolyphosphate.
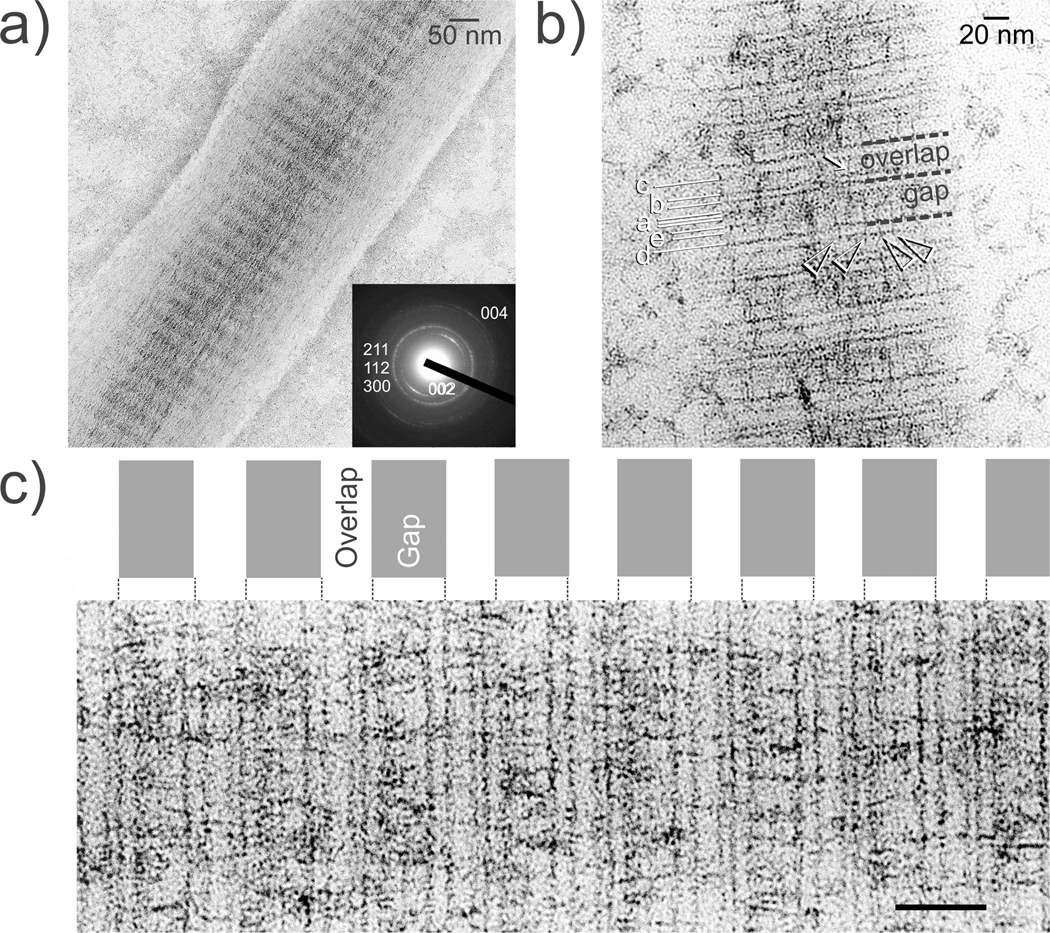
Apatite was detected within the collagen at 24 h and became more distinct after 48 h (Figure 4). The mineralized collagen fibrils demonstrated faint arc-shaped patterns with their [002] and [004] planes perpendicular to the fibril’s longitudinal axis. During the initial stage of apatite assembly, uranyl acetate stained nanocomposites revealed two specific mineralization sites that were associated with the stained bands, with more crystallites deposited in the gap zone than the overlap zone. Unstained nanocomposites at 72 h were heavily mineralized with intrafibrillar apatite platelets that reproduced the periodic cross-banding of native mineralized collagen (Figure 5). This site-specific mineralization pattern differs from the non-site-specific pattern obtained when collagen was mineralized at neutral pH with polyanion-stabilized ACP only.18 Ionic crosslinking with TPP renders the collagen fibril anionic. Primary and secondary mineralization sites have been reported in polyanionic collagen prepared by selective hydrolysis of arginine and glutamine to create additional carboxyl groups within the fibril.38 Tripolyphosphate exists predominantly as P3O105− (pK5 = 8.9)39 at pH 9.5–10 and may chelate Ca2+ from the infiltrated ACP to produce complexes that initiate apatite nucleation and growth within the gap and overlap zones. Alternatively, the anionic TPP may inhibit the progression of mineral growth into the overlap zones, which would lead to observation of periodic distribution of the intrafibrillar minerals in the present study.
Figure 4.
TEM of the early stage of periodic apatite assembly. a) Unstained collagen fibril with cross-banding created via mineral deposition. Inset: Selected area electron diffraction reveals faint diffraction patterns of poorly-crystalline apatite. b) Uranyl acetate-stained fibril at 24 h. Stained bands a–e are labeled according to Reference (36). More apatite is deposited in the gap zone (arrowheads) than the overlap zone (arrow). C) Stained fibril at 48 h showing denser aggregation of apatite along the gap zones. Bar = 50 nm.
Figure 5.
a) SEM and b–f) unstained TEM of the late stage of periodic apatite assembly at 72 h. a) Fractured mineralized collagen fibrils (pointers). b) Grid space with mineralized fibrils. Arrow: mineralized carbon film. Arrowhead: non-mineralized fibrils. c) Mineralized fibrils above or below the cross-banded mineralized fibrils reveal fibril peripheries without cross-banding. d) Mineralized fibril with mineral platelets (arrow) oriented along the fibril’s long axis (double arrowhead) to produce a cross-banding pattern (arrowheads). e) Selected area electron diffraction of d) shows arc-shaped diffractions patterns of apatite with their [002] and [004] planes perpendicular to the fibril’s longitudinal axis. f) Fractured fibril showing intrafibrillar apatite platelets (arrowheads).
When collagen was treated with TPP for 5 min, defect-containing nanocomposites were formed with regions lacking the inorganic phase (Figure 6). We speculate that this is caused by TPP desorption from the collagen fibrils. These defective regions provide additional information on the deposition of apatite platelets in the gap and overlap zones as the 67 nm repeat in the fibril is gradually obscured with increasing mineral deposition.37 Juxtaposition of heavily mineralized regions between organic phase-rich regions indicates that mineralization process can be discontinuous within a fibril. This highlights the role played by site orientation molecules such as matrix phosphoproteins or their analogs in orchestrating apatite nucleation and growth after a collagen template is filled with ACP. The nanomechanical properties of nanocomposites with non-site specific vs. site-specific mineralization characteristics also warrant further studies. This is because nanocomposites with a similar volume fraction of non-site-specific, axially-oriented apatite or periodically-aligned apatite may have comparable stiffness but different responses to deformation.40 Apatite-collagen nanocomposites have application as bone fillers or implant coatings and their potential may be enhanced by incorporating recombinant arginine-glycine-aspartic acid (RGD) peptides or growth factors to improve osteoblast adhesion and stimulate bone regeneration.
Figure 6.
a) SEM and b–f) unstained TEM of defective collagen-apatite nanocomposites when collagen is treated with TPP for 5 min. a) Defect along fibril surface (arrow) and a region with dehydration shrinkage in the absence of supporting minerals (arrowhead). b) A defect viewed from the side (arrow) and incomplete apatite deposition (open arrowhead). c) A defect (D) enables cross-banding to be seen within the subsurface (arrowheads) of a mineralized fibril. d) Regional mineralization of a fibril. Arrows: non-mineralized regions. e) Rotated fibril showing stacks of apatite platelets in the gap zones (arrowheads). f) Dissolution of the fibril’s organic phase with 6.7 mM NaOCl exposes the inorganic phase (pointers). Platelets are piled in a 3-D manner so that those at the back appear smaller than those in front.
Conclusion
Type I collagen is employed as template to produce an inorganic-organic nanocomposite assembly. Periodic mineralization may be achieved when sodium tripolyphosphate is used as a site-directing molecule and PAA as a nucleation inhibitor for ACP stabilization. Conversely, collagen mineralized with PAA-stabilized ACP in the absence of TPP treatment resulted only in non-periodic mineralization. Collagen mineralized without supplements or with TPP treatment only results in apatite precipitation in solution or deposition of apatite platelets over the collagen surface, respectively, with no evidence of true nanocomposite formation.
Supplementary Material
Acknowledgments
This work was supported by grant R21 DE019213 from NIDCR (PI. Franklin Tay) and the PSRP and ESA awards from the Georgia Health Sciences University. We thank Jongryul Kim for specimen preparation for scanning electron microscopy.
Footnotes
Supporting Information Available. TEM images, XRD and ATR-FTIR spectra of collagen-apatite assembly. This information is available free of charge via the Internet at http://pubs.acs.org/.
References
- 1.Antonietti M, Ozin GA. Chem. Eur. J. 2004;10:28–41. doi: 10.1002/chem.200305009. [DOI] [PubMed] [Google Scholar]
- 2.Xu AW, Ma YR, Cölfen H. J. Mater. Chem. 2007;17:415–419. [Google Scholar]
- 3.Mann S. Nat. Mater. 2009;8:781–792. doi: 10.1038/nmat2496. [DOI] [PubMed] [Google Scholar]
- 4.Antonietti M, Breulmann M, Göltner CG, Cölfen H, Wong KKW, Walsh D, Mann S. Chem. Eur. J. 1998;4:2493–2500. [Google Scholar]
- 5.Shchukin DG, Sukhorukov GB, Möhwald H. Chem. Mater. 2003;15:3947–3950. [Google Scholar]
- 6.Olszta MJ, Cheng X, Jee SS, Kumar R, Kim YY, Kaufman MJ, Douglas EP, Gower LB. Mater. Sci. Eng. R. 2007;58:77–116. [Google Scholar]
- 7.Deshpande AS, Beniash E. Cryst. Growth Des. 2008;8:3084–3090. doi: 10.1021/cg800252f. [DOI] [PMC free article] [PubMed] [Google Scholar]
- 8.Palmer LC, Newcomb CJ, Kaltz SR, Spoerke ED, Stupp SI. Chem. Rev. 2008;109:4754–4763. doi: 10.1021/cr8004422. [DOI] [PMC free article] [PubMed] [Google Scholar]
- 9.Ethirajan A, Ziener U, Landfester L. Chem. Mater. 2009;21:2218–2225. [Google Scholar]
- 10.He T, Abbineni G, Cao B, Mao C. Small. 2010;6:2230–2235. doi: 10.1002/smll.201001108. [DOI] [PMC free article] [PubMed] [Google Scholar]
- 11.Gupta HS, Seto J, Wagermaier W, Zaslansky P, Boesecke P, Fratzl P. Proc. Natl. Acad. Sci. U. S. A. 2006;103:17741–17746. doi: 10.1073/pnas.0604237103. [DOI] [PMC free article] [PubMed] [Google Scholar]
- 12.Mahony O, Tsigkou O, Ionescu C, Minelli C, Ling L, Hanly R, Smith ME, Stevens MM, Jones JR. Adv. Func. Mater. 2010;20:3835–3845. [Google Scholar]
- 13.Weiner S, Sagi I, Addadi L. Science. 2005;309:1027–1028. doi: 10.1126/science.1114920. [DOI] [PubMed] [Google Scholar]
- 14.Cölfen H. Nat. Mater. 2010;9:960–961. doi: 10.1038/nmat2911. [DOI] [PubMed] [Google Scholar]
- 15.Dey A, Bomans PH, Müller FA, Will J, Frederik PM, de With G, Sommerdijk NA. Nat. Mater. 2010;9:1010–1014. doi: 10.1038/nmat2900. [DOI] [PubMed] [Google Scholar]
- 16.Gower LB. Chem. Rev. 2008;108:4551–4627. doi: 10.1021/cr800443h. [DOI] [PMC free article] [PubMed] [Google Scholar]
- 17.Nassif N, Gobeaux F, Seto J, Belamie E, Davidson P, Panine P, Mosser G, Fratzl P, Giraud-Guille MM. Chem. Mater. 2010;22:3307–3309. [Google Scholar]
- 18.Nudelman F, Pieterse K, George A, Bomans PH, Friedrich H, Brylka LJ, Hilbers PA, de With G, Sommerdijk NA. Nat. Mater. 2010;9:1004–1009. doi: 10.1038/nmat2875. [DOI] [PMC free article] [PubMed] [Google Scholar]
- 19.Landis WL, Silver FH, Freeman JW. J. Mater. Chem. 2006;16:1495–1503. [Google Scholar]
- 20.Traub W, Arad T, Weiner S. Proc. Natl. Acad. Sci. U. S. A. 1989;86:9822–9826. doi: 10.1073/pnas.86.24.9822. [DOI] [PMC free article] [PubMed] [Google Scholar]
- 21.Omelon SJ, Grynpas MD. Chem. Rev. 2008;108:4694–4715. doi: 10.1021/cr0782527. [DOI] [PubMed] [Google Scholar]
- 22.Deetae P, Shobsngob S, Varanyanond W, Chinachoti P, Naivikul O, Varavinit S. Carbohyd. Polym. 2008;73:341–358. [Google Scholar]
- 23.Mi F, Sung H, Shyu S, Su C, Peng C. Polymer. 2003;44:6521–6530. [Google Scholar]
- 24.Liu Y, Kim YK, Dai L, Li N, Khan SO, Pashley DH, Tay FR. Biomaterials. 2011;32:1291–1300. doi: 10.1016/j.biomaterials.2010.10.018. [DOI] [PMC free article] [PubMed] [Google Scholar]
- 25.Chen PS, Toribara TY, Warner H. Anal. Chem. 1956;28:1756–1758. [Google Scholar]
- 26.Kim YK, Gu LS, Bryan TE, Kim JR, Chen L, Liu Y, Yoon JC, Breschi L, Pashley DH, Tay FR. Biomaterials. 2010;31:6618–6627. doi: 10.1016/j.biomaterials.2010.04.060. [DOI] [PMC free article] [PubMed] [Google Scholar]
- 27.Weiner S, Traub W. FASEB J. 1992;6:879–885. [PubMed] [Google Scholar]
- 28.Meyer JL, Eanes ED. Calcif. Tissue Res. 1978;25:209–216. doi: 10.1007/BF02010771. [DOI] [PubMed] [Google Scholar]
- 29.Kukubo T, Kushitani H, Sakka S, Kitsugi T, Yamamuro T. J. Biomed. Mater. Res. 1990;24:721–734. doi: 10.1002/jbm.820240607. [DOI] [PubMed] [Google Scholar]
- 30.George A, Ravindran S. Nano Today. 2010;5:254–266. doi: 10.1016/j.nantod.2010.05.005. [DOI] [PMC free article] [PubMed] [Google Scholar]
- 31.Tay FR, Pashley DH. Biomaterials. 2008;29:1127–1137. doi: 10.1016/j.biomaterials.2007.11.001. [DOI] [PubMed] [Google Scholar]
- 32.Mendel CM, Licko V, Kane JP. J. Biol. Chem. 1985;260:3451–3455. [PubMed] [Google Scholar]
- 33.Corbridge DEC, Lowe EJ. J. Chem. Soc. 1954:493–502. [Google Scholar]
- 34.Habermehl J, Skopinska J, Boccafoschi F, Sionkowska A, Kaczmarek H, Laroche G, Mantovani D. Macromol. Biosci. 2005;5:821–828. doi: 10.1002/mabi.200500102. [DOI] [PubMed] [Google Scholar]
- 35.Radev L, Hristov V, Samuneva B, Ivanova D. Cent. Eur. J. Chem. 2009;7:711–720. [Google Scholar]
- 36.Meek KM, Chapman JA, Harcastle RA. J. Biol. Chem. 1979;254:10710–10714. [PubMed] [Google Scholar]
- 37.Glimcher MJ. Anat. Rec. 1989;224:139–153. doi: 10.1002/ar.1092240205. [DOI] [PubMed] [Google Scholar]
- 38.Goissis G, Maginador SVS, Martins VCA. Artif. Organs. 2003;27:437–443. doi: 10.1046/j.1525-1594.2003.07252.x. [DOI] [PubMed] [Google Scholar]
- 39.Rasković P. Energy. 2007;32:983–998. [Google Scholar]
- 40.Jäger I, Fratzl P. Biophys. J. 2000;79:1737–1746. doi: 10.1016/S0006-3495(00)76426-5. [DOI] [PMC free article] [PubMed] [Google Scholar]
Associated Data
This section collects any data citations, data availability statements, or supplementary materials included in this article.


