

Abstract
All primates regularly move within three-dimensional arboreal environments and must often climb, but little is known about the energetic costs of this critical activity. Limited previous work on the energetics of incline locomotion suggests that there may be differential selective pressures for large compared to small primates in choosing to exploit a complex arboreal environment. Necessary metabolic and gait data have never been collected to examine this possibility and biomechanical mechanisms that might explain size-based differences in the cost of arboreal movement. Energetics and kinematics were collected for five species of primate during climbing and horizontal locomotion. Subjects moved on a treadmill with a narrow vertical substrate and one with a narrow horizontal substrate at their maximum sustainable speed for 10–20 min while oxygen consumption was monitored. Data during climbing were compared to those during horizontal locomotion and across size. Results show that climbing energetic costs were similar to horizontal costs for small primates (<0.5 kg) but were nearly double for larger species. Spatio-temporal gait characteristics suggest that the relationship between the cost of locomotion and the rate of force production changes between the two locomotor modes. Thus, the main determinants of climbing costs are fundamentally different from those during horizontal locomotion. These new results combining spatiotemporal and energetic data confirm and expand on our previous argument (Hanna et al.: Science 320 (2008) 898) that similar costs of horizontal and vertical locomotion in small primates facilitated the successful occupation of a fine-branch arboreal milieu by the earliest primates.
Keywords: climbing energetics, locomotor evolution, Loris tardigradus, Nycticebus pygmaeus, Cheirogaleus medius, Saimiri boliviensis, Eulemur mongoz, horizontal energetics
All nonhuman primates, even those typically thought of as “terrestrial,” like baboons and patas monkeys, sleep, eat, and escape predators in the trees. Living in this three-dimensional environment requires that all primates regularly climb, often doing so on vertical supports. Climbing must have been an important aspect of early primates exploitation of an arboreal niche and so it has been argued that many fundamental primate morphological features and locomotor patterns are associated with climbing (Jones, 1916; Le Gros Clark, 1950; Stern, 1976; Fleagle et al., 1981; Szalay and Dagosto, 1988; Gebo, 1996; Larson, 1998a; Hamrick, 2001; Bloch and Boyer, 2002; Hanna, 2006; Gebo et al., 2008). In reference to the earliest primates, Larson (1998a; p 170) points out that “morphological changes enhancing limb mobility [in primates]… have been pivotal in the development of the locomotor versatility-including various forms of climbing, scrambling, and bridging behaviors-that has come to characterize arboreal primates.” In later stages of primate evolutionary history, it is thought that some of the morphological changes related to climbing, such as long limbs and mobile joints, facilitated the evolution of more specialized locomotor behaviors, including suspensory locomotion and bipedality (Washburn, 1968; Conroy and Fleagle, 1972; Stern and Oxnard, 1973; Fleagle, 1976; Cartmill and Milton, 1977; Yamazaki et al., 1979; Prost, 1980; Fleagle et al., 1981; Stern and Susman, 1981; Vangor and Wells, 1983; Hirasaki et al., 1992, 1993, 1995, 2000; Larson, 1998b; Schmitt, 1998, 1999, 2003a; Richmond et al., 2001). Thus, understanding climbing is essential for understanding not only extant primate ecology, but also primate morphology and primate locomotor evolution.
The link between climbing and aspects of primate anatomy has been reinforced recently by studies showing primates that climb with a relatively high frequency have morphological specializations that facilitate specific locomotor patterns, which may in turn enhance the efficiency of vertical climbing. Morphologically specialized primates such as Asian apes, spider monkeys, and lorises exhibit longer strides than more generalized species (e.g., Hirasaki et al., 1992, 1993, 2000; Isler, 2005; Hanna, 2006). These long strides are hypothesized to be energetically advantageous during climbing (Isler, 2005; Hanna, 2006), suggesting that climbing energetics may be a key source of data for understanding climbing adaptations and the selective pressures driving anatomy and locomotor biomechanics.
In addition to exploring the link between climbing and skeletal mechanics, understanding climbing energetics also provides an exceptional case for understanding how energy and work are related in muscles. The major energetic cost of locomotion is believed to be directly related to the amount of force produced by the muscles to move the body (Fenn, 1930; Cavagna, 1964; McMahon, 1975; Alexander, 1977; Cavagna and Kaneko, 1977; Cavagna et al., 1977). During horizontal locomotion little force is produced to accomplish work in moving the center of mass vertically. This is not the case during vertical climbing, however, in which force is generated to produce net positive external work to lift the center of mass. Thus, there should be distinct differences in the relationship between energy and work during horizontal compared to vertical locomotion. Understanding the differences in the relationship between work and energy consumption in primates during various modes of locomotion provides insight into the types of selective pressures that are involved in the evolution of early primate musculoskeletal morphology.
Previous works on the energetics of primate locomotion in general are limited, and there are few data on the basic costs of climbing in primates. A seminal paper on the scaling costs of incline locomotion by Taylor et al. (1972) using mass-specific cost measures suggests that the extra cost to go uphill, over that of moving horizontally, is constant between a chimpanzee and a mouse. That is, in their study increased body mass did not increase the mass-specific cost of moving uphill. This relationship supports the idea that it costs the same amount of energy to lift 1 kg 1 m, no matter what the body size of the organism (Hill, 1950; Taylor et al., 1972; Aiello, 1992; Elton et al., 1998). On the other hand Taylor also reported that the mass-specific cost of moving horizontally is much lower in the chimpanzee than the mouse, suggesting that mass does influence locomotor costs when the work environment is more complex as is the case during horizontal locomotion. Therefore the relative cost of moving uphill is greater for the chimpanzee than for the mouse. Subsequent work examining this notion that it is relatively more expensive (compared to the horizontal cost) for large animals to go up than for small animals has been supported during incline walking by insects (Full and Tullis, 1990; Lipp et al., 2005). These insect studies indicate that larger insects (e.g., cockroaches) incur a greater cost over that of horizontal locomotion than smaller insects (e.g., ants, which exhibit no significant difference between the cost of horizontal and incline locomotion) during incline locomotion. Clearly the data that exist so far suggest an increased cost for moving uphill for larger animals. But this is still a relatively small dataset and range of animals, and these studies do not examine purely vertical motion.
Primates provide an ideal model for filling this gap by examining the cost of actual climbing (as opposed to incline walking) and whether body size affects those costs. Primates exhibit a wide range of body masses, spanning several orders of magnitude. Additionally from the smallest 30-g mouse lemur to the large 150-kg orangutan, all nonhuman primates regularly climb, such that a functionally important scaling relationship between energetics and body mass during climbing can be determined. Unfortunately, few data exist on what the costs of climbing up a vertical support are, or how they scale, in non-human primates. Nor have any studies provided a dataset combining gait mechanics and energetic costs to examine the source of any size-based variation. In 2008, Hanna et al. did provide data on climbing by primates, showing that at small sizes the cost of climbing may not be much higher than walking. However, that paper was brief and included few details on the allometric relationships and no data on gait mechanics in the sample. The latter data are critical to understanding why small primates may differ from larger primates and other animals in experiencing no increase in cost of climbing compared to horizontal locomotion.
In contrast to the limited data on the costs of vertical climbing, there are more data available on the cost of horizontal locomotion by primates. In 1982, Taylor et al. compiled data on the cost of mass-specific horizontal locomotion from the literature for six species of primates, and directly gathered data for three more species. Taylor et al. (1982) used these data to calculate an equation to estimate the cost of horizontal transport for primates, showing that like other mammals, the cost of transport decreases with increasing body mass. Since then, few other studies have presented data on the cost of horizontal quadrupedalism for nonhuman primates. Nakatsukasa et al. (2004) published data for an additional species of primate, the Japanese macaque (Macaca fuscata), Sockol et al. (2007) provided additional data on the energy cost of chimpanzee quadrupedalism, Hanna et al. (2008) provided data on five additional species of primate during horizontal quadrupedalism on a simulated arboreal substrate, and O'Neill (2008) did an in depth study of Lemur catta metabolism during walking and running. All the data from these studies fit nicely into the regression calculated by Taylor et al. and provide more evidence to show that the mass-specific cost of horizontal locomotion in primates decreases with increasing body mass.
More recent studies have sought to explain the energy costs of locomotion in terms of kinematics and muscle function (e.g., Kram and Taylor, 1990; Roberts et al., 1998a,b; Pontzer, 2007; O'Neill, 2008). During horizontal locomotion, Kram and Taylor (1990) found that step length is inversely proportional to cost of transport such that longer step lengths are correlated with a decrease in cost of transport. Pontzer (2007) expanded on this model to include a measure of limb posture, finding that effective limb length as an indicator of step length may also be used to estimate the cost of horizontal locomotion. Both models suggest that energy consumption by muscles is the driving factor for the cost of horizontal locomotion, an idea developed by Taylor et al. (1982), elaborated on by Roberts et al. (1998a,b), and further supported by O'Neill (2008). Both step length and joint posture differences have already been reported between lemur and loris species during climbing (Hanna, 2006). Such differences in the kinematics of climbing between species may provide insight into how muscles are functioning during vertical locomotion and provide insight into the metabolic cost of climbing in primates.
Studies of climbing or inclined locomotion are aimed at understanding the relationship between energy consumption by muscles and work done by muscles in moving the center of mass vertically. During horizontal locomotion, however, there is no net vertical movement of the center of mass (the center of mass oscillates vertically but returns to the same vertical position at the end of each stride). Thus, the relationship between muscle energy use and work is obscured, and it is suggested that the work performed on the center of mass during horizontal locomotion is not the driving factor behind energy use. Rather, it is the rate at which muscles produce force that is thought to be the primary determinant of the energy cost of horizontal locomotion (Cavagna and Kaneko, 1977; Heglund et al., 1982; Kram and Taylor, 1990; Willems et al., 1995; but see Donelan et al., 2002; Collins et al., 2005; Ruina et al., 2005; Pontzer, 2007 for alternate views). There is, however, positive vertical work accomplished in lifting the center of mass during climbing, such that the primary determinant of the energy cost of climbing may be related to the magnitude of force production rather than limited to the rate of force production. Thus, climbing energetics, unlike horizontal energetics, may provide more insight into the relationship between muscle force generation and metabolic power input.
The goals of this study are three fold. First, this study seeks to understand the scaling relationship between the energetic cost of climbing and body mass in primates. Next, this study seeks to understand how the climbing costs and scaling relationship of these costs to body mass compare to the horizontal energy cost and body mass scaling in the same species. These first two goals have been briefly touched on by Hanna et al. (2008) and are presented here in greater detail. But the larger question of how the kinematics of climbing may relate to the energy costs of climbing and how this relates to muscle recruitment are addressed here for the first time as goal number three.
MATERIALS AND METHODS
Sample
To understand the energetics of climbing across primates, a taxonomically and ecologically diverse sample of species was selected for study. Subjects included four species from the Duke Lemur Center (DLC) and one species from the Center for Neotropical Primate Research and Resources at the University of South Alabama (CNPRRUSA):1 1) Loris tardigradus (DLC), 2) Cheirogaleus medius (DLC), 3) Nycticebus pygmaeus (DLC), 4) Saimiri boliviensis (CNPRR-USA), and 5) Eulemur mongoz (DLC). This sample spanned an eight-fold range in body mass (Table 1). All subjects were fully adult, healthy, and kept in semi-natural enclosures which allowed them to regularly move in a three-dimensional environment. All procedures were approved by the respective institutional animal care and use committees (IACUCs) (DUIACUC and USAIACUC).
TABLE 1.
Sample size (i.e., number of experiments during which valid data were collected) for climbing metabolic rate (MR), cost of transport (COT), and speed ranges utilized during climbing, for each individual and species (body mass in kilograms)
| Species | Climbing MR (N) | COTclimb (N) | Speedclimb max-min (m s−1) | Horizontal MR (N) | COThoriz (N) | Speedhoriz max-min (m s−1) |
|---|---|---|---|---|---|---|
| L. tardigradus | 16 | 12 | 0.114–0.041 | 8 | 8 | 0.092–0.045 |
| A (0.157) | 7 | 5 | 0.081–0.041 | 2 | 6 | 0.076–0.060 |
| B (0.172) | 4 | 2 | 0.072–0.071 | NA | NA | NA |
| C (0.171) | 5 | 5 | 0.114–0.068 | 6 | 2 | 0.092–0.045 |
| C. medius | 18 | 16 | 0.112–0.042 | 14 | 13 | 0.114–0.043 |
| A (0.241) | 6 | 4 | 0.076–0.042 | 5 | 5 | 0.072–0.047 |
| B (0.276) | 4 | 4 | 0.111–0.076 | 4 | 4 | 0.071–0.043 |
| C (0.260) | 8 | 8 | 0.112–0.049 | 5 | 4 | 0.114–0.053 |
| N. pygmaeus | 9 | 9 | 0.079–0.047 | 8 | 8 | 0.076–0.049 |
| A (0.447) | 5 | 5 | 0.079–0.053 | 4 | 4 | 0.076–0.060 |
| B (0.492) | 4 | 4 | 0.067–0.047 | 4 | 4 | 0.073–0.049 |
| S. boliviensis | 8 | 8 | 0.213–0.152 | 4 | 4 | 0.334–0.231 |
| A (0.744) | 4 | 4 | 0.188–0.152 | NA | NA | NA |
| B (0.821) | 4 | 4 | 0.213–0.158 | 4 | 4 | 0.334–0.231 |
| E. mongoz | 9 | 9 | 0.157–0.110 | 4 | 4 | 0.160–0.140 |
| A (1.340) | 2 | 2 | 0.151–0.135 | 4 | 4 | 0.160–0.140 |
| B (1.346) | 5 | 5 | 0.157–0.110 | NA | NA | NA |
| C (1.460) | 2 | 2 | 0.123–0.117 | NA | NA | NA |
Experimental apparatus
Individuals were habituated to climb at their maximum sustainable speed on a motor-driven, treadmill for 15–30 min (Fig. 1). The treadmill consisted of two pulleys around which a thick rubber tube (hereafter referred to as “substrate”) was strung. The pulleys were situated so that the substrate was vertical. Each pulley was attached to a shaft, on the other end of which was a timing belt system. The timing belt system was driven by a timing belt such that each shaft and pulley apparatus moved at the same speed to avoid substrate slippage. The lower shaft and pulley apparatus was attached to a variable-speed DC motor.
Fig. 1.
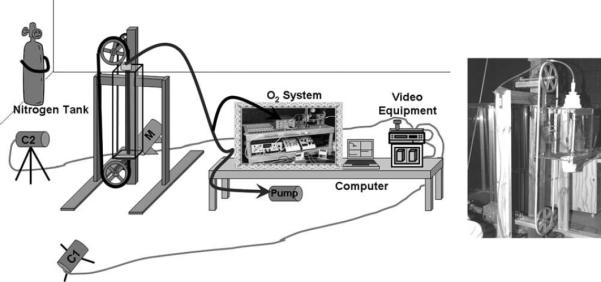
A schematic of the setup with a treadmill and oxygen analysis system. O2 system indicates the oxygen analysis electronics. Air was drawn through the metabolic chamber, out the top past the subject's head, and into the oxygen analysis system. The oxygen analysis equipment fed data into the laptop computer. During the trial the four channels are displayed on the laptop screen while data are being recorded. M indicates the variable speed motor used to run the treadmill, and C1 and C2 indicate the video cameras. Video equipment consisted of, from top to bottom, a video mixer, a VCR, and a TV. Video data were fed into the mixer such that the two views were displayed side by side on the TV. Data from the mixer were fed into the VCR, and then from the VCR into the TV to ensure the image on the TV was the exact same as that being recorded. Photo shows a L. tardigradus climbing in the metabolic chamber.
The diameter of the substrate varied across species because it is believed that substrate size may affect locomotor mechanics (Isler, 2004; Schmitt and Hanna, 2004), and thus, potentially locomotor energetics. Substrates were selected on the basis of species' size: L. tardigradus, C. medius, and N. pygmaeus climbed on a substrate of 1.12-cm diameter, while S. boliviensis and E. mongoz utilized a 2-cm diameter substrate. These substrate diameters correspond to preferred substrate size in the wild for most of the species (Charles-Dominique, 1974; Fleagle and Mittermeier, 1980; Hunt et al., 1996; Botz et al., 2003; Schmitt 2003b; Stevens, 2008).
A section of the substrate on which the subjects climbed in place was enclosed in a metabolic chamber (Fig. 1). It is worth noting that the subjects stayed in place in this experiment and thus no net work was done on the center of mass. However, as the substrate rotated downward, the animals climbed in place and resisted downward motion, thus doing internal work to maintain the center of mass position. In so doing they incurred metabolic costs. Moreover, subjects in this study used similar postures and gait patterns as reported for free climbing by Hanna (2006). We still describe our data as “climbing” or “horizontal” values because the animals use the same postures and gait parameters they use during free climbing or horizontal walking (Hanna, 2006) and we assume that the cost of transporting the center of mass is constant across body size (the theoretical cost of transporting the center of mass vertically would be 9.8 J kg−1 m−1). We do not add in this value to our data, however, since we have no comparable theoretical value to add to the horizontal data.
The height of this chamber was adjusted to the stride of each species to ensure steady locomotion. Each chamber had a hole in the top and bottom of it through which the substrate ran. These holes were packed with insulative filters to reduce air leakage. Two additional holes, outfitted with PVC drain covers, were located at the top and the bottom of each chamber. The holes allowed air to be drawn through the chamber. The top hole was attached, via an air hose, to a standard open-flow calorimetry system (Sable Systems®; Las Vegas, NV), consisting of a personal computer for O2 concentration data collection and analysis software (Datacan V, Sable Systems, Las Vegas, NV), an oxygen analyzer, digital flow-meters, and desiccants for both water and CO2.
Video recording and analysis
All climbing sequences were video-recorded for speed and spatio-temporal gait analysis using one or two video cameras. The locomotor experiments were videotaped using different methods and equipment for the nocturnal species (Loris, Nycticebus, and Cheirogaleus) compared to the diurnal species (Eulemur, Saimiri). For two of the nocturnal species (Loris and Cheirogaleus), one analog camera (AG-450; Panasonic, Secaucus, NJ) recorded video images at 60 frames per sec under infrared lights. Shutter speed for this camera was set at 1/1,000 of a second. The camera was set lateral to the substrate within the chamber. For Nycticebus, two synchronized cameras were used (AG-450; Panasonic, Secaucus, NJ, and a digital infrared security camera, CCTV style), both filming at 60 frames per sec with infrared lights. The Panasonic camera was set at a shutter speed of 1/1,000 of a second. Both cameras were set up perpendicular to each other. For the diurnal strepsirhine species, two synchronized video cameras were used (HD-D5100; Panasonic, Secaucus, NJ) at 60 frames per sec with shutter speeds of 1/1,000 of a second. Only one of these cameras could be used for Saimiri due to the size of the room. Professional quality lights were focused on the treadmill chamber. Both cameras were set up perpendicular to the substrate and to each other. In all cases, the video images were passed through a video mixer (Videonics; Focus Enhancements; Campbell, CA). When two cameras were used, both images were mixed during the experiment with a video effects editor so that they were displayed side by side on one screen. Speed of the substrate was used to measure climbing speed. Substrate speed was determined with a stopwatch six to ten times throughout an experiment, at equal intervals. The substrate was marked with a piece of tape to aid in this process. Using the time for one complete rotation of the substrate (from marker to marker), and the length of the substrate, speed was determined in meters per second. The exact same system and methods were used to collect data on horizontal locomotion. The only difference is that the treadmill was rotated 908 counterclockwise so that the movement of the substrate was parallel to the ground. Like the climbing data, these represent the first data ever data collected on metabolic costs of multiple species of primates during locomotion on relatively narrow substrates.
Step length
Using frame-by frame playback on a VCR of the video recordings of each experiment (an oxygen consumption recording experiment lasting on average 20 min), 30 values for contact time were collected (measured as frames in which the limb is in contact with substrate and converted to seconds). Those data were compiled to produce one value for average contact time per experiment for comparison with the metabolic data. This value was determined for the left hindlimb, only, as the hindlimbs provide the greatest contribution to propulsion during both horizontal locomotion (Kimura et al., 1979; Demes et al., 1994) and climbing (Hirasaki et al., 1993; Hanna and Schmitt, in press). The number of frames the hind-foot was in contact with the substrate during a stride was counted in order to determine contact time for ten strides in a row. This value was then divided by 60 (because the filming rate was 60 f s−1) to yield the contact time in seconds. This process of collecting ten strides for contact time analysis was repeated three times, at even intervals throughout the middle of the oxygen plateau period, yielding three independent sets of ten contact time values. The average of these values was calculated. Following determination of contact time, step length was calculated according to Kram and Taylor (1990), where step length (Lc) equals the product of speed and contact time (tc).
Open-flow respirometry
Oxygen content of the air was monitored and recorded using O2 software (Datacan V, Sable Systems, Las Vegas, NV). Prior to air entering the oxygen analyzer, CO2 and water vapor were removed with desiccants. In addition, the main flow rate through the chamber was monitored and recorded. The sampling frequency for recording data was 2 Hz. Before and after each climbing session, a baselining procedure described by Lipp et al. (2005) was performed. Oxygen consumption rate was calculated using the initial equation from Withers (1977) modifying it to include a nitrogen calibration (Fedak et al., 1981) and applying a correction for slight differences in flow rate between animal experiment and nitrogen calibration.
Withers (1977) presented the following equation:
| (1) |
where is the main flow rate out of the chamber or mask (STP), FIO2 is the fractional concentration of O2 entering the mask, F′EO2 is the fractional concentration of O2 leaving the mask after CO2 has been removed, and RQ is the respiratory quotient. The respiratory quotient is a ratio of the amount of carbon dioxide produced to the amount of oxygen consumed, and is a good indicator of which fuels are being metabolized (e.g., proteins, fats, or carbohydrates), (Brooks et al., 1996).
Fedak et al. (1981) improved upon Withers' (1977) calculation using a nitrogen calibration technique that corrects for the drying of water vapor and removal of carbon dioxide from the sample prior to gas analysis. They also assumed that FIO2 is equal to 0.2094, FIO2 − F′EO2 is equal to 0.01, and RQ is ~1. These assumptions yield the following equation:
| (2) |
In this equation, “ΔC and ΔC* refer to the deflection of the analyzer during measurement and calibration, respectively” (Fedak et al., 1981, 776). Using this equation yields a maximum error of 9% (maximum of 8% error for animal produced water vapor and maximum of 1% RQ related error) (Fedak et al., 1981). This study uses a modified version of the Fedak equation that takes into account the actual change in oxygen concentration after drying and removal of carbon dioxide (instead of assuming it is 0.01) and accounts for error caused by differences in flow rate between animal experiment and calibration:
| (3) |
In Eq. (3), is the oxygen consumption rate in L min−1, is the flow rate of the nitrogen during the nitrogen dilution, in L min−1, RQ is the respiration quotient, Δ C is the change in oxygen concentration during an animal experiment in percentage, Δ C* is the change in oxygen concentration during an animal experiment in percentage, is the main flow rate through the chamber during a nitrogen experiment on L min−1, and is the main flow rate through the chamber during an animal experiment in L min−1. Equation (3) still has the possibility of yielding 9% error, although this is unlikely as the 8% error caused by animal produced water-vapor would only occur if the animal saturated the air stream when it was 40°C (Fedak et al., 1981). The term in the equation used for this study was added to Fedak et al.'s (1981) equation in order to more accurately estimate oxygen consumption. Fedak et al.'s (1981) equation does not require that the main flow rate exiting the chamber be monitored because they assume that . However, if this is not the case and the two flow rates differ, even minutely, then error is introduced. The error caused by differences in main flow rate between animal experiment and nitrogen calibration would cause changes in the deflection of oxygen content, ΔC or ΔC*. ΔC/ΔC* accounts for differences in oxygen deflection due to differences in flow rates, although these differences may not be linear. Thus, by adding this additional flow rate ratio term, the equation used to calculate oxygen consumption in this study yields greater accuracy. Finally, because RQ is typically between 0.7 and 1.0 during walking and running, the respiration quotient was held constant at 0.8 (Griffin et al., 2004).
After calculating the oxygen consumption rate based on these parameters, it was converted to metabolic rate assuming a conversion factor of 20.1 J ml−1O2 (Brooks et al., 1996):
| (4) |
where MR is in J s−1 and is in L min−1. When appropriate, mass-specific metabolic rate was calculated as MR/Mb, where Mb is body mass in kg.
Mass-specific cost of transport (COT) was also calculated using the observed speed for each experiment. That is:
| (5) |
where COT is the cost of transport in J kg−1 m−1, Mb is body mass in kilograms, and V is speed in m s−1.
Experimental protocol
The habituation period for each subject lasted between three weeks and three months. During this period, subjects were encouraged to climb (or move horizontally on) the substrate treadmill with food rewards given through the top hole of the metabolic chamber. The habituation period was considered over when a subject could climb the substrate at their maximum sustainable speed for 15–30 min. After the habituation period, each individual performed at least two valid oxygen consumption trials (Table 1). Trials in which the individual got off the substrate for more than 10 s, or got off the substrate more than five times, were discarded. Food rewards were still offered, although these rewards never exceeded 10% of their regular diet (by mass). Only one climbing (or horizontal) session per day per individual was permitted.
Data treatment
Initially, intraspecific variation in cost of transport and speed were examined using Mann Whitney U or Kruskal Wallis, depending on the number of subjects in each species. These nonparametric tests were used because of the small sample for each individual. Significance levels were adjusted for multiple comparisons using a sequential Bonferroni adjustment (Rice, 1989). Where warranted, species means and standard deviations were calculated for each variable from the two or three individual means. Data grouped by species were tested for normality by graphical methods, and all passed. Thus, further analyses were calculated using parametric tests.
First, the log of metabolic rate during climbing was examined against speed using least-squares linear regression (Sokal and Rohlf, 1995) for each species to determine whether speed affected the metabolic cost of locomotion, as it has been found during horizontal locomotion (Taylor et al., 1982). Log-log regressions of the cost of locomotion (and efficiency) versus body mass have been presented elsewhere (Hanna et al., 2008). That study found that the mass-specific cost of transport did not decrease with body mass during climbing, but neither did the mass-specific cost of horizontal locomotion, at least significantly. Because it is well known that the mass-specific cost of horizontal transport does significantly decrease with body mass (Taylor et al., 1982; Alexander, 2003; Steudel-Numbers, 2003), Hanna et al.'s analysis of their horizontal data was likely impacted by a small interspecific sample (n = 5). To accommodate this statistical problem, intraspecific comparisons of the cost of transport between locomotor modes were calculated in this study, instead.
Cost coefficient
During horizontal locomotion, it has been found that the energy used by muscles is proportional to the total volume of muscle is active, but is inversely proportional to contact time (e.g., Kram and Taylor, 1990; Roberts et al., 1998; Griffin et al., 2003; McGowan et al., 2006). It is well accepted that the mass-specific active muscle volume is the same in both large and small mammals (Alexander et al., 1981; Biewener, 1990; Kram and Taylor, 1990; Roberts et al., 1998a), such that muscle shortening velocity (as measured by contact time or step length) is one of the major determinants of horizontal locomotor cost. This relationship is often described by the equation:
| (6) |
where MR is the metabolic rate in J m−1, Wb is the body weight in N and Lc is the step length (m). In this equation, the “cost coefficient,” c (J N−1), expresses the relationship between body-weight-specific energy cost and the rate of force generation. We examined this relationship during horizontal locomotion and climbing to determine whether there is a proportional relationship during climbing. A linear regression of kinematic variables relative to speed was calculated, including the cost coefficient described by Kram and Taylor (1990).
RESULTS
Metabolic results
A total of 60 climbing experiments and 38 horizontal locomotion experiments satisfied the criteria listed above. Table 1 indicates the number of valid climbing and horizontal experiments for each subject, and the speed range utilized by each subject and species. Intra-specific variation in speed and cost of transport was negligible; thus, future analyses grouped data for all subjects of a species together. Speed was not significantly correlated with metabolic rate in any species except L. tardigradus (Table 2). Based on the narrow speed ranges used by each species (Table 1), this correlation was ignored in further analyses
TABLE 2.
Pearson product-moment correlation coefficients and significance values of oxygen consumption rate (ml O2 kg−1 s−1) compared to speed (m s−1)
| Species | Pearson product-momentclimb | Significance valuesclimb | Pearson product-momenthoriz | Significance valueshoriz |
|---|---|---|---|---|
| L. tardigradus | 0.71 | 0.01 | 0.933 | 0.001 |
| C. medius | 0.391 | 0.134 | 0.366 | 0.242 |
| N. pygmaeus | −0.08 | 0.838 | 0.737 | 0.037 |
| S. boliviensis | 0.434 | 0.283 | 0.948 | 0.051 |
| E. mongoz | 0.548 | 0.126 | 0.070 | 0.930 |
Bold values indicate significance at an alpha level of equal to or less than 0.05, after sequential Bonferroni adjustment.
As indicated by Hanna et al. (2008), the cost of climbing is statistically constant relative to the decrease in the cost of horizontal transport compared to body mass (−0.119 and −0.750, respectively) (Fig. 2, Table 3). The slopes of these costs of transport compared to body mass, however, are not significant. It is well known that the cost of transport during horizontal locomotion decreases significantly with body mass in primates (Taylor et al., 1982; Alexander, 2003; Steudel-Numbers, 2003). Thus, the interspecific analysis presented here and by Hanna et al. (2008) may be limited due to the small sample size (n = 5 species). Future studies should expand this sample and include more anthropoids.
Fig. 2.
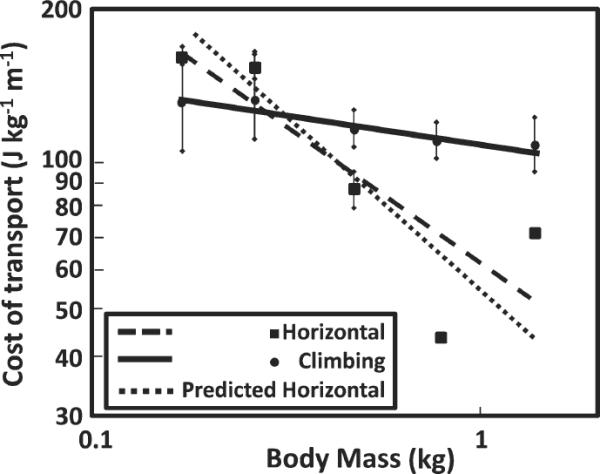
Graph of the cost of transport compared to body mass during horizontal locomotion and during climbing. The regression equation best describing COThoriz is COTHoriz = 51.5Mb −0.750 (r = 0.843; P = 0.073); the regression equation best describing the cost of climbing is COTclimb = 107.4Mb −0.119 (r = 0.858; P = 0.063) (Hanna et al., 2008). Note that neither slope is significant, probably due to the small sample size. The predicted COThoriz line of best fit was added in for comparison purposes. The predicted COThoriz was calculated for each individual using the equation: VO2/Mb = 0.300Mb −0.303 + 0.533Mb −0.316 V, from Taylor et al. (1982). Speeds and body mass were those observed in this study. Note that the actual COThoriz line of best fit is very similar to the predicted COThoriz.
TABLE 3.
Mean cost of transport for climbing compared to horizontal locomotion (J kg−1 m−1), by species, ±1 standard deviation (SD)
| Species | COTclimb (±SD) | COThoriz (±SD) | COT ratioa | T-test probabilityb |
|---|---|---|---|---|
| L. tardigradus | 131.64 (26.17) | 159.79 (0.37) | 1 (0.82) | 0.125 |
| C. medius | 134.97 (26.99) | 156.23 (8.31) | 1 (0.86) | 0.2989 |
| N. pygmaeus | 110.48 (9.48) | 86.94 (7.60) | 1 (1.27) | 0.019 |
| S. boliviensis | 104.60 (8.28) | 43.81 (15.12)c | 2.39 | 0.001 |
| E. mongoz | 109.10 (14.08) | 71.17 (9.97)c | 1.27 | 0.001 |
COT ratio is COTclimb/COThoriz. Ratio is indicated as 1 if the t-test was not significant, although the calculated ratio is given in parentheses.
Bold values indicate significance after sequential Bonferroni adjustment. Degrees of freedom were based on the number of subjects for each species.
Data were collected for only one subject during horizontal locomotion. Thus the standard deviation and degrees of freedom are calculated based on the number of experiments for that subject.
The comparison of the intraspecific cost of transport across locomotor modes showed that the difference in cost between vertical and horizontal locomotion increases with body mass (Table 3). Within species, primates larger than 0.5 kg exhibit a significant difference between the cost of climbing and the cost of horizontal locomotion, with climbing being more expensive. On the other hand primates smaller than 0.5 kg exhibit statistically equivalent costs of climbing and horizontal locomotion.
Spatio-temporal characteristics
There were no significant contact time or step length differences between locomotor modes in each species, although most species tended to use longer contact times during climbing (Table 4). Additionally, during horizontal locomotion the relationship between step length and body mass increases with a slope of ~0.25 (Fig. 3), similar to the slope of 0.30 found by Kram and Taylor (1990). During climbing, however, the slope of this relationship is 0.047 (Fig. 3). This relationship between step length and body mass is not significant during horizontal locomotion or during climbing.
TABLE 4.
Comparison of mean contact time (in seconds) and step length (in meters) for each species during horizontal locomotion and during climbing
| Species | Contact timehoriz (±SD) | Contact timeclimb (±SD) | T-test probabilitya | Step lengthhoriz (±SD) | Step lengthclimb (±SD) | T-test probabilitya |
|---|---|---|---|---|---|---|
| L. tardigradus | 1.687 (0.253) | 1.841 (0.172) | 0.5787 | 0.112 (0.025) | 0.136 (0.035) | 0.5471 |
| C. medius | 0.835 (0.024) | 1.228 (0.295) | 0.1497 | 0.052 (0.007) | 0.090 (0.010) | 0.0564 |
| N. pygmaeus | 1.661 (0.275) | 1.714 (0.278) | 0.8657 | 0.110 (0.026) | 0.096 (0.007) | 0.3194 |
| S. boliviensis | 0.593 (NA)b | 0.615 (0.132) | NA | 0.172 (NA)b | 0.116 (0.035) | NA |
| E. mongoz | 0.740 (NA)b | 1.028 (0.367) | NA | 0.113 (NA)b | 0.137 (0.052) | NA |
SD indicates 1 standard deviation.
No comparisons were significant after sequential Bonferroni adjustment. Degrees of freedom were based on the number of subjects for each species.
Data were collected for only one subject during horizontal locomotion. Thus the standard deviation and degrees of freedom are calculated based on the number of experiments for that subject.
Fig. 3.
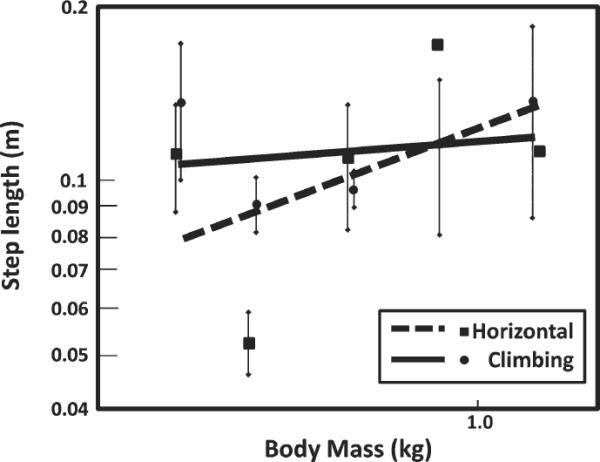
Graph of step length versus body mass during horizontal locomotion and climbing. Each point represents a species mean, and the lines represent ± 1 standard deviation. The data are plotted on log-log axes because Kram and Taylor (1990) found a linear relationship between these two variables when logged. The equation for horizontal locomotion is: log LcHoriz = −0.907 + 0.24 logMb where LcHoriz is step length and Mb is body mass. Although the slope of the line for horizontal locomotion is 0.245, close to the value of 0.30 found by Kram and Taylor (1990), the slope is not significantly different from zero (P 5 0.403). The equation for climbing is: log LcClimb = −0.937 + 0.047 logMb where Lcclimb is step length and Mb is body mass.
Cost coefficient
During both climbing and horizontal locomotion, the cost coefficient is essentially constant across body weight (Fig. 4). The mean cost coefficient during horizontal locomotion is 0.111 J N−1(±0.050 s.d.), slightly less than that found by Kram and Taylor (1990) for a wider range of body masses (mean cost coefficient of 0.183 J N−1). During climbing, the mean cost coefficient is 0.148 J N–1 (±0.045 s.d.).
Fig. 4.
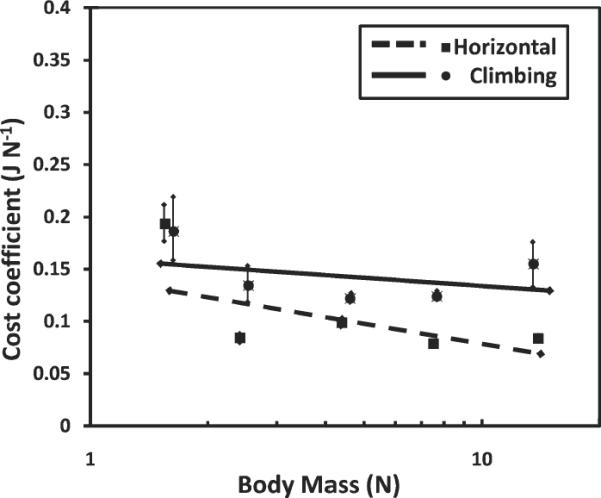
Graph illustrating the constant relationship between the cost coefficient and body mass during horizontal locomotion and climbing. Each box represents a species mean and the bars indicate ± one standard deviation. Notice that the slopes of both comparisons are almost zero (−0.083 and 0.019; horizontal locomotion and climbing, respectively).
Effects of Loris tardigradus
The relationship between oxygen consumption rate and speed for the slender loris deviates from the rest of the sample dramatically (Table 2). Step length and contact time are related to speed, thus we examined these parameters in L. tardigradus. This species exhibits a relatively long step length and long contact time, previously reported by Hanna (2006) for climbing on a rigid pole. These long step lengths and contact times affect additional relationships in this study as well. If L. tardigradus were removed from the analysis of the effect of step length on climbing mechanics and energetics, step length increased regularly with body mass during climbing, but cost of transport still did not. The unusual position of the slender loris relative to other primates and the strong effect of step length on these data, as is discussed further below, highlights a clear relationship between limb length, contact time, muscle volume recruitment, and climbing energetics.
DISCUSSION
The goals of this study were three fold: 1) to test hypotheses about the scaling of the energetic cost of climbing with body mass in nonhuman primates, 2) to examine how this previous relationship compares to the cost of horizontal locomotion in primates, and 3) to examine the potential influence of limb movements (specifically step lengths) on metabolic costs.
It is worth noting, before moving deeper into the discussion, that in this study climbing animals were moving on a rope treadmill, which can influence results and data interpretation (e.g., van Ingen Schenau, 1980; Minetti et al., 1999; di Prampero et al., 2005). While moving on a treadmill, there is no net movement of the center of mass. Thus, no external work was accomplished during these experiments, either on the vertical or horizontal treadmill. On the other hand, the metabolic data collected here represent a measure of the energy cost required to accomplish internal work to maintain the position of the center of mass, and the external work required to move the center of mass relative to the substrate (maintain a steady position against the downward motion of the treadmill) (Minetti et al., 1999). As such, the data collected in this study may represent an underestimate of the true metabolic cost (and total work required) of climbing. This treadmill bias is certainly a very interesting topic and deserves further examination, but is beyond the scope of the current study. The discussion that follows incorporates an understanding of the limitations of treadmill-based studies of locomotion.
The results of this study suggest that: 1) unlike horizontal locomotion, the mass-specific cost of climbing does not consistently decrease with body mass at the same rate, 2) compared to horizontal locomotion, it is more costly for large primates to climb, and finally, 3) there are both theoretical and empirical reasons for arguing that spatio-temporal aspects of climbing help explain some portion of the cost of climbing. All of these are discussed in detail below.
These results support several previous ideas. First, data showing that cost of transport during climbing is constant across body mass (Fig. 2) support the idea that it costs the same amount of energy to lift 1 kg 1 m regardless of the body size of the organism (Hill, 1950; Taylor et al., 1972; Aiello, 1992; Elton et al., 1998). This is an important pattern to recognize and although this relationship has been described before, demonstrating it through studying the energetics of treadmill climbing is still valuable because climbing represents work done without options of energy saving mechanisms often involved in walking and running.
Second, the comparison between climbing and horizontal costs of locomotion support Taylor et al.'s (1972) argument that it is relatively more expensive for large animals to climb compared to smaller animals. The results presented here significantly expand the range of animals for which data are available and provide data during vertical climbing rather than incline locomotion. Finally, the data presented here combine metabolic cost data and data on kinematics. These data lead to new possibilities for further investigation. In this article, relying on theoretical and empirical data during walking (Roberts, 1998a,b) and running (Kram and Taylor, 1990) we raise the possibility that the length of the stride exhibited by primates with a high frequency of climbing in their repertoire has a strong effect on the costs of climbing.
Muscle recruitment volume and costs of climbing
These three conclusions lead to a deeper understanding of primate anatomy, behavioral choices, and locomotor evolution. For example, these data show that during hand-over-hand climbing large primates (and probably other animals as well) do not appear to use energy saving mechanisms, such as elastic energy storage (Alexander, 1977, 1980) or inverted-pendulum mechanics (Cavagna et al., 1977), that are available when moving horizontally. These mechanisms reduce muscular work needed to accelerate and decelerate the center of mass of larger animals. This is a factor that leads to a decreasing cost of horizontal locomotion (Fig. 2). Since these mechanisms are unavailable during vertical climbing, those costs are size invariant. Thus, it is very expensive (both absolutely, and relative to the horizontal cost of locomotion) for large primates to climb in a hand over hand manner compared to small primates. This pattern serves as a possible explanation for the observation that larger primates tend to spend more time moving on terrestrial supports compared to smaller primates (Table 1 in Gebo, 1996).
In addition to potentially climbing less often, large primates often use other forms of locomotion to ascend. Orthograde suspensory locomotion (Hunt et al., 1996), certain forms of which may take advantage of pendulum mechanics and potentially conserve energy (Parson and Taylor, 1977; Bertram et al., 1999; Chang et al., 1997, 2000), can be used to ascend. Additionally, pulse climbing (Hunt et al., 1996), is commonly used by cercopithecids (Hunt, 1992; DeSilva, 2008) and may offer elastic energy savings to primates that utilize it.
The constant energy consumption across body mass in primates reported in this study raises interesting questions that relate to gait characteristics and muscle volume recruitment. The consideration of how stride time and muscle volume recruitment effect climbing costs is based on theoretical and empirical work collected on nonprimate mammals. Several lines of evidence lead us to argue that muscle volume recruitment will change with size and substrate orientation. For example, during incline locomotion, and presumably climbing, some studies have found that the rate of force production is increased relative to that during horizontal locomotion (Roberts et al., 1997; Wickler et al., 2005). The rate of force production is influenced in part by step length or contact time. On the other hand, other studies have found that shortening velocities decrease between horizontal and incline locomotion (McGuigan et al., 2009) and others have found that contraction velocity does not increase even under loaded conditions (McGowan et al., 2006). Therefore, since contact time was not significantly different between horizontal locomotion and climbing in each species in this study, it is possible that contraction velocities are not increased during climbing (although there is a definite trend toward increased contact time in the smaller species). However, it is well accepted that muscles increase work production during incline locomotion compared to horizontal locomotion (Roberts et al., 1997; Daley and Biewener, 2003; Galbaldon et al., 2004; Higham et al., 2008; McGuigan et al., 2009), although the proximate cause of the increased work is under debate (e.g., increased force production or increased strain). We do not have the data to speculate how work may or may not be increased between horizontal locomotion and climbing in this study. But, since there are no significant changes in contact time (although all species trended towards an increase in contact time), the difference in metabolic cost between locomotor modes within species must be explained by differential muscle force production and/or muscle volume recruitment. Thus, we predict that large primates in this study recruit a greater mass-specific volume of muscle during climbing compared to during horizontal locomotion, and that this phenomenon is the proximate cause of the grater mass-specific energy cost in large primates during climbing.
Loris tardigradus
In addition to the differences that large primates must be experiencing, we also suggest that Loris tardigradus presents a special case during both horizontal locomotion and climbing in terms of how muscles are consuming energy. Lorises have relatively long limbs and this appears to translate into long muscle fibers relative to other primates (Hanna, unpublished data). Because L. tardigradus uses such long contact times during both horizontal locomotion and climbing, their rate of force production should be much lower than other small primates. Thus, we should expect to see L. tardigradus utilize less energy than C. medius and possibly even N. pygmaeus. As indicated by Figure 2, however, L. tardigradus uses approximately the predicted amount of mass-specific energy during horizontal locomotion and a similar mass-specific energy during climbing as other species. Thus, L. tardigradus does not appear to gain any energetic benefit due to slower rates of muscle contraction.
Previous work on horizontal locomotion has revealed principles which support this hypothesis. For example, Roberts et al. (1998b) have shown that turkeys and dogs produce similar forces and consume the same amount of energy to run (Roberts et al., 1998b). Turkeys, however, use a larger volume of muscle to run than dogs, despite the fact that turkeys and dogs recruit a similar cross-sectional area of muscle. Roberts et al. explained this phenomenon as being due to the longer muscle fibers of turkeys. The similar energy consumption phenomenon between turkeys and dogs was explained as the “greater volume [of muscle] appears to offset the economy of slower rates of force generation” (Roberts et al., 1998b; p 2753). We suggest a similar mechanism is at work during both horizontal locomotion and climbing in Loris tardigradus, such that the mass-specific volume of muscle recruited offsets any differential economy that these primates get due to slower contraction velocities. This potential relationship between metabolic cost and muscle recruitment volume remains speculative but fits the data presented here and theoretical expectations. Further study with electromyography data would be necessary to test these hypotheses.
Climbing and primate origins
In addition to adding to our understanding of metabolic constraints on climbing in primates and opening up new areas for research, the data presented here also have bearing on the pathways of primate locomotor evolution. The origin of primates has long been associated with the exploitation of a complex three-dimensional arboreal environment with thin flexible branches (Jenkins, 1972; Cartmill, 1972, 1994; Lemelin, 1999; Lemelin and Schmitt, 2007). If this represents a significant adaptive shift for early primates, one might speculate that this shift was associated with significant costs because of the increased amount of climbing added to the locomotor repertoire of basal primates. However, the data presented here suggests that if this shift occurred at a small body size, then there would be no increased metabolic cost by adding climbing to their locomotion. Thus, at a small size early primates could easily expand the range of areas in which they moved and foraged allowing them to exploit a potentially open ecological niche. We do not know how large early primates were and this remains an area of healthy debate. There is considerable reason to argue that early primates were small and spent time moving and foraging on thin flexible (Jenkins, 1972; Cartmill, 1972, 1994; Kay and Cartmill, 1977; Lemelin, 1999). This is consistent with the size of other early arboreal mammals including plesiadapiformes (Bloch et al., 2007; Silcox et al., 2007). However, arguments by Soligo and Martin (2006) regarding claw loss in the primate lineage suggest that early primates may have been larger (as much as 1,000 g). In the latter case it does seem that additional climbing would raise overall metabolic costs for early primates. Offsetting such costs in a relatively large primate ancestor would have required an increase in caloric intake from either new food sources or more food volume that would perhaps be available in this arboreal niche. However, if the early primate ancestors were small it is not necessary to invoke a model that requires increased caloric intake. The initial entry into the arboreal milieu could have been achieved with no increases in the costs of locomotion.
ACKNOWLEDGMENTS
The authors are grateful to Sean Brain, Matt Cartmill, William Hylander, Rodger Kram, Terry Mitchell, Matt O'Neill, Kathleen Smith, Steve Vogel, Christine Wall, Ann Zumwalt, and 2 anonymous reviewers for helpful discussions, comments, and advice in the preparation of this manuscript. They are especially grateful to Tim Griffin for his help on every aspect of this project. They thank the staff at the Duke Lemur Center, especially Stephanie Combes, Bill Hess, and Julie Ives, and at the CNPRR-USA for help with animal handling and experimental advice. This is DLC publication #1006.
Grant sponsor: NSF; Grant number: DIG-BCS 04-52631; Grant sponsor: NIH; Grant number: P40-RR001254; Grant sponsors: GRF, Sigma Xi (GIAR), The Society for Experimental Biology (Traveling fellowship), Duke University (Aleane Webb DIG).
Footnotes
Currently part of the Keeling Center for Comparative Medicine, UT MD Anderson Cancer Center.
LITERATURE CITED
- Aiello LC. Size and locomotion. In: Jones S, editor. The Cambridge encyclopedia of human evolution. Cambridge University Press; Cambridge: 1992. pp. 43–44. [Google Scholar]
- Alexander RM. Terrestrial locomotion. In: Alexander RM, Goldspink G, editors. Mechanics and energetics of animal locomotion. Chapman and Hall; London: 1977. pp. 168–203. [Google Scholar]
- Alexander RM. Optimum walking techniques for quadrupeds and bipeds. J Zool Lond. 1980;192:97–117. [Google Scholar]
- Alexander RM. Principles of animal locomotion. Princeton University Press; Princeton: 2003. [Google Scholar]
- Alexander RM, Jayes AS, Maloiy GMO, Wathuta EM. Allometry of the leg muscles of mammals. J Zool. 1981;194:539–552. [Google Scholar]
- Bertram JEA, Ruina A, Cannon CE, Young HC, Coleman MJ. A point-mass model of gibbon locomotion. J Exp Biol. 1999;202:2609–2617. doi: 10.1242/jeb.202.19.2609. [DOI] [PubMed] [Google Scholar]
- Biewener AA. Biomechanics of mammalian terrestrial locomotion. Science. 1990;250:1097–1103. doi: 10.1126/science.2251499. [DOI] [PubMed] [Google Scholar]
- Bloch JI, Boyer DM. Grasping primate origins. Science. 2002;298:1606–1610. doi: 10.1126/science.1078249. [DOI] [PubMed] [Google Scholar]
- Bloch JI, Silcox MT, Boyer DM, Sargis EJ. New Paleocene skeletons and the relationship of plesiadapiforms to crown-clade primates. Proc Natl Acad Sci USA. 2007;104:1159–1164. doi: 10.1073/pnas.0610579104. [DOI] [PMC free article] [PubMed] [Google Scholar]
- Botz JT, Loudon C, Barger JB, Olafsen JS, Steeples DW. Effects of slope and particle size on ant locomotion: implications for choice of substrate by antlions. J Kansas Entomol Soc. 2003;76:426–435. [Google Scholar]
- Brooks GA, Fahey TD, White TP. Exercise physiology: human bioenergetics and its applications. Mayfield Publishing Company; Mountain View: 1996. [Google Scholar]
- Cartmill M. Arboreal adaptations and the origin of the order Primates. In: Tuttle R, editor. Functional and evolutionary biology of primates. Aldine; Chicago: 1972. pp. 97–122. [Google Scholar]
- Cartmill M. New views on primate origins. Evol Anthropol. 1992;1:105–111. [Google Scholar]
- Cartmill M, Milton K. The lorisiform wrist joint and the evolution of “brachiating” adaptations in the Hominoidea. Am J Phys Anthropol. 1977;47:249–272. doi: 10.1002/ajpa.1330470206. [DOI] [PubMed] [Google Scholar]
- Cavagna GA. Mechanical work in running. J App Phys. 1964;19:249. doi: 10.1152/jappl.1964.19.2.249. [DOI] [PubMed] [Google Scholar]
- Cavagna GA, Heglund NC, Taylor CR. Mechanical work in terrestrial locomotion: two basic mechanisms for minimizing energy expenditure. J Physiol. 1977;233:R243–R261. doi: 10.1152/ajpregu.1977.233.5.R243. [DOI] [PubMed] [Google Scholar]
- Cavagna GA, Kaneko M. Mechanical work and efficiency in level walking and running. J Physiol. 1977;268:467–481. doi: 10.1113/jphysiol.1977.sp011866. [DOI] [PMC free article] [PubMed] [Google Scholar]
- Chang YH, Bertram JEA, Lee DV. External forces and torques generated by the brachiating white-handed gibbon (Hylobates lar) Am J Phys Anthropol. 2000;113:201–216. doi: 10.1002/1096-8644(200010)113:2<201::AID-AJPA5>3.0.CO;2-S. [DOI] [PubMed] [Google Scholar]
- Chang YH, Bertram JEA, Ruina A. A dynamic force and moment analysis system for brachiation. J Exp Biol. 1997;200:3013–3020. doi: 10.1242/jeb.200.23.3013. [DOI] [PubMed] [Google Scholar]
- Charles-Dominique P. Ecology and feeding behavior of five sympatric lorisids in Gabon. In: Martin RD, Doyle GA, Walker AC, editors. Prosimian biology. University of Pittsburgh Press; Pittsburgh: 1974. pp. 131–150. [Google Scholar]
- Collins S, Ruina A, Tedrake R, Wisse M. Efficient bipedal robots based on passive dynamic walkers. Science. 2005;307:1082–1085. doi: 10.1126/science.1107799. [DOI] [PubMed] [Google Scholar]
- Conroy G, Fleagle JG. Locomotor behavior in living and fossil pongids. Nature. 1972;237:103–104. [Google Scholar]
- Daley MA, Biewener AA. Muscle force-length dynamics during level versus incline locomotion: a comparison of in vivo performance of two guinea fowl ankle extensors. J Exp Biol. 2003;206:2941–2958. doi: 10.1242/jeb.00503. [DOI] [PubMed] [Google Scholar]
- Demes B, Larson SG, Stern JT, Jr, Jungers WL, Biknevicius AR, Schmitt D. The kinetics of primate quadrupedalism: “hindlimb drive” reconsidered. J Hum Evol. 1994;26:353–374. [Google Scholar]
- DeSilva JM. PhD dissertation. University of Michigan; Ann Arbor, MI: 2008. Vertical climbing adaptations in the ape ankle and midfoot. Implications for locomotion in Miocene catarrhines and Plio-Pleistocene hominins. [Google Scholar]
- di Prampero PE, Fusi S, Sepulcri L, Morin JB, Belli A, Antonutto G. Sprint running: a new energetic approach. J Exp Biol. 2005;208:2809–2816. doi: 10.1242/jeb.01700. [DOI] [PubMed] [Google Scholar]
- Donelan JM, Kram R, Kuo AD. Mechanical work for step-to-step transitions is a major determinant of the metabolic cost of human walking. J Exp Biol. 2002;205:3717–3727. doi: 10.1242/jeb.205.23.3717. [DOI] [PubMed] [Google Scholar]
- Elton S, Foley R, Ulijaszek SJ. Habitual energy expenditure of human climbing and clambering. Ann Hum Biol. 1998;25:523–531. doi: 10.1080/03014469800006762. [DOI] [PubMed] [Google Scholar]
- Fedak MA, Rome L, Seeherman HJ. 1 step nitrogen dilution technique for calibrating open circuit oxygen volume flow rate measuring systems. J Appl Physiol Respir Environ Exerc Physiol. 1981;51:772–776. doi: 10.1152/jappl.1981.51.3.772. [DOI] [PubMed] [Google Scholar]
- Fenn WO. Work against gravity and work due to velocity changes in running. Am J Physiol. 1930;93:433–462. [Google Scholar]
- Fleagle JG. Locomotion and posture of the Malayan siamang and implications for hominid evolution. Folia Primatol. 1976;26:245–269. doi: 10.1159/000155756. [DOI] [PubMed] [Google Scholar]
- Fleagle JG, Mittermeier RA. Locomotor behavior, body size, and comparative ecology of seven Suriname monkeys. Am J Phys Anthropol. 1980;52:301–314. [Google Scholar]
- Fleagle JG, Stern JTJ, Jungers WL, Susman RL, Vangor AK, Wells JP. Climbing: a biomechanical link with brachiation and bipedalism. Symp Zool Soc Lond. 1981;48:359–375. [Google Scholar]
- Full RJ, Tullis A. Energetics of ascent: insects on inclines. J Exp Biol. 1990;149:307–317. doi: 10.1242/jeb.149.1.307. [DOI] [PubMed] [Google Scholar]
- Galbaldon AM, Nelson FE, Roberts TJ. Mechanical function of two ankle extensors in wild turkeys: shifts from energy production to energy absorption during incline versus decline running. J Exp Biol. 2004;207:2277–2288. doi: 10.1242/jeb.01006. [DOI] [PubMed] [Google Scholar]
- Gebo DL. Climbing, brachiation, and terrestrial quadrupedalism: historical precursors of hominid bipedalism. Am J Phys Anthropol. 1996;101:55–92. doi: 10.1002/(SICI)1096-8644(199609)101:1<55::AID-AJPA5>3.0.CO;2-C. [DOI] [PubMed] [Google Scholar]
- Gebo DL, Dagosto M, Christopher Beard K, Ni X. New primate hind limb elements from the middle Eocene of China. J Hum Evol. 2008;55:999–1014. doi: 10.1016/j.jhevol.2008.03.002. [DOI] [PubMed] [Google Scholar]
- Griffin TM, Kram R, Wickler SJ, Hoyt DF. Biomechanical and energetic determinants of the walk-trot transition in horses. J Exp Biol. 2004;207:4215–4223. doi: 10.1242/jeb.01277. [DOI] [PubMed] [Google Scholar]
- Griffin TM, Roberts TJ, Kram R. Metabolic cost of generating muscular force in human walking: insights from load-carrying and speed experiments. J Appl Physiol. 2003;95:172–183. doi: 10.1152/japplphysiol.00944.2002. [DOI] [PubMed] [Google Scholar]
- Hamrick MW. Primate origins: evolutionary change in digital ray patterning and segmentation. J Hum Evol. 2001;40:339–351. doi: 10.1006/jhev.2001.0467. [DOI] [PubMed] [Google Scholar]
- Hanna JB. Kinematics of vertical climbing in lorises and Cheirogaleus medius. J Hum Evol. 2006;50:469. doi: 10.1016/j.jhevol.2005.12.001. [DOI] [PubMed] [Google Scholar]
- Hanna JB, Griffin T, Schmitt D. The energetic cost of climbing in primates. Science. 2008;320:898. doi: 10.1126/science.1155504. [DOI] [PubMed] [Google Scholar]
- Hanna JB, Schmitt D. Interpreting the role of climbing in primate locomotor evolution: are the biomechanics of climbing influenced by habitual substrate use and anatomy? Int J Primatol. in press. [Google Scholar]
- Heglund NC, Fedak MA, Taylor CR, Cavagna GA. Energetics and mechanics of terrestrial locomotion. IV. Total mechanical energy changes as a function of speed and body size in birds and mammals. J Exp Biol. 1982;97:57–66. doi: 10.1242/jeb.97.1.57. [DOI] [PubMed] [Google Scholar]
- Higham TE, Biewener AA, Wakeling JM. Functional diversification within and between muscle synergists during locomotion. Biol Lett. 2008;4:41–44. doi: 10.1098/rsbl.2007.0472. [DOI] [PMC free article] [PubMed] [Google Scholar]
- Hill AV. The dimensions of animals and their muscular dynamics. Sci Prog Lond. 1950;38:209–230. [Google Scholar]
- Hirasaki E, Kumakura H, Matano S. Kinesiological characteristics of vertical climbing in Ateles geoffroyi and Macaca fuscata. Folia Primatol. 1993;61:148–156. doi: 10.1159/000156742. [DOI] [PubMed] [Google Scholar]
- Hirasaki E, Kumakura H, Matano S. Electromyography of 15 limb muscles in Japanese macaques (Macaca fuscata) during vertical climbing. Folia Primatol. 1995;64:218–224. doi: 10.1159/000156857. [DOI] [PubMed] [Google Scholar]
- Hirasaki E, Kumakura H, Matano S. Biomechanical analysis of vertical climbing in the spider monkey and the Japanese macaque. Am J Phys Anthropol. 2000;113:455–472. doi: 10.1002/1096-8644(200012)113:4<455::AID-AJPA2>3.0.CO;2-C. [DOI] [PubMed] [Google Scholar]
- Hirasaki E, Matano S, Nakano Y, Ishida H. Vertical climbing in Ateles geoffroyi and Macaca fuscata and its comparative neurological background. In: Matano S, Tuttle RD, Ishida H, Goodman M, editors. Topics in primatology, Vol. 3: Evolutionary biology, reproductive endocrinology, and virology. University of Tokyo Press; Tokyo: 1992. pp. 156–165. [Google Scholar]
- Hunt KD. Positional behavior of Pan troglodytes in the Mahale Mountains and Gombe Stream National Parks, Tanzania. Am J Phys Anthropol. 1992;87:83–105. doi: 10.1002/ajpa.1330870108. [DOI] [PubMed] [Google Scholar]
- Hunt KD, Cant JGH, Gebo DL, Rose MD, Walker SE, Youlatos D. Standardized descriptions of primate locomotor and postural modes. Primates. 1996;37:363–387. [Google Scholar]
- Isler K. Footfall patterns, stride length and speed of vertical climbing in spider monkeys (Ateles fusciceps robustus) and woolly monkeys (Lagothrix lagotricha) Folia Primatol. 2004;75:133–149. doi: 10.1159/000078303. [DOI] [PubMed] [Google Scholar]
- Isler K. 3D-kinematics of vertical climbing in hominoids. Am J Phys Anthropol. 2005;126:66–81. doi: 10.1002/ajpa.10419. [DOI] [PubMed] [Google Scholar]
- Jenkins FA. Chimpanzee bipedalism: cineradiographic analysis and implications for the evolution of gait. Science. 1972;178:877–879. doi: 10.1126/science.178.4063.877. [DOI] [PubMed] [Google Scholar]
- Jones FW. Arboreal man. Edward Arnold; London: 1916. [Google Scholar]
- Kay RF, Cartmill M. Cranial morphology and adaptations of Palaechthon nacimienti and other paromomyidae (Plesiadapoidea, ? primates), with a description of a new genus and species. J Hum Evol. 1977;6:19–53. [Google Scholar]
- Kimura T, Okada M, Ishida H. Kinesiological characteristics of primate walking: its significance in nonhuman walking. In: Morbeck ME, Preuschoft H, Gomberg N, editors. Environment, behavior, and morphology: dynamic interactions in primates. Gustav Fischer; New York: 1979. pp. 297–311. [Google Scholar]
- Kram R, Taylor CR. Energetics of running. Nature. 1990;346:265–267. doi: 10.1038/346265a0. [DOI] [PubMed] [Google Scholar]
- Larson SG. Unique aspects of quadrupedal locomotion in nonhuman primates. In: Strasser E, Fleagle J, Rosenberger A, McHenry H, editors. Primate locomotion: recent advances. Plenum; New York: 1998a. pp. 157–173. [Google Scholar]
- Larson SG. Parallel evolution in the hominoid trunk and forelimb. Evol Anthropol. 1998b;6:87–99. [Google Scholar]
- Le Gros Clark WE. History of the primates. British Museum; London: 1950. [Google Scholar]
- Lemelin P. Morphological correlates of substrate use in didelphid marsupials: implications for primate origins. J Zool. 1999;247:165–175. [Google Scholar]
- Lemelin P, Schmitt D. Origins of grasping and locomotor adaptations in primates: comparative and experimental approaches using an opossum model. In: Ravosa MJ, Dagosto M, editors. Primate origins: adaptations and evolution. Kluwer Academic Publishers; New York: 2007. pp. 329–380. [Google Scholar]
- Lipp A, Wolf H, Lehman FO. Walking on inclines: energetics of locomotion in the ant Camponotus. J Exp Biol. 2005;208:707–719. doi: 10.1242/jeb.01434. [DOI] [PubMed] [Google Scholar]
- McGowan CP, Duarte HA, Main JB, Biewener AA. Effects of load carrying on metabolic cost and hindlimb muscle dynamics in guinea fowl (Numida meleagris) J Appl Physiol. 2006;101:1060–1069. doi: 10.1152/japplphysiol.01538.2005. [DOI] [PMC free article] [PubMed] [Google Scholar]
- McGuigan MP, Yoo E, Lee DV, Biewener AA. Dynamics of goat distal hind limb muscle-function in response to locomotor grade. J Exp Biol. 2009;212:2092–2104. doi: 10.1242/jeb.028076. [DOI] [PMC free article] [PubMed] [Google Scholar]
- McMahon TA. Using body size to understand the structural design of animals: quadrupedal locomotion. J Appl Physiol. 1975;39:619–627. doi: 10.1152/jappl.1975.39.4.619. [DOI] [PubMed] [Google Scholar]
- Minetti AE, Ardigo LP, Reinach E, Saibene F. The relationship between mechanical work and energy expenditure of locomotion in horses. J Exp Biol. 1999;202:2329–2338. doi: 10.1242/jeb.202.17.2329. [DOI] [PubMed] [Google Scholar]
- Nakatsukasa M, Ogihara N, Hamada Y, Goto Y, Yamada M, Hirakawa T, Hirasaki E. Energetic costs of bipedal and quadrupedal walking in Japanese macaques. Am J Phys Anthropol. 2004;124:248–256. doi: 10.1002/ajpa.10352. [DOI] [PubMed] [Google Scholar]
- O'Neill M. PhD thesis. Johns Hopkins University; Baltimore: 2008. The structural basis of locomotor cost: gait, mechanics and limb design in ringtailed lemurs (Lemur catta) [Google Scholar]
- Parson PE, Taylor CR. Energetics of brachiation versus walking: a comparison of a suspended and an inverted pendulum mechanism. Physiol Zool. 1977;50:182–188. [Google Scholar]
- Pontzer H. Predicting the energy cost of terrestrial locomotion: a test of the LiMb model in humans and quadrupeds. J Exp Biol. 2007;210:484–494. doi: 10.1242/jeb.02662. [DOI] [PubMed] [Google Scholar]
- Prost JH. Origin of bipedalism. Am J Phys Anthropol. 1980;52:175–190. doi: 10.1002/ajpa.1330520204. [DOI] [PubMed] [Google Scholar]
- Rice WR. Analyzing tables of statistical tests. Evolution. 1989;43:223–225. doi: 10.1111/j.1558-5646.1989.tb04220.x. [DOI] [PubMed] [Google Scholar]
- Richmond BG, Begun DR, Strait DS. Origin of human bipedalism: the knuckle-walking hypothesis revisited. Yrbk Phys Anthropol Suppl. 2001;33:70–105. doi: 10.1002/ajpa.10019.abs. [DOI] [PubMed] [Google Scholar]
- Roberts TJ, Chen MS, Taylor CR. Energetics of bipedal running. II. Limb design and running mechanics. J Exp Biol. 1998b;201:2753–2762. doi: 10.1242/jeb.201.19.2753. [DOI] [PubMed] [Google Scholar]
- Roberts TJ, Kram R, Weyand PG, Taylor CR. Energetics of bipedal running. I. Metabolic cost of generating force. J Exp Biol. 1998a;201:2745–2751. doi: 10.1242/jeb.201.19.2745. [DOI] [PubMed] [Google Scholar]
- Roberts TJ, Marsh RL, Weyand PG, Taylor CR. Muscular force in running turkeys: the economy of minimizing work. Science. 1997;275:1113. doi: 10.1126/science.275.5303.1113. [DOI] [PubMed] [Google Scholar]
- Ruina A, Bertram JEA, Srinivasan M. A collisional model of the energetic cost of support work qualitatively explains leg sequencing in walking and galloping, pseudo-elastic leg behavior in running and the walk-to-run transition. J Theor Biol. 2005;237:170–192. doi: 10.1016/j.jtbi.2005.04.004. [DOI] [PubMed] [Google Scholar]
- Schmitt D. Forelimb mechanics during arboreal and terrestrial quadrupedalism in Old World monkeys. In: Strasser E, Fleagle JG, Rosenberger A, McHenry H, editors. Primate locomotion: recent advances. Plenum; New York: 1998. pp. 175–200. [Google Scholar]
- Schmitt D. Compliant walking in primates. J Zool. 1999;248:149–160. [Google Scholar]
- Schmitt D. Evolutionary implications of the unusual walking mechanics of the common marmoset (C. jacchus) Am J Phys Anthropol. 2003a;122:28–37. doi: 10.1002/ajpa.10214. [DOI] [PubMed] [Google Scholar]
- Schmitt D. The relationship between forelimb anatomy and mediolateral forces in primate quadrupeds: implications for interpretation of locomotor behavior in extinct primates. J Hum Evol. 2003b;44:47–58. doi: 10.1016/s0047-2484(02)00165-3. [DOI] [PubMed] [Google Scholar]
- Schmitt D, Hanna JB. Substrate alters forelimb to hindlimb peak force ratios in primates. J Hum Evol. 2004;46:239–254. doi: 10.1016/j.jhevol.2003.11.008. [DOI] [PubMed] [Google Scholar]
- Silcox MT, Boyer DM, Bloch JI, Sargis EJ. Revisiting the adaptive origins of primates (again) J Hum Evol. 2007;53:321–324. doi: 10.1016/j.jhevol.2007.01.010. [DOI] [PubMed] [Google Scholar]
- Sockol MD, Raichlen DA, Pontzer H. Chimpanzee locomotor energetic and the origin of human bipedalism. Proc Nalt Acad Sci. 2007;104:12265–12269. doi: 10.1073/pnas.0703267104. [DOI] [PMC free article] [PubMed] [Google Scholar]
- Sokal RR, Rohlf FJ. Biometry. 3rd ed. Freeman; New York: 1995. [Google Scholar]
- Soligo C, Martin RD. Adaptive origins of primates revisited. J Hum Evol. 2006;50:414–430. doi: 10.1016/j.jhevol.2005.11.001. [DOI] [PubMed] [Google Scholar]
- Stern JTJ. Before bipedality. Yrbk Phys Anthropol. 1976;20:59–68. [Google Scholar]
- Stern JTJ, Oxnard CE. Primate locomotion: some links with evolution and morphology. Primatologia 4. Karger; Basel: 1973. pp. 1–93. [Google Scholar]
- Stern JTJ, Susman RL. Electromyography of gluteal muscle in Hylobates, Pongo, and Pan: implications for the evolution of hominid bipedality. Am J Phys Anthropol. 1981;55:153–166. [Google Scholar]
- Steudel-Numbers KL. The energetic cost of locomotion: humans and primates compared to generalized endotherms. J Hum Evol. 2003;44:255–262. doi: 10.1016/s0047-2484(02)00209-9. [DOI] [PubMed] [Google Scholar]
- Stevens NJ. The effect of branch diameter on primate gait sequence pattern. Am J Primatol. 2008;70:356–362. doi: 10.1002/ajp.20499. [DOI] [PubMed] [Google Scholar]
- Szalay FS, Dagosto M. Evolution of hallucial grasping in the primates. J Hum Evol. 1988;17:1–33. [Google Scholar]
- Taylor CR, Caldwell SL, Rowntree VJ. Running up and down hills: some consequences of size. Science. 1972;178:1096–1097. doi: 10.1126/science.178.4065.1096. [DOI] [PubMed] [Google Scholar]
- Taylor CR, Heglund NC, Maloiy GMO. Energetics and mechanics of terrestrial locomotion: I. Metabolic energy consumption as a function of speed and body size in birds and mammals. J Exp Biol. 1982;97:1–21. doi: 10.1242/jeb.97.1.1. [DOI] [PubMed] [Google Scholar]
- van Ingen Schenau GJ. Some fundamental aspects of the biomechanics of overground versus treadmill locomotion. Med Sci Sports Exer. 1980;12:257–261. [PubMed] [Google Scholar]
- Vangor AK, Wells JP. Muscle recruitment and the evolution of bipedality: evidence from telemetered electromyography of spider, woolly and patas monkeys (*) Ann Sci Nat Zool Paris. 1983;5:125–135. [Google Scholar]
- Washburn SL. Speculations on the problem of man's coming to the ground. In: Rothblatt B, editor. Changing perspectives on man. University of Chicago Press; Chicago: 1968. pp. 193–206. [Google Scholar]
- Wickler SJ, Hoyt DF, Biewener AA, Cogger EA, De La Paz KL. In vivo muscle function vs. speed: I. Muscle function trotting up an incline. J Exp Biol. 2005;208:1191–2000. doi: 10.1242/jeb.01485. [DOI] [PubMed] [Google Scholar]
- Willems PA, Cavagna GA, Heglund NC. External, internal and total work in human locomotion. J Exp Biol. 1995;198:379–393. doi: 10.1242/jeb.198.2.379. [DOI] [PubMed] [Google Scholar]
- Withers PC. Measurement of oxygen consumption carbon dioxide production and evaporative water loss with a flow through mask. J Appl Physiol. 1977;42:120–123. doi: 10.1152/jappl.1977.42.1.120. [DOI] [PubMed] [Google Scholar]
- Yamazaki N, Ishida H, Kimura T, Okada M. Biomechanical analysis of primate bipedal walking by computer simulation. J Hum Evol. 1979;8:337–349. [Google Scholar]