Abstract
Polystyrene beads with a mean diameter of 0.76 μm were coupled with protein G and then anti-type II collagen IgG or anti-chondroitin-4-sulphate IgG were tagged to protein G. Antibody-tagged beads were applied to articular cartilage and labelled beads were counted in each sample. Antibody-tagged beads labelled significantly higher than IgG isotype control. We propose immuno-SEM using protein G coupled beads as a valuable method for micrometre range observation for specific protein distribution on surfaces of tissues or organs. This will provide information about structure as well as antigenicity on the surface at the same time.
Keywords: articular cartilage, immuno-SEM, large scale, micrometre, polystyrene beads, protein G
Cell targeting is a method for promoting the accumulation of cells to tissues or organs by tagging the cells with an antibody, specific to the tissue or organ in question. We developed this cell targeting method both for the regeneration of damaged tissues or organs, such as the use of antibodies to cartilage extracellular matrix to direct chondrocytes to the damaged area of cartilage in arthritis [1], and for systemic injection of therapeutic cells, such as targeting mesenchymal stem cells to inflammation-activated epithelium [2].
In cell targeting, the antigen-tagged cell delivery is highly influenced by antigenicity of surface lining which mediates the interaction between the target tissue and the potentially therapeutic cells. Immunochemistry has been widely used in the LM and EM levels for the evaluation of cells and tissues antigenicity, and this method is very effective to analyse the internal structure of cells and tissues but has limitations with respect to surface evaluation. SEM observation using the immunogold labelling method has been used for this purpose in multiple fields [3–5], but also has limitations for large area surveying due to the nanometre scale of the gold labelling used, which sometimes requires a field emission SEM. To more accurately assess only surface-accessible antibody binding sites developed, we report here a novel method for evaluating surface antigenicity of tissue or organ at a micrometre scale using protein G coupled polystyrene beads.
Recombinant protein G (Calbiochem, San Diego, CA, USA) solution and beads (0.76 μm diameter; Bangs Laboratories Inc., Fishers, IN, USA) suspension were prepared at 1 mg/ml and 10%, respectively, with 0.1 M phosphate–citrate buffer (pH 4.19). For coating, 333 μl of bead suspension was added to 400 μl of protein G solution drop by drop and mixed gently for 1–2 h at room temperature (RT) and incubated overnight at 4°C with smooth constant agitation. The solution was centrifuged for 10 min at 1000 × g and bead pellet resuspended in 1% bovine serum albumin (BSA)/0.05% Tween 20 for 30 min at RT with constant agitation. The solution was centrifuged and resuspended in 333 μl of phosphate–citrate buffer with 0.05% BSA to a 10 mg/ml (wt/vol) final bead concentration. The final protein G coupled bead suspension was stored at 4°C until needed.
The articular surface of rabbit femur condyle was cut into small slices with diamond bone saw and one region of synovial surface was exposed by a razor blade. Samples for anti-chondroitin-4-sulphate labelling were pre-treated by incubating in 0.1 U/ml chondroitinase (Sigma, St Louis, MO, USA) for 30 min at RT to expose the epitopes. The condyle slices were washed and blocked in 3% BSA–0.05% Tween 20 in PBS for 30 min, then incubated in either anti-type II collagen mouse IgG (University of Uppsala, Sweden) or anti-chondroitin-4-sulphate mouse IgG (Seikaku, Japan) at 1 μg/ml for 40 min at RT and washed four times with PBS and one time in phosphate–citrate buffer. The protein G coupled bead suspension was diluted 1:100 with phosphate–citrate buffer and incubated for 30 min at RT. Non-specific bound beads were washed out three times with PBS. Parallel controls were tested without primary antibody application.
Samples were fixed in 2.5% glutaraldehyde (Polysciences, Niles, IL, USA) in 0.1 M PBS, followed by further fixation in 1% osmium tetroxide (Polysciences) in 0.1 M PBS and dehydrated with a graded series of ethanol. After dehydration, samples were critical point-dried, mounted on aluminium stubs with conductive silver paint and then sputtered with Pt–Pd in ion sputter (IB3; RMC Eiko, Tucson, AZ, USA). The samples were observed using a scanning electron microscope (JSM 840A; JEOL, Peabody, MA, USA) at 25 kV. Three different points were counted for bead quantification.
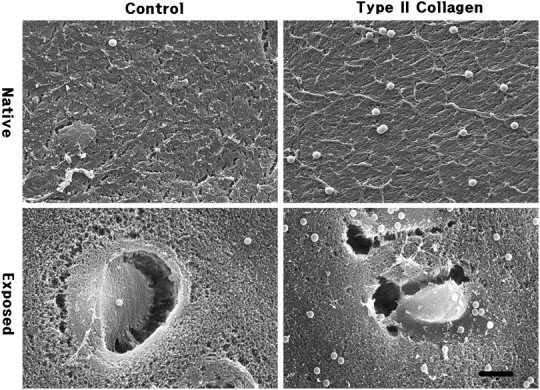
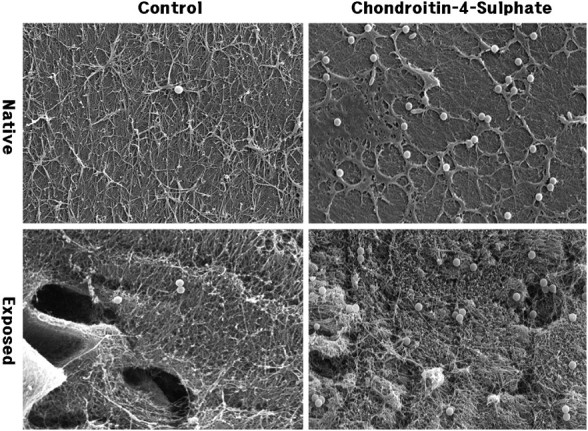
Beads observed in SEM showed a spherical shape and a regular size of 0.89 μm. Native synovial surfaces showed a smooth appearance with fibrillar structures, whereas the cut exposed surfaces showed opened lacunae and chondrocytes. Chondroitinase-digested cut surfaces showed a disorganized hazy appearance compared with the sharp and smooth surface of the untreated sample. Control groups showed only a few beads bound, whereas experimental groups showed a significant number of beads bound (Figs. 1 and 2).
Fig. 1.

Immunolabelled beads for type II collagen on native synovial surface and cut exposed surface of articular cartilage in rabbit femur condyle. Anti-type II collagen IgG-tagged beads labelled significantly higher than IgG untagged control. Asterisk indicates lacuna; scale bar = 5 μm.
Fig. 2.

Immunolabelled beads for chondroitin-4-sulphate on native synovial surface and cut exposed surface of articular cartilage in rabbit femur condyle. Anti-chondroitin-4-sulphate IgG-coated beads labelled significantly higher than IgG untagged control. Asterisk indicates lacuna; scale bar = 5 μm.
The mean number of beads for anti-type II collagen immunolabelling on native and exposed surfaces were 5.0 and 3.7 in control and 28.7 and 26.3 in experimental groups, respectively, and for anti-chondroitin-4-sulphate immunolabelling on native and exposed surfaces were 4.3 and 5.3 in control and 32 and 40 in experimental groups, respectively (Table 1). Both cases showed significant differences between control and experimental groups using the Student’s t-test (P < 0.01) in control or experimental groups.
Table 1.
The number of immunolabelled polystyrene beads on articular cartilage
| Type II collagen |
Chondroitin-4-sulphate |
|||
|---|---|---|---|---|
| Native | Exposed | Native | Exposed | |
| Control | 5.0 ± 2.6 | 3.7 ± 1.5 | 4.3 ± 1.5 | 5.3 ± 2.5 |
| Exposed | 28.7 ± 7.5 | 26.3 ± 11.5 | 32.0 ± 13.9 | 40.0 ± 17.6 |
Immuno-SEM has been used to identify specific proteins on the surface of cells or tissues [6]. The staining method is similar to immunogold labelling for TEM, which is a simple modification of immunostaining used for light and fluorescence microscopy. Immunofluorescence is familiar to nearly every cell biologist and is a very useful method for providing two-dimensional analysis of protein distribution in tissue slice, but is very limited for showing surface localization three-dimensionally. Three-dimensional evaluation of antigenicity on tissue or organ surface is often required for developing biological fields such as stem cell therapy where cells are injected systemically and need to interact with tissue or endothelial surfaces.
Immunogold labelling with silver enhancement [7] may be used to produce an SEM signal at lower magnifications. In the case of a typical 10 nm gold particle labelling, magnification of several tens of thousands is required for identifying the gold particle and is excessively time-consuming for mapping surface epitopes over large areas. Gold particles larger than 20 nm are rarely used because of low sensitivity in immunogold labelling. Large-sized beads were used in this study but still showed high sensitivity. It is hypothesized that the retention of sensitivity is related to the low specific gravity and surface characteristics of polystyrene. The balance between high sensitivity and ease of observation has always been a dilemma for morphologists, especially for electron microscopists. Actually, until this time, the immuno-SEM technique was limited to accurate ultra-structure immunoassay at the nanometre scale, with no attempt to use immuno-SEM at the micrometre level. We have been working on applying immuno-SEM at the micrometre level to evaluate protein distribution three-dimensionally for research in tissue engineering and stem cell therapy for targeting cells to tissue surfaces. An initial trial to screen surface antigenicity of tissue in large scale with protein G coupled beads with minor modification of cell targeting method showed meaningful results, wherein anti-type II collagen IgG-tagged beads labelled significantly higher than IgG non-tagged control beads on both native and exposed surfaces of the articular cartilage. The data of anti-chondroitin-4-sulphate-tagged beads showed similar results. The background or non-specific binding in control groups was higher than anticipated in larger-sized bead immunolabelling, but is still at an acceptable level. Various sizes of beads are provided by manufacturers and are available for immuno-SEM, which allows multiple labelling with different-sized beads tagged with different antibodies. We propose that immuno-SEM using protein G coupled beads is a valuable method for micrometre-ranged observation for specific protein distribution in the surface of tissues or organs. This will provide information on the structure and antigenicity of the surface at the same time.
Acknowledgments
This research was supported by the Yeungnam University research grants in 2008 and the NIH (R01AR49785).
References
- 1.Dennis J E, Cohen N, Goldberg V M, Caplan A I. Targeted delivery of progenitor cells for cartilage repair. J. Orthop. Res. 2004;22:735–741. doi: 10.1016/j.orthres.2003.12.002. [DOI] [PubMed] [Google Scholar]
- 2.Ko I K, Kean T J, Dennis J E. Targeting mesenchymal stem cells to activated endothelial cells. Biomaterials. 2009;30:3702–3710. doi: 10.1016/j.biomaterials.2009.03.038. [DOI] [PMC free article] [PubMed] [Google Scholar]
- 3.Biggs M J, Richards R G, Wilkinson C D, Dalby M J. Focal adhesion interactions with topographical structures: a novel method for immuno-SEM labelling of focal adhesions in S-phase cells. J. Microsc. 2008;231:28–37. doi: 10.1111/j.1365-2818.2008.02013.x. [DOI] [PubMed] [Google Scholar]
- 4.Iwano M, Che F S, Takayama S, Fukui K, Isogai A. Three-dimensional architecture of ribosomal DNA within barley nucleoli revealed with electron microscopy. Scanning. 2003;25:257–263. doi: 10.1002/sca.4950250507. [DOI] [PubMed] [Google Scholar]
- 5.Liang Y, Sasaki K. Expression of adhesion molecules relevant to leukocyte migration on the microvilli of liver peritoneal mesothelial cells. Anat. Rec. 2000;258:39–46. doi: 10.1002/(SICI)1097-0185(20000101)258:1<39::AID-AR5>3.0.CO;2-#. [DOI] [PubMed] [Google Scholar]
- 6.Goldberg M W. Immunolabeling for scanning electron microscopy (SEM) and field emission SEM. Methods Cell Biol. 2008;88:109–130. doi: 10.1016/S0091-679X(08)00407-X. [DOI] [PubMed] [Google Scholar]
- 7.Stump R F, Pfeiffer J R, Seagrave J, Oliver J M. Mapping gold-labeled IgE receptors on mast cells by scanning electron microscopy: receptor distributions revealed by silver enhancement, backscattered electron imaging, and digital image analysis. J. Histochem. Cytochem. 1988;36:493–502. doi: 10.1177/36.5.2965720. [DOI] [PubMed] [Google Scholar]


