Abstract
The unusual property of negative thermal expansion is of fundamental interest and may be used to fabricate composites with zero or other controlled thermal expansion values. Here we report that colossal negative thermal expansion (defined as linear expansion <−10−4 K−1 over a temperature range ~100 K) is accessible in perovskite oxides showing charge-transfer transitions. BiNiO3 shows a 2.6% volume reduction under pressure due to a Bi/Ni charge transfer that is shifted to ambient pressure through lanthanum substitution for Bi. Changing proportions of coexisting low- and high-temperature phases leads to smooth volume shrinkage on heating. The crystallographic linear expansion coefficient for Bi0.95La0.05NiO3 is −137×10−6 K−1 and a value of −82×10−6 K−1 is observed between 320 and 380 K from a dilatometric measurement on a ceramic pellet. Colossal negative thermal expansion materials operating at ambient conditions may also be accessible through metal-insulator transitions driven by other phenomena such as ferroelectric orders.
 Negative thermal expansion—contraction upon heating—is an unusual process that may be exploited to produce materials with zero or other controlled thermal expansion values. Azuma et al. observe negative thermal expansion in BiNiO3 which is a result of Bi/Ni charge-transfer transitions.
Useful negative thermal expansion (NTE) materials for zero or controlled expansion composites should show a smooth contraction while heating through a wide temperature range1,2,3. Volume shrinkages in framework-type materials such as ZrW2O8 (ref. 4) and Cd(CN)2 (ref. 5) can extend over very wide ranges, for example, ZrW2O8 shows a near-continuous volume decrease of ΔV/V=−2.0% over 0.3-1050 K6, equivalent to an average linear expansion of αL=(1/L)(ΔL/ΔT)=−7×10−6 K−1 where the linear dimension L here is the cubic unit cell parameter. NTE can also result from transitions between different electronic or magnetic states strongly coupled to the lattice, giving large negative expansions down to a previous record dilatometric value of −25×10−6 K−1 for (Mn0.96Fe0.04)3(Zn0.5Ge0.5)N at 316–386 K (ref. 7). Some rare earth compounds show similar volume shrinkages of a few % at first order valence transitions, for example, SmSe (ref. 8), Sm2.75C60 (ref. 9), and Yb8Ge3Sb5 (ref. 10), but the volume usually collapses over a narrow interval at low temperatures with strong hysteresis.
Volume shrinkages resulting from intermetallic charge transfers were recently found near room temperature in two perovskites synthesized at high pressure, LaCu3Fe4O12 (ref. 11) and BiNiO3 (ref. 12). Although the electronic transitions are first order, the accompanying volume change has an appreciable thermal width for the latter compound suggesting that inhomogeneities or chemical substitutions could be used to make the transition broad and quasi-continuous, leading to large NTE over an appreciable temperature range. We investigate here the possibility of preparing colossal NTE (CNTE) materials, defined as having a smooth change of ΔL/L<−1.0% over a temperature interval of ΔT~100 K (and hence αL<−100×10−6 K−1), and we show that doped-BiNiO3 ceramics may enable this concept be realized at ambient conditions.
Results
High-pressure and -temperature PND and XAS studies of BiNiO3
Intermetallic charge transfer in the perovskite BiNiO3 was discovered by application of pressure. At ambient pressure, BiNiO3 has a triclinically distorted crystal structure with the unusual valence distribution Bi3+0.5Bi5+0.5Ni2+O3 and shows charge ordering of the Bi valences13. This phase is insulating and ferrimagnetic, with a near-antiferromagnetic alignment of S=1 Ni2+ spins up to a Curie temperature of 300 K (ref. 14). Previous powder neutron diffraction (PND) and X-ray absorption spectroscopy (XAS) studies revealed a pressure-induced melting of the Bi-charge disproportionation at 3–4 GPa and a simultaneous Ni to Bi charge transfer accompanied by a structural change to the orthorhombic GdFeO3 type perovskite superstructure with valence distribution Bi3+Ni3+O3 (refs 12,15). This transition is accompanied by a broad insulator-to-metal transition, and a substantial volume decrease of 4.5% was observed between 2.1 and 4.7 GPa. A temperature-induced insulator-metal transition was reported for La-substituted Bi0.95La0.05NiO3 at ambient pressure16. This transition was attributed to the hole doping to Ni2+ ions from photoemission and XAS studies17,18 whereas the unit cell volume shrinkage of 2.9% found on heating suggested that substantial charge transfer occurs.
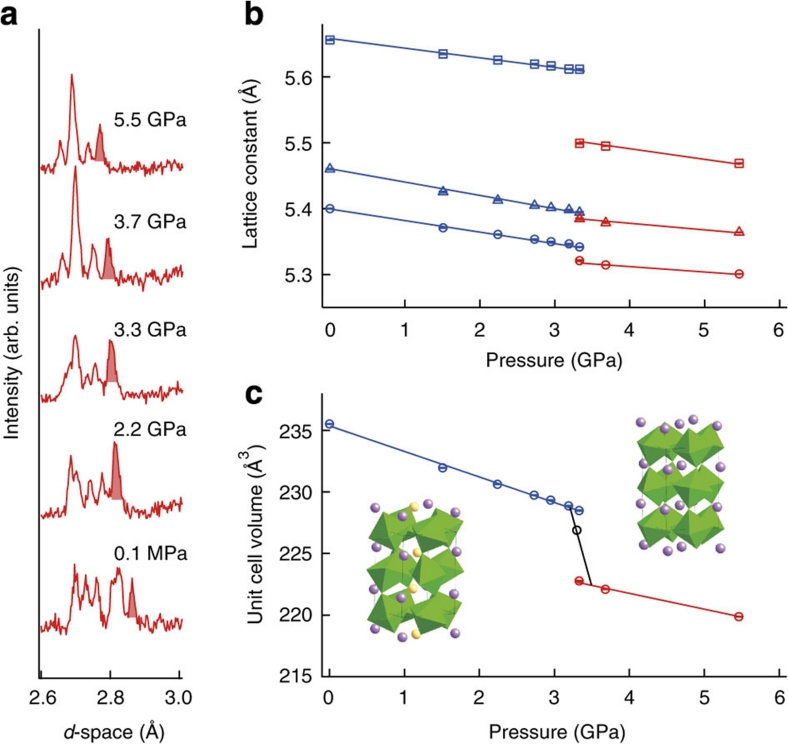
We have reinvestigated the first order structural transition accompanying the charge transfer in BiNiO3 using small pressure steps to estimate the transition width (Methods). Figure 1a shows part of the time-of-flight PND data at selected pressures up to 5.5 GPa on pressurizing. The drastic change around 3.5 GPa shows the transition from the triclinic Bi3+0.5Bi5+0.5Ni2+O3 structure (in the space group P-1) to the orthorhombic Bi3+Ni3+O3 high-pressure phase (in the space group Pbnm). Lattice parameters and unit cell volumes derived by fitting the data are shown in Figure 1b,c. These show that all the lattice parameters decrease across the transition, although the magnitudes of the changes differ, and the unit cell volume decreases by 2.5 %. This large change results from the dominant contraction of the Ni-O perovskite framework as Ni2+ is oxidized to the smaller Ni3+ at the transition, which outweighs the lattice expanding effects of reducing Bi5+ to Bi3+ and increases in the Ni-O-Ni angles. The structural transformation was found to occur from 3.2 to 3.7 GPa on compression so the transition width is taken as ΔpCT≈0.5 GPa, which is consistent with the weighted average volume of the two coexisting phases observed at 3.3 GPa as shown on Figure 1c.
Figure 1. Structural evolution of BiNiO3 under pressure at room temperature.
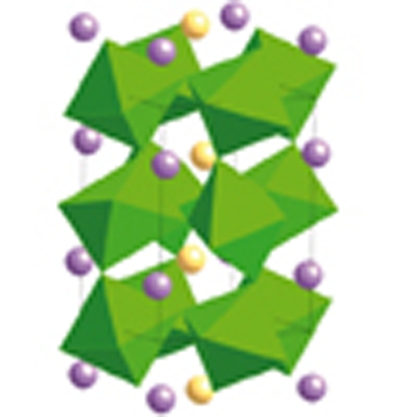
(a) Selected time-of-flight PND data at variable pressures showing the change in diffraction intensities around the 3.5 GPa insulator-metal transition, also a peak from the Pb pressure standard (shaded). (b) and (c) Pressure dependence of the lattice constants (b) and the unit cell volume (c) of BiNiO3. Insets show the low pressure and temperature (LPT, Bi3+0.5Bi5+0.5Ni2+O3) and high-pressure and temperature (HPT, Bi3+Ni3+O3) crystal structures, with purple and yellow spheres respectively corresponding to Bi3+ and Bi5+ states in the LPT structure. Blue and red symbols on (b) and (c) correspond to the LPT and HPT phases respectively. The circles, squares and triangles in (b) respectively stand for a, b and c/√2 lattice constants. The open point in (c) shows the weighted average volume at 3.3 GPa.
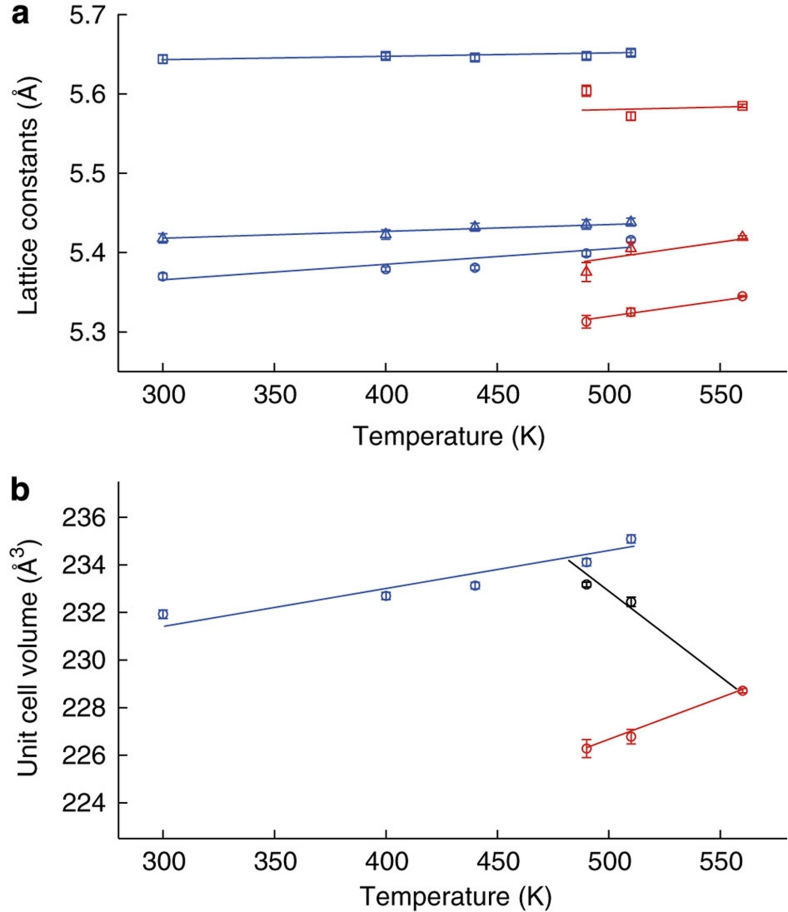
The charge-transfer transition in BiNiO3 has a negative dT/dp slope, which enables the same structural change and accompanying volume reduction to be observed by heating at a moderate pressure. Figure 2 shows the temperature dependence of the lattice parameters and unit cell volume of BiNiO3 on heating at a pressure of 1.8 GPa, with the transition occurring around 500 K. Structure refinements from neutron data, XAS, and resistivity measurements, shown as Supplementary Figures S1–S3 and Supplementary Table S1, confirm that the high-pressure and -temperature (HPT) state is the same orthorhombic and metallic Bi3+Ni3+O3 phase as generated by pressurization at ambient temperature, and none of the alternative charge states proposed elsewhere12 were observed. The volume drop of 3.4% observed by heating in Figure 2b has a similar value to the pressure-induced change in Figure 1b. Coexistence of the low-pressure and -temperature (LPT) Bi3+0.5Bi5+0.5Ni2+O3 phase and the HPT Bi3+Ni3+O3 form is observed at 490 and 510 K, which enables the transition width of the volume decrease to be estimated as ΔTCT=80 K by fitting a straight line through the two weighted average volumes as shown in Figure 2b. The volume (bulk) thermal expansion coefficient is αV=(1/V)(ΔV/ΔTCT)=−282×10−6 K−1 corresponding to αL=−94×10−6 K−1 over an 80 K range which approaches the CNTE paradigm.
Figure 2. Structural evolution of BiNiO3 at elevated temperatures under a constant pressure of 1.8 GPa.
(a) and (b) Temperature dependence of the lattice constants (a) and the unit cell volume (b) of BiNiO3 at 1.8 GPa showing the LPT (Bi3+0.5Bi5+0.5Ni2+O3) to HPT (Bi3+Ni3+O3) phase transition around 500 K. Blue and red symbols correspond to the LPT and HPT phases respectively. The circles, squares and triangles in (a) respectively stand for a, b and c/√2 lattice constants. The weighted average volumes shown for the two points in the coexistence region in (b) are used to estimate the transition width by extrapolation from the 560 K point.
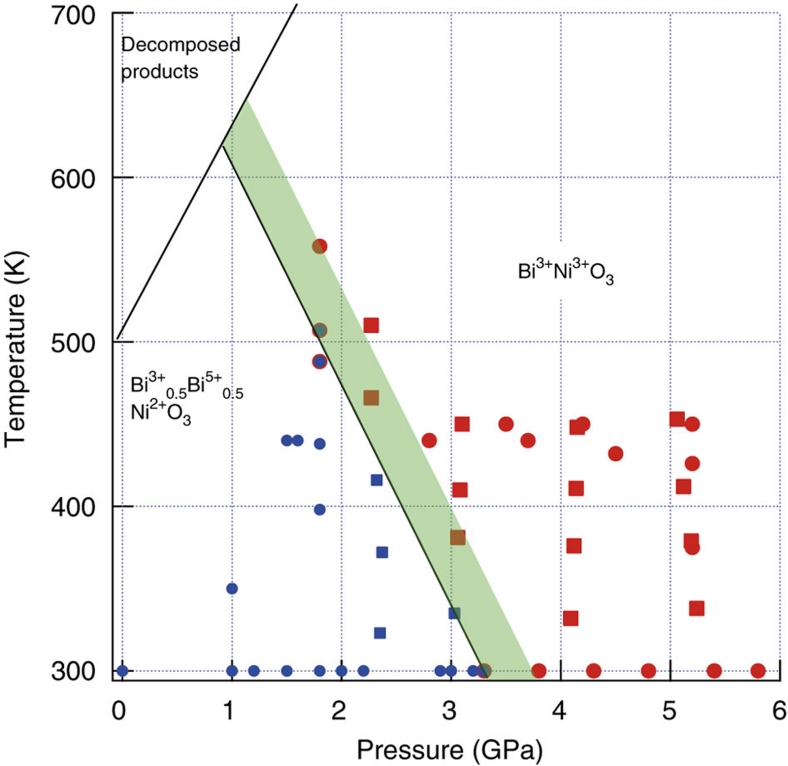
Our neutron diffraction and XAS results have been used to construct the P–T phase diagram for BiNiO3 shown in Figure 3. BiNiO3 decomposes above 500 K at ambient pressure, but is stabilized up to at least 565 K at 1.8 GPa (and to ~1,300 K at 6 GPa under synthesis conditions). The boundary between the LPT and HPT phases has slope dTCT/dp=−140 KGPa−1. The 2.5–3.4% volume contraction occurs over observed transition pressure and temperature widths of 0.5 GPa and 80 K respectively in BiNiO3, which are consistent with the transition slope as −ΔTCT/ΔpCT=−160 KGPa−1≈dTCT/dp.
Figure 3. Pressure-temperature phase diagram of BiNiO3 determined by PND and XAS studies.
Circles and squares show PND and XAS data, and blue and red symbols correspond to the LPT and HPT phases, respectively. The width of the transition between LPT (Bi3+0.5Bi5+0.5Ni2+O3) and HPT (Bi3+Ni3+O3) phases is indicated by the shaded area.
Powder XRD and dilatometry of Bi0.95La0.05NiO3 at ambient pressure
The large ΔTCT of BiNiO3 shows that CNTE is feasible but the transition is only observed above pressures of 1.5 GPa in pure BiNiO3. However, chemical substitutions for Bi may be used to suppress the charge disproportionation in the Bi3+0.5Bi5+0.5Ni2+O3 phase and thereby shift the charge-transfer transition to near ambient conditions. This is conveniently achieved by a partial substitution of La for Bi that suppresses the characteristic insulator to metal transition accompanying charge transfer to around 350 K at ambient pressure in Bi0.95La0.05NiO3 (ref. 16). The thermal expansion of this material has been explored using both X-ray diffraction (XRD) and dilatometry measurements to discover whether the La-substitution broadens the transition enabling wide-temperature range CNTE behaviour to be obtained.
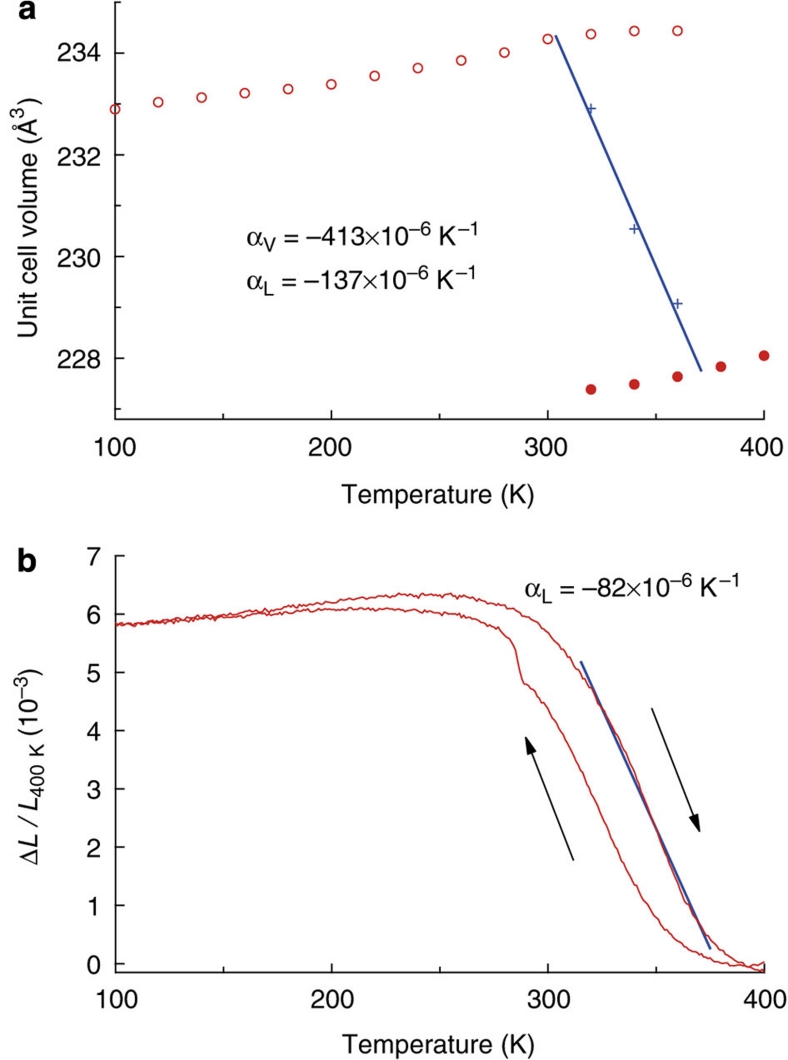
X-ray diffraction measurements on Bi0.95La0.05NiO3 in Figure 4a show the 2.9% volume shrinkage, which has a similar magnitude to that observed in undoped BiNiO3 under a pressure of 1.8 GPa. Coexistence of the low- and high-temperature phases is observed at three points in the transition region, and a linear fit to the weighted average volumes is used to obtain the transition width of ΔTCT=70 K, which is comparable to the 80 K estimate for BiNiO3 under pressure. The crystallographic volume thermal expansion coefficient between 300 and 370 K is αV=−413×10−6 K−1 and the linear coefficient is αL=−137×10−6 K−1, showing that CNTE magnitudes are also observable in Bi1-xLaxNiO3. Crystallography predicts the upper limit of the magnitude of thermal expansion as the formation of pores and other microstructural defects can lessen the effect in bulk ceramics. Dilatometric measurements on a polycrystalline ceramic of Bi0.95La0.05NiO3 prepared at high pressure were made during heating and cooling cycles as shown in Figure 4b. The strain ΔL/L(400 K) increases with increasing temperature up to 270 K indicating the normal positive thermal expansion, but decreases above 270 K. The average observed αL between 270 and 400 K is −49×10−6 K−1 and the maximum negative slope between 320 and 380 K corresponds to a linear thermal expansion coefficient of −82×10−6 K−1. This is more than three times larger than the previous maximum NTE value by dilatometry of −25×10−6 K−1, reported for the linear expansion of an anti-perovskite manganese nitride (Mn0.96Fe0.04)3(Zn0.5Ge0.5)N ceramic over a similar temperature range (316–386 K) (ref. 7). Furthermore, the derived bulk thermal expansion is only 60% of the predicted crystallographic value, suggesting that Bi0.95La0.05NiO3 ceramics showing CNTE should be accessible through further materials processing, for example, by using smaller grains to minimize pore formation. The hysteresis of up to 20 K between warming and cooling cycles would have to be further reduced for practical applications.
Figure 4. Thermal measurements for Bi0.95La0.05NiO3 at ambient pressure showing thermal expansion coefficient values over the linear regions indicated.
(a) Temperature dependence of the unit cell volume on heating with LPT and HPT data drawn as open and closed circles, and crosses showing the weighted average volume in the transition region. (b) The dilatometric linear thermal expansion of Bi0.95La0.05NiO3 on heating and cooling showing a 20 K hysteresis.
Discussion
BiNiO3-based ceramics have several advantages as negative expansion materials, in addition to colossal αL values. They are durable, and our samples have proved air- and moisture-stable over periods of several years to date. Our study of Bi1-xLaxNiO3 has shown that the temperature and width of the charge transfer transition are easily tuned around room temperature, and many further substituents for Bi are available, such as other lanthanides. The volume contraction also coincides with an insulator to metal transition that could be used as an additional response in smart materials applications. Chemical tuning is also needed to suppress hysteresis. However, if hysteresis is completely suppressed, the phase transition will no longer allow coexistence of both phases, and the overall NTE effect will be lost. The possible solution is to drive the transition to second order, as was done for Mn3(Cu1-xGex)N (ref. 7). The greatest limitation is that high pressures of ~6 GPa are presently required to synthesize BiNiO3-based materials, but non-equilibrium methods may be developed for bulk synthesis, as was done for diamond growth.
In conclusion, this study shows that charge-transfer transitions in transition metal oxides may enable CNTE materials operating at ambient conditions to be realized. Although the Bi3+0.5Bi5+0.5Ni2+O3 to Bi3+Ni3+O3 transition in BiNiO3 is first order, the volume shrinkage occurs over a reproducible width of ~80 K that is stabilized to ambient conditions by partial substitution of La3+ for Bi3+. The linear thermal expansion coefficient of −82×10−6 K−1 measured over a 60 K interval in Bi0.95La0.05NiO3 by dilatometry is more than three times that of other materials showing NTE near room temperature, and further substitutions and processing may enable the crystallographically observed magnitude of <−100×10−6 K−1 to be observed with suppression of thermal hysteresis. We note that other transitions involving the electronic degrees of freedom in transition metal oxides can also give rise to large volume shrinkages, for example, insulator to metal transitions induced by pressure in PbVO3 (ref. 19) and BiCoO3 (ref. 20) lead to the loss of off-centre ferroelectric displacements, and a spin state transition in the latter material, with >10% volume reductions. Chemical substitutions to shift these transitions to ambient conditions and broaden them into continuous changes could result in other CNTE materials.
Methods
Sample preparation
Polycrystalline BiNiO3 was prepared at 6 GPa and 1,000 °C with a cubic anvil type high-pressure apparatus, as reported previously13.
PND measurements
PND patterns at high-pressure, high-temperature conditions up to 7.7 GPa and 560 K were taken with a Paris-Edinburgh press at the Pearl beamline of the ISIS facility, UK. Pb was used as a pressure marker in ambient temperature experiments. The temperature variation of an 80 mg sample was explored at 1.8 GPa pressure using a variable-temperature insert. MgO was used as a pressure marker and the temperature was determined by the neutron resonances of Hf and Ta21. Data were collected for approximately 1 h at each temperature, with rapid heating between successive temperatures. Rietveld fits to the data were used to fit the lattice parameters and, in the coexistence regions, phase fractions that were used to calculate the weighted average of cell volumes. Representative high-pressure neutron diffraction results are shown in Supplementary Figure S1.
XAS measurements
The XAS measurements on BiNiO3 at the Ni-K edge under various pressures and temperatures were carried out using synchrotron radiation at the BL39XU beamline of SPring-8, Japan. A diamond anvil cell having anvils with a culet diameter of 0.6 mm was used to apply pressures up to 5 GPa. The powdered sample was mixed with NaCl as a solid pressure medium. The pressure inside the DAC was determined from the NaCl lattice constant. Sample heating was achieved with a resistance heater placed around the sample.
Synchrotron X-ray powder diffraction measurements
The temperature dependence of the lattice constant of Bi0.95La0.05NiO3 was determined from synchrotron X-ray powder diffraction data collected at beamline BL02B2 of SPring-8 with wavelength λ=0.42084 Å. Less than 1 mg of sample powder was loaded into a glass capillary with an inner diameter of 0.1 mm. The sample temperature was controlled by blowing cold or warm nitrogen gas. The heating rate was 60 K per min, and the temperature was stabilized for 5 min before each measurement.
Dilatometrc measurements
The linear thermal expansion of a 3 mm diameter and 1 mm high pellet was measured by dilatometry with a KYOWA type KFL strain gauge between 100 and 400 K. The temperature dependence of the resistance of the strain gauge was measured with a Quantum Design PPMS at heating/cooling rates of 1 K per min. Cu and SiO2 were used as reference materials.
Author contributions
M.A., M.M., S.I., Y.S. and J.P.A. designed the study. M.A., W.T.C., H.S., M.C., S.O., K.O., M.M., T.W., N.I., N.K., S.I. and M.G.T. performed the experiments and analysed the data. M.A. and J.P.A. wrote the paper.
Additional information
How to cite this article: Azuma, M. et al. Colossal negative thermal expansion in BiNiO3 induced by intermetallic charge transfer. Nat. Commun. 2:347 doi: 10.1038/ncomms1361 (2011).
Supplementary Material
Supplementary Figures S1-S5, Supplementary Table S1
Acknowledgments
We thank M. Senn (CSEC and School of Chemistry, The University of Edinburgh, UK) for help in the neutron powder diffraction measurements and to Professor T. Katsufuji (Waseda University, Japan) and Professor K. Takenaka (Nagoya University, Japan) for the help in the dilatometric measurement and to Professor H. Kawaji (Tokyo institute of Technology, Japan) for discussion. This work was partially supported by Grants-in-Aid from the Ministry of Education, Culture, Sports, Science and Technology, Japan for Scientific Research (Nos. 19GS0207, 19340098, 19052008, 22244044), the Elements Science and Technology Project and for a Joint Project of the Chemical Synthesis Core Research institutions and by the Cabinet Office, Government of Japan through its “Funding Program for Next Generation World-Leading Researchers” (GR032). The XRD and XAS experiments were respectively conducted at BL02B2 and BL39XU of SPring-8 with the approvals of JASRI. The neutron diffraction experiment was done under the Strategic Japanese-UK Cooperative Program funded by JST and EPSRC. Support was also provided by EPSRC, STFC and the Leverhulme Trust, UK.
References
- Barrera G. D., Bruno J. A. O., Barron T. H. K. & Allan N. L. Negative thermal expansion. J. Phys. Condens. Matter 17, R217–R252 (2005). [Google Scholar]
- Miller M., Smith C. W., Mackenzie D. S. & Evans K. E. Negative thermal expansion: a review. J. Mater. Sci. 44, 5441–5451 (2009). [Google Scholar]
- Jakubinek M. B., Whitman C. A. & White M. A. Negative thermal expansion materials Thermal properties and implications for composite materials. J. Therm. Anal. Calorim. 99, 165–172 (2010). [Google Scholar]
- Mary T. A., Evans J. S. O., Vogt T. & Sleight A. W. Negative thermal expansion from 0.3 to 1,050 Kelvin in ZrW2O8. Science 272, 90–92 (1996). [Google Scholar]
- Phillips A. E., Goodwin A. L., Halder G. J., Southon P. D. & Kepert C. J. Nanoporosity and exceptional negative thermal expansion in single-network cadmium cyanide. Angew. Chem. Int. Ed. 47, 1396–1399 (2008). [DOI] [PubMed] [Google Scholar]
- Evans J. S. O. Negative thermal expansion materials. J. Chem. Soc., Dalton Trans. 1999, 3317–3326 (1999). [Google Scholar]
- Takenaka K. & Takagi H. Giant negative thermal expansion in Ge-doped anti-perovskite manganese nitrides. Appl. Phys. Lett. 87, 261902 (2005). [Google Scholar]
- Jayaraman A., Narayanamurti V., Bucher E. & Maines R. G. Continuous and discontinuous semiconductor-metal transition in samarium monochalcogenides under pressure. Phys. Rev. Lett. 25, 1430–1433 (1970). [Google Scholar]
- Arvanitidis J., Papagelis K., Margadonna S., Prassides K. & Fitch A. N. Temperature-induced valence transition and associated lattice collapse in samarium fulleride. Nature 425, 599–602 (2003). [DOI] [PubMed] [Google Scholar]
- Margadonna S., Prassides K., Chondroudi M., Salvadorc J. R. & Kanatzidis M. G. Temperature-induced abrupt volume inflation in the mixed-valence ternary Zintl phase Yb8Ge3Sb5. Chem. Commun. 46, 5754–5756 (2005). [DOI] [PubMed] [Google Scholar]
- Long Y. W. et al. Temperature-induced A-B intersite charge transfer in an A-site-ordered LaCu3Fe4O12 perovskite. Nature 458, 60–63 (2009). [DOI] [PubMed] [Google Scholar]
- Azuma M. et al. Pressure-induced intermetallic valence transition in BiNiO3. J. Am. Chem. Soc. 129, 14433–14436 (2007). [DOI] [PubMed] [Google Scholar]
- Ishiwata S. et al. High pressure synthesis, crystal structure and physical properties of a new Ni(II) perovskite BiNiO3. J. Mater. Chem. 12, 3733–3737 (2002). [Google Scholar]
- Carlsson S. et al. Neutron powder diffraction study of the crystal and magnetic structures of BiNiO3 at low temperature. J. Solid State Chem. 181, 611–615 (2008). [Google Scholar]
- Mizumaki M. et al. Direct observation of the pressure-induced charge redistribution in BiNiO3 by X-ray absorption spectroscopy. Phys. Rev. B 80, 233104 (2009). [Google Scholar]
- Ishiwata S. et al. Pressure/temperature/substitution-induced melting of A-site charge disproportionation in Bi1-xLaxNiO3 (0≤×≤0.5). Phys. Rev. B 72, 045104 (2005). [Google Scholar]
- Wadati H. et al. Valence changes associated with the metal-insulator transition in Bi1xLaxNiO3. Phys. Rev. B 72, 155103 (2005). [Google Scholar]
- Wadati H. et al. Temperature-dependent photoemission and x-ray absorption studies of the metal-insulator transition in Bi1-xLaxNiO3. Phys. Rev. B 76, 205123 (2007). [Google Scholar]
- Belik A. A., Azuma M., Saito T., Shimakawa Y. & Takano M. Crystallographic features and tetragonal phase stability of PbVO3, a new member of PbTiO3 family. Chem. Mater. 17, 269–273 (2005). [Google Scholar]
- Oka K. et al. Pressure-induced spin-state transition in BiCoO3. J. Am. Chem. Soc. 132, 9438–9443 (2010). [DOI] [PubMed] [Google Scholar]
- Stone H. J. et al. Temperature measurement in a Paris-Edinburgh cell by neutron resonance spectroscopy. J. Appl. Phys. 98, 064905 (2005). [Google Scholar]
Associated Data
This section collects any data citations, data availability statements, or supplementary materials included in this article.
Supplementary Materials
Supplementary Figures S1-S5, Supplementary Table S1


