

Abstract
Aim
Our aim is to investigate the molecular mechanism of regulation of gene expression of drug metabolizing enzymes (DMEs) and transporters in diet-induced obesity.
Main methods
Adult male CD1 mice were fed diet containing 60% kcal fat (HFD) or 10% kcal fat (LFD) for 14 weeks. RNA levels of hepatic DMEs, transporters and their regulatory nuclear receptors (NRs) were analyzed by real-time PCR. Activation of cell-signaling components (JNK and NF-κB) and pro-inflammatory cytokines (IL-1β, IL-6 and TNFα) were measured in the liver. Finally, the pharmacodynamics of drugs metabolized by DMEs was measured to determine the clinical relevance of our findings.
Key findings
RNA levels of the hepatic phase I (Cyp3a11, Cyp2b10, Cyp2a4) and phase II (Ugt1a1, Sult1a1, Sultn) enzymes were reduced ~30-60% in HFD compared to LFD mice. RNA levels of Cyp2e1, Cyp1a2 and the drug transporters, multidrug resistance proteins, (Mrp)2, Mrp3 and multidrug resistant gene (Mdr)1b were unaltered in HFD mice. Gene expression of the NRs, PXR and CAR and nuclear protein levels of RXRα was reduced in HFD mice. Cytokines, JNK and NF-κB were induced in HFD mice. Thus reduction in hepatic gene expression in obesity may be modulated by cross-talk between NRs and inflammation-induced cell-signaling. Sleep time of Midazolam (Cyp3a substrate) was prolonged in HFD mice, while Zoxazolamine (Cyp1a2 and Cyp2e1 substrate)-induced sleep time was unaltered.
Significance
This study demonstrates that gene-specific reductions in DMEs can affect specific drugs metabolized by these enzymes, thus providing a rationale to monitor the effectiveness of drug therapy in obese individuals.
Keywords: Obesity, drug metabolism, nuclear receptors
Introduction
Obesity is implicated in the changes in the pharmacokinetics and pharmacodynamics of many therapeutic drugs, however the mechanism of obesity-mediated alterations of drug metabolism is unknown (Blouin et al, 1999; Cheymol 2000). High fat diet (HFD) models of obesity have been established as they mimic the consumption of diets high in fat in humans and subsequently lead to increased weight gain and elevated plasma concentrations of free fatty acid (FFAs) (Surwit et al, 1988; Van Heek et al, 1997; Collins et al, 2004). Studies using genetically engineered or nutritionally-induced animal models of obesity have shown changes in drug metabolizing enzymes (DMEs) and transporters. However, there is considerable variability in the regulation of Cytochrome P450 (Cyp) enzymes depending on age, gender, species and the model of obesity or diabetes in which the studies were conducted (Yang et al, 1992; Kim et al, 2004; Yoshinari et al, 2006; Cheng et al, 2008). Mice fed a high fat diet (36% kcal of fat) have significant reductions in Cyp3a11 at the protein and RNA levels in ICR mice (Yoshinari et al, 2006). Microarray analysis have also revealed that Cyp3a11 and Cyp4a10 are upregulated in C57BL/6J mice (Kim et al, 2004). Also, Cyp3a activity was reported to be reduced or induced in diabetic fa/fa Zucker rats (Irizar et al, 1995; Wang et al, 2007). Elevated levels of Cyp2e1 in HFD and genetically obese mice have also been reported (Leclercq et al, 2000; Khemawoot et al, 2007). In fact, the increased expression of Cyp2e1 gene in the liver of HFD mice has been shown to mediate the rapid disposition of chlorzoxane, a muscle relaxant, thus, decreasing its duration of action (Khemawoot et al, 2007). Similarly, the metabolism of acetaminophen and verapamil is also known to be modulated by high-fat diet model of obesity (Chen et al, 2008; Osabe et al, 2008). Thus, a detailed understanding of the mechanism of hepatic gene regulation in a clinically relevant model of obesity is needed since therapeutic drugs can become ineffective or even toxic in obese individuals.
Gene expression of DMEs and transporters are regulated by basal transcription factors and regulatory nuclear receptors (NRs) (Mangelsdorf et al, 1995b). The xenobiotic NRs, pregnane X receptor (PXR) and constitutive androstane receptor (CAR) heterodimerize with the retinoid X receptor α (RXRα) to regulate the expression of DMEs and drug transporters (Mangelsdorf et al, 1995a). Furthermore, transcriptional activities of these nuclear receptors are regulated by signaling pathways associated with nuclear factor kappa B (NF-κB) and c-Jun N terminal kinase (JNK), which are known to be induced in obesity (Hirosumi et al, 2002; Cai et al, 2005). Adiposity of the liver results in the activation of the liver macrophages, the Kupffer cells, which are the primary sites of cytokine production in the liver (Ramadori et al, 2001). Activation of Kupffer cells can induce the release of cytokines, which act on hepatocytes to suppress hepatic gene expression (Pascussi et al, 2000; Ramadori et al, 2001; Aitken et al, 2006). Thus, the interaction between nuclear receptors, cytokines and cell signaling molecules may control the expression and activity of DMEs and transporters in the presence of obesity.
In this study, we sought to investigate the role of HFD in the regulation of gene expression of hepatic DMEs and transporters. We measured the induction of HFD-associated cytokines and cell-signaling components which are known to regulate hepatic gene expression. Finally, we examined the clinical relevance of our findings by determining the pharmacodynamics of the anesthetic, Midazolam (Cyp3a11 substrate) and the muscle-relaxant, Zoxazolamine (Cyp2e1 and Cyp1a2 substrate) (Liang et al, 1996; Olkkola et al, 2008).
Materials and methods
Animals and treatments
Adult male CD1 mice (~6 weeks, Charles Rivers Labs, Wilmington, MA) were fed a high fat diet (HFD) with 60% kcal of fat or low fat diet (LFD) containing 10% kcal of fat (Research Diets Inc., New Brunswick, NJ) for 14 weeks. Prior to dietary treatment, mice were allowed to acclimate to the animal care facility for 14 days. After acclimation, mice were randomly assigned to each diet condition and housed 4 per cage in a ventilated cage rack. This is a well-established model of diet-induced obesity, and the mice are known to become obese, hyperglycemic, and develop impaired glucose tolerance (Van Heek et al, 1997; Breslin et al, 2010). Since dietary factors can significantly contribute to weight gain and obesity in humans, we utilized HFD mice in our studies. The mice were maintained in a temperature and humidity controlled environment, and all animal protocols were approved by the Institutional Animal Care and Use Committee.
Real time quantitative PCR analysis
Total RNA was isolated from mouse liver tissues using TRI® Reagent (Sigma, St Louis, MO) according to manufacturer’s instructions. cDNA synthesis was performed using a High Capacity cDNA Reverse Transcription kit (Applied Biosystems, Inc., Foster City, CA). Real time quantitative PCR was performed using an ABI PRISM 7300 Sequence Detection System instrument and software (Applied Biosystems, Inc., Foster City, CA). Briefly, each amplification reaction (25 ul) contained 50-100 ng of cDNA, 300 nM of forward primer, 300 nM of reverse primer, 200 nM of fluorogenic probe and 15ul of TaqMan® Universal PCR master mix. Quantitative expression values were extrapolated from standard curves normalized to the expression of cyclophilin. The sequences of the primers and probes were obtained from the literature and purchased from Applied Biosystems, as reported previously (Ghose et al, 2004; Ghose et al, 2007).
Preparation of nuclear and whole cell extracts
Nuclear extracts were prepared according to the methods of Itoh et al. (Itoh et al, 2002). Briefly, liver tissue was homogenized with a Dounce homogenizer (Kontes, Vineland, NJ, USA) in cold hypotonic buffer containing 10 mM HEPES (pH 7.5), 1.5 mM MgCl2, 10 mM KCl, 0.5 mM DTT, 1 mM NaF, 1 mM Na3VO4, and protease inhibitor cocktail (Roche Diagnostics, Indianapolis, IN). Cytoplasmic extracts were isolated by centrifugation for 5 minutes at 5000 rpm at 4°C two consecutive times. Nuclear extracts were then prepared by lysing nuclear pellets in 140 mM NaCl, 2 mM EDTA, 1% NP-40, 50 mM of Tris-HCl, (pH 7.2) 1 mM of NaF, 1 mM of Na3VO4, and protease inhibitor cocktail. After incubation on ice, nuclear extracts were obtained by centrifugation at 13,000 rpm for 5 minutes at 4°C.
Whole cell extracts were prepared by homogenizing liver tissues in 0.2 ml buffer containing 50 mM Tris-HCl, pH 7.5, 0.5 M NaCl, 2 mM EDTA, 2 mM EGTA, 1% Triton X-100, 0.25% deoxycholate, 1 mM NaF, 1 mM Na3VO4, and protease inhibitor cocktail. Whole cell extracts were subsequently collected after centrifugation at 13,000 rpm for 10 minutes at 4°C. Samples were analyzed by immunoblotting. Protein concentrations were determined by bicinchoninic acid (BCA) assay according to the manufacturer’s protocol (Pierce, Rockford, IL, USA).
Immunoblotting
Mouse liver nuclear and whole cell extracts containing equal amounts of protein were resolved by 10% SDS-polyacrylamide gel electrophoresis and transferred to Trans-blot membranes (Bio-Rad, Hercules, CA). Membranes were blocked for 1 h at room temperature in 5% nonfat dry milk or 5% BSA (for phosphoproteins) dissolved in Tris-buffered saline with Tween-20 (TBST) prior to incubation with primary antibodies. Membranes were subsequently washed and probed with a goat anti-rabbit IgG-AP secondary antibody (1:2000) for 1 h at room temperature. The blots were then washed with TBST and incubated with Tropix CDP Star® Nitro block II™ ECL reagent according to the manufacturer’s instructions (Applied Biosystems, Foster City, CA). Protein bands were analyzed and quantified by FluorChem FC Imaging System (Alpha Innotech, San Leandro, CA).
Cyp3a11 enzyme activity assay
Mouse liver microsomes were prepared using a procedure adopted from the literature with minor modifications as described below (Chen et al., 2003). Fresh mice livers were perfused with sodium phosphate buffer (pH 7.4) to remove the blood. Livers were homogenized using a motorized homogenizer in ice-cold homogenization buffer (50 mM potassium phosphate buffer (pH 7.4), 250 mM sucrose, 1 mM EDTA) and centrifuged at 15,400 rpm for 15 min at 4°C. The pellet was discarded and the supernatant was collected and centrifuged again at 35,000 rpm for 60 min at 4°C to yield microsome pellets. The microsome pellet was then resuspended in 250 mM sucrose, and stored at −80°C for future experiments. Protein concentration of the microsomal fractions was determined using a BCA protein assay kit (Pierce, Rockford, IL, USA) using bovine serum albumin (BSA) as the standard.
Cyp3a11 enzyme activity was determined using mouse liver microsomes using the Cyp3a substrate, midazolam (MDZ) as described previously, with minor modifications (He et al., 2006). The formation of 1′-OHMDZ from MDZ was used as a specific indicator for mouse Cyp3a11 activity. In brief, incubation mixtures (performed in duplicate) contained 0.1 mg of total microsomal protein, MDZ (0-16 μM), 1.3 mM NADPH and reaction cofactors in 50 mM potassium phosphate buffer (pH 7.4). The reaction mixtures (250 μL) were incubated in a 37°C shaking water bath set at 40 oscillations min-1. The reaction was initiated by addition of glucose-6-phosphate dehydrogenase (1 unit mL-1). After 5 min, the reactions were stopped by the addition of equal volume of acetonitrile containing phenacetin as the internal standard (IS). The incubation mixture was centrifuged at 13,000 rpm at 4°C for 10 min and the supernatant was transferred to a 96-well auto-sampling plate for LC-MS/MS analysis. The identity of 1′OHMDZ and IS was verified by comparing with authenticated standards. The data were fit to standard Michaelis Menten rate equation. The enzyme activity data was analyzed by GraphPad Prism 4.0 software (GraphPad Inc., La Jolla, CA).
To determine the concentration of MDZ and its metabolites in microsomal and plasma samples, an API 3200 Qtrap triple quadrupole mass spectrometer (Applied Biosystem/MDS SCIEX, Foster City, CA, USA) was used in by MRM (Multiple Reaction Monitoring) method in the positive ion mode. A UPLC system, Waters Acquity™ with diode-arrayed detector (DAD) was used. The UPLC conditions for analyzing MDZ, 1′-OHMDZ, 1′-OHMDZ-gluc and phenacetin (I.S.) were: column, Acquity UPLC BEH C18 column (50 mm × 2.1 mm I.D., 1.7 μm, Waters, Milford, MA, USA); mobile phase A, 0.1% formic acid; mobile phase B, 100% acetonitrile performed in a gradient from 0 to 3 min. The quantification was performed using MRM method with the transitions of m/z 326.1 → m/z 291.1 for MDZ, 342.1 → 324.1 for 1′-OHMDZ, 518.1 → 324.1 for 1′-OHMDZ-gluc and 180.0 → 110.0 for phenacetin (IS). The retention times were: MDZ and 1′-OHMDZ, 1.26 min; 1′-OHMDZ-gluc, 1.21 min and phenacetin, 1.31 min.
Ugt enzyme activity assay
The UGT activity in the microsomal samples was determined by UGT-Glo™ assay kit according to manufacturer’s instructions (Promega, Madison, WI). Briefly, 0.0125 mg/ml microsomes were incubated with 16 mM UDPGA and 20 μM multi enzyme substrate at 37 °C for 30 min. After which 40 μl of reconstituted luciferin detection reagent containing D-Cysteine was added and the luminescent signal was allowed to stabilize for 20 min at room temperature. Luminescence was read on Biotek’s Synergy II plate reader using 1 second integration time.
Pharmacodynamics studies of Midazolam and Zoxazolamine
In order to determine the functional relevance of our findings, the pharmacodynamics (PD) of two representative drugs was measured in lean and HFD mice. The anesthetic, Midazolam is metabolized by Cyp3a, and the muscle relaxant, Zoxazolamine is primarily metabolized by Cyp2e1 and Cyp1a2. LFD and HFD mice were intraperitoneally injected with 12mg/kg bw of Midazolam or 15 mg/kg bw of Zoxazolamine. Sleep time was measured from the onset of sleep when the loss of righting reflex was observed to the time when this reflex returned.
Statistical analysis
Data are reported as mean ± S.D. Differences between experimental groups were assessed for statistical significance by the Mann-Whitney test. P-values <0.05 were considered significant.
Results
Regulation of gene expression of DMEs and transporters by high-fat diet
To determine the role of high-fat diet in the regulation of genes associated with drug metabolism and clearance, 6-week old male CD1 mice were fed a high-fat diet for 14 weeks as described by McFarlin et al (McFarlin et al, 2009; Breslin et al, 2010). As described previously, we observed significant body weight gain, and other characteristic features associated with obesity including significantly elevated serum glucose (15% increase), cholesterol (260% increase), triglycerides (250% increase), C-reactive protein (CRP) (220% increase) and leptin (60% increase) (McFarlin et al, 2009). The expression of key phase I DME genes, Cyp3a11, Cyp2b10 and Cyp2a4 were ~30-60% down-regulated in the livers of HFD mice compared to the LFD mice (Fig. 1A-C), while RNA levels of Cyp2e1 and Cyp1a2 were not affected (Fig. 1D and E). In addition, there was ~50-60% reduction in RNA levels of the key hepatic phase II DMEs, Ugt1a1, Sult1a1 and Sultn in HFD mice compared with LFD mice (Fig. 2). The protein levels of the representative phase I and phase II DMEs, Cyp3a11, Cyp2b10, Ugt1a1 and Sult1a1 were also reduced ~50-55% in HFD mice compared to LFD control (Fig. 3).
Fig. 1.
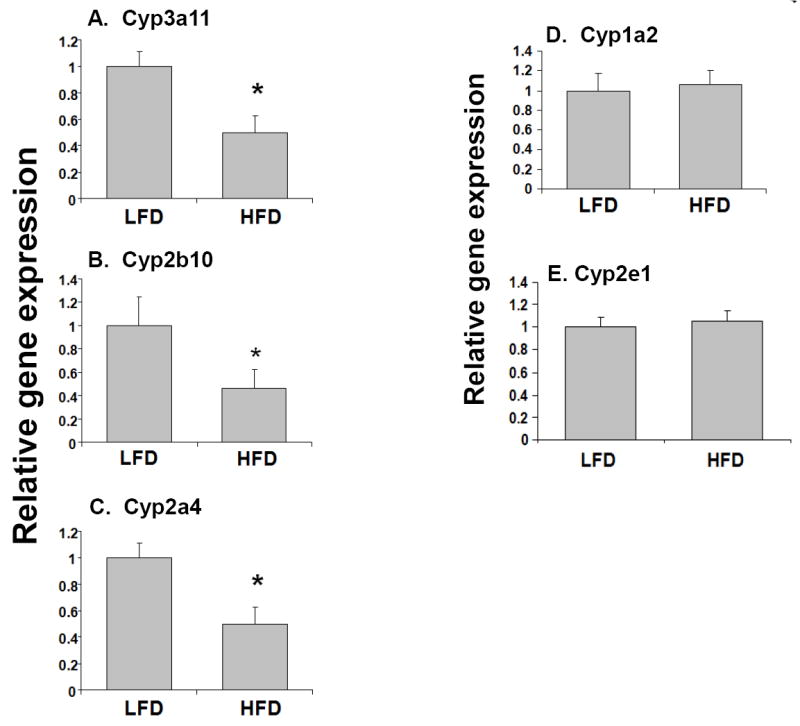
Effects of high fat diet on the RNA levels of phase I DMEs genes in mouse. LFD and HFD mice were fed diets with 10% and 60% kcal from fat respectively, for 14 weeks. RNA was isolated from the livers (n=10-12 per group) and Cyp3a11 (A), Cyp2b10 (B), Cyp2a4(C), Cyp1a2 (D), Cyp2e1 and (E) RNA levels were quantified by TaqMan® real-time PCR as described in Materials and methods. Data are presented as mean ± SD and normalized to cyclophilin mRNA levels. The asterisks indicate p < 0.05 between LFD and HFD groups.
Fig. 2.
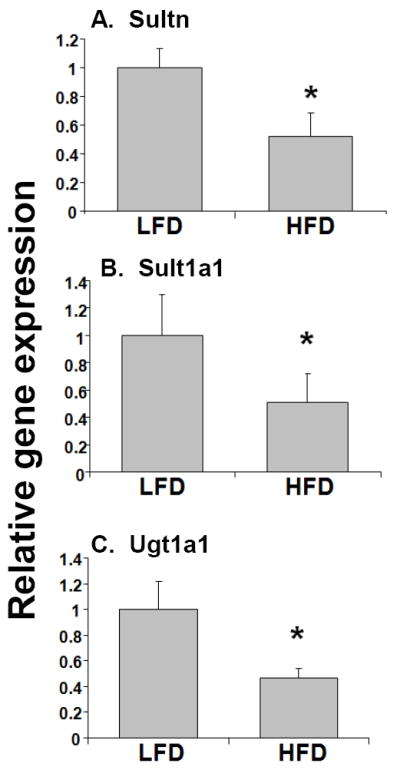
Effects of high fat diet on the RNA levels of phase II DMEs genes. RNA was isolated from the livers (n=10-12 per group) and Sultn (A), Sult1a1 (B), and Ugt1a1 (C) RNA levels were quantified by TaqMan® real-time PCR as described in Materials and methods. Data are presented as mean ± SD and normalized to cyclophilin mRNA levels. The asterisks indicate p < 0.05 between LFD and HFD groups.
Fig. 3.
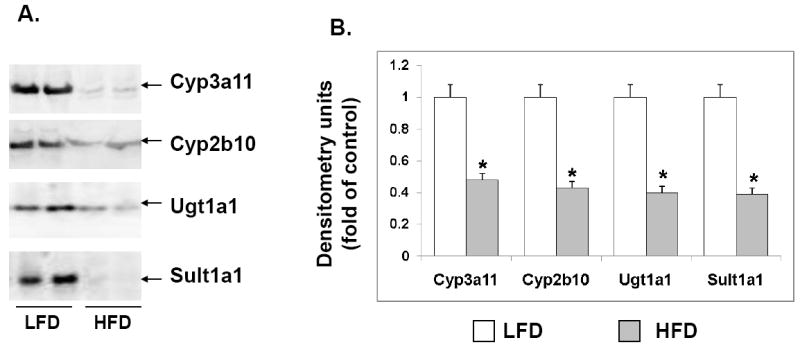
Effects of high fat diet on the protein expression of select phase I and phase II DMEs. LFD and HFD mice were fed diets with 10% and 60% kcal from fat respectively, for 14 weeks. Microsomes were prepared from the livers (n=10-12 per group), and protein levels of Cyp3a11, Cyp2b10 (Phase I DMEs) and Ugt1a1 and Sult1a1 (phase II DMEs) were analyzed by immunoblotting (A). Quantification of the blots by densitometry was done and compared to LFD controls. Data are representative of 4-5 independent experiments. Error bars denote SD.
To confirm the reduction in phase I and II DMEs, we measured the catalytic activity of Cyp3a11 and Ugt1a1. Cyp3a11 enzyme activity was measured by the formation rate of 1′-hydroxymidazolam, which is formed by metabolism of the Cyp3a substrate, midazolam as described in “Materials and Methods.” LC-MS/MS analysis showed that MDZ formation rates for LFD and HFD samples were 5.13 ± 4 and 2.01 ± 0.5 nmol/mg. protein/min, respectively. The Ugt activity was determined by determining the percent consumption of the UGT multienzyme substrate as described in “Materials and Methods.” Percent substrate consumed by HFD sample was 50% lower than that consumed by the LFD sample. This indicates that Ugt activity was lower in HFD mice, compared to LFD control. In addition, we also found that a short-term HFD for 2 weeks reduced Cyp3a11 and Ugt1a1 RNA levels (data not shown).
In order to determine the effects of high-fat diet on the expression of hepatic transporters, RNA levels of multidrug resistance-associated proteins (Mrps) 2 and 3 were determined by real-time PCR (Fig. 4). Mrp2 or Mrp3 RNA levels were not affected by the intake of diet high in fat in our mouse model. Furthermore, Mdr1b, one of two rodent homologues of the human Mdr1 gene, was also not altered in HFD mice compared to the LFD controls (Fig. 4). Taken together, we find RNA levels of the DMEs are significantly reduced in the livers of nutritionally obese mice compared with LFD mice. On the other hand, no changes were detected in the RNA levels of the key transporters in the two groups of mice we investigated in our study.
Fig. 4.
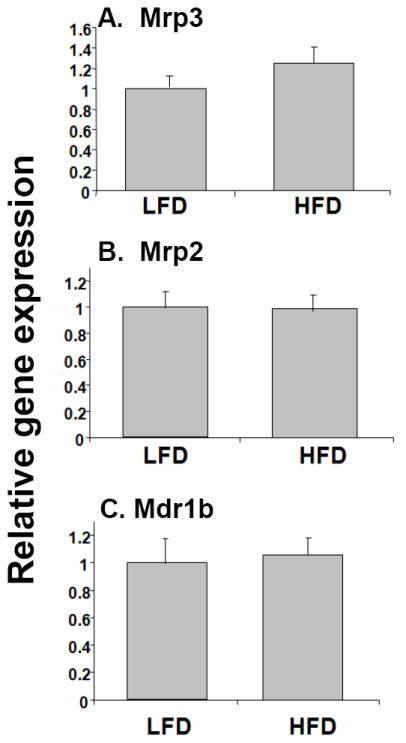
Effects of high fat diet on the expression of drug transporter genes. RNA was isolated from the livers of LFD and HFD mice (n=10-12 per group) and Mrp3 (A), Mrp2 (B), and Mdr1b (C) RNA levels were quantified by TaqMan® real-time PCR as described in Materials and methods. Data are presented as mean ± SD and normalized to cyclophilin RNA levels. The asterisks indicate p < 0.05 between LFD and HFD groups.
Regulation of expression of nuclear receptors by high-fat diet
It is well-established that the xenobiotic nuclear receptors, PXR and CAR heterodimerize with the central nuclear receptor, RXRα to bind to conserved sequences in the promoter regions of DME and transporter genes resulting in activation of these genes (Mangelsdorf et al, 1995a). RNA and protein levels of both PXR and CAR were reduced ~60% in the livers of mice fed with high-fat diet compared to the control LFD mice (Fig. 5). In contrast, RNA levels of RXRα were not affected by the consumption of a high fat diet. However, western blot analysis showed that nuclear protein levels of RXRα were significantly reduced in HFD mice compared to LFD mice (Fig. 5C and D). The reduction in expression of these regulatory nuclear receptors may contribute to the down-regulation of DMEs in HFD mice.
Fig. 5.
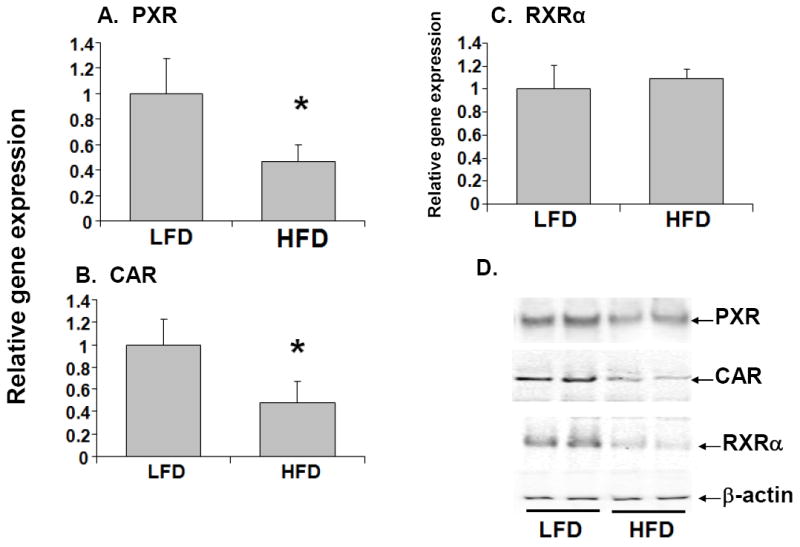
Effects of high fat diet on the expression of nuclear receptors. RNA was isolated from mouse livers (n=10-12 per group) and PXR (A), CAR (B), and RXRα (C) RNA levels were quantified by TaqMan® real-time PCR as described in Materials and methods. Data are presented as mean ± SD and normalized to cyclophilin RNA levels. RXRα protein expression was also analyzed by immunoblotting of nuclear extracts prepared from livers of mice (D). The asterisks indicate p < 0.05 between LFD and HFD groups.
Induction of proinflammatory cytokines and cell-signaling molecules by high-fat diet
It has been previously shown that the pro-inflammatory cytokines, IL-1β, TNFα and IL-6 are involved in regulation of the expression of hepatic genes (Aitken et al, 2006). We observed that RNA levels of IL-1β, TNFα and IL-6 were induced 2.5- to 3-fold in the livers of HFD mice compared to LFD mice (Fig. 6). These findings suggest that the down-regulation of DME genes by high fat diet may be associated with induction of pro-inflammatory cytokines in the liver. The cell-signaling components, JNK and NF-κB are known to regulate DME genes by cross-talk with nuclear receptors (Tan et al, 2004; Cai et al, 2005; Staudinger et al, 2008). Activation of JNK in the livers of HFD mice were detected by increased levels of phosphorylated JNK (P-JNK) in whole cell extracts (Fig. 6D). We examined NF-κB activation by determining the degree of degradation of the inhibitory subunit, IκBα, in the livers of LFD and HFD mice. We find that HFD mice showed decreased protein expression of IκBα, thus, increased activation of NF-κB compared to their control LFD counterparts (Fig. 6D).
Fig. 6.
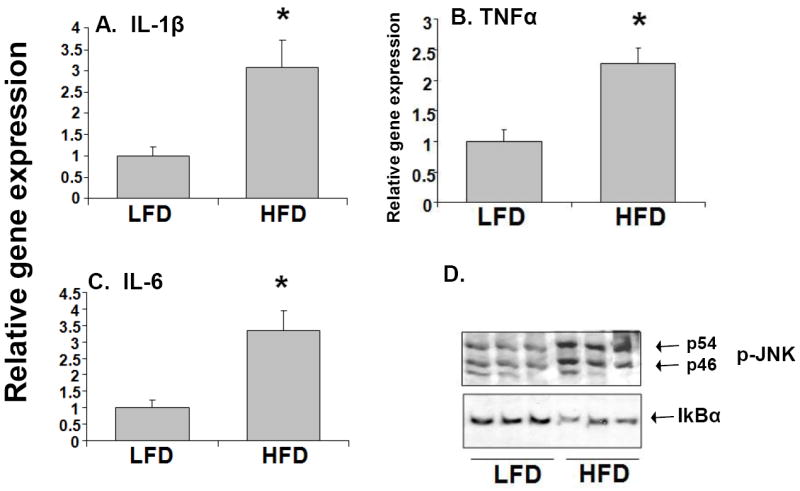
Effects of high fat diet on cytokine gene expression and on activation of NF-κB and JNK. RNA was isolated from the livers (n=10-12 per group) and IL-1β, (A), TNF-α (B), and IL-6 (C) RNA levels were quantified by TaqMan® real-time PCR as described in Materials and methods. Data are presented as mean ± SD and normalized to cyclophilin mRNA levels. Whole cell extracts were prepared from the livers of HFD and LFD mice and analyzed by immunoblotting (D). Phosphorylation of JNK (P-JNK) and degradation of IκBα, were measured as markers of JNK and NF-κB activation, respectively.
Regulation of Midazolam or Zoxazolamine pharmacodynamics by high-fat diet
To determine whether the transcriptional repression of Cyp3a11 resulted in altered Cyp3a-mediated drug metabolism, HFD and LFD mice were injected with the sleep-inducing drug Midazolam, which is predominantly metabolized by Cyp3a (Fig. 7A). Significantly prolonged sleeping times were observed in HFD mice compared with LFD mice. Interestingly, we find that sleep time induced by Zoxazolamine was not altered by HFD; this finding is in agreement with the fact that HFD had no effect on the RNA levels of Cyp1a2 and Cyp2e1, the main enzymes involved in Zoxazolamine metabolism (Fig. 7B). These results suggest that the pharmacological response to drugs can vary in the presence of obesity, and response to specific drugs may be affected depending on the specific enzymes which are affected in obesity.
Fig. 7.
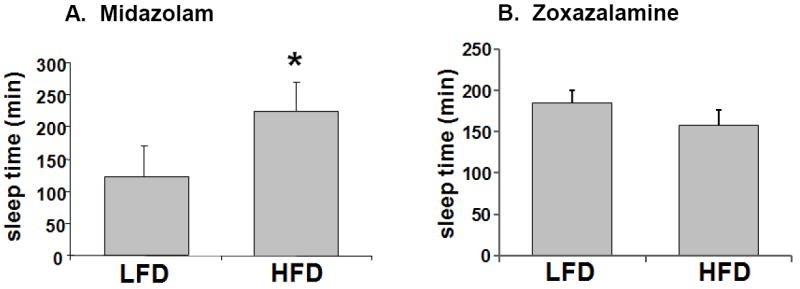
Effect of high fat diet on the length of sleep time induced by Midazolam or Zoxazolamine. LFD and HFD mice were fed diets with 10% and 60% kcal from fat respectively, for 14 weeks. LFD and HFD mice (n=6-8 per group) were injected intraperitoneally with 12 mg/kg bw of Midazolam (A) or 15 mg/kg bw of Zoxazolamine (B) and the duration of sleep time was determined.
Discussion
In this study we find that after 14-weeks of diet-induced weight gain, the gene expression of select phase I and II DMEs was altered in mice liver. Specifically, we found that Cyp3a11, Cyp2b10 and Cyp2a4 RNA levels were significantly reduced, while Cyp1a2 and Cyp2e1 were unaffected in HFD mice. In addition, RNA levels of the key hepatic phase II DMEs, Ugt1a1, Sult1a1 and Sultn were also reduced in HFD mice. Reduction in RNA levels corresponded to reductions in protein levels and activity of the prototypical phase I and II DMEs.
It is known that expression of DME genes is regulated by basal transcription factors and nuclear receptors (PXR, CAR and RXRα) (Mangelsdorf et al, 1995b; Rochette-Egly 2003). These nuclear receptors may be involved in the down-regulation of hepatic DME and transporter gene expression in HFD mice. Cyp2b10 is a prototypical CAR target gene, and Cyp2a4 and Sultn are known to be regulated only by CAR in mouse (Wei et al, 2000; Maglich et al, 2002). Since CAR expression was significantly reduced in HFD mice compared to LFD mice, CAR may have a role in reducing the expression of its target genes, Cyp2b10, Cyp2a4 and Sultn. Also, Cyp3a11 and the Mrp transporters have been shown to be regulated by both PXR and CAR, while Ugt1a1 and Mdr1b is known to be primarily regulated by PXR in mouse liver (Wei et al, 2000; Maglich et al, 2002). Although we did not see any changes in the expression of Mrp transporters, the decrease in PXR and CAR expression are for the most part consistent with the down regulation of target gene expression in our mouse diet-induced obesity model.
Our results are similar those of Yoshinari et al., who reported that Cyp3a11 was reduced, but Cyp1a2 and Cyp2e1 RNA levels were not changed by high fat feeding in ICR mice (Yoshinari et al, 2006). However, our observation that Cyp2b10 gene expression were reduced was not consistent with their findings (Yoshinari et al, 2006). Our HFD mice were fed diets with 60% kcal of fat for 14 weeks while Yoshinari et al. fed mice with 36% kcal of fat for 5 weeks (Yoshinari et al, 2006). Thus, the differences in experimental protocol may have contributed to this observation. There is a paucity of literature on the regulation of phase II DMEs in animal models of obesity, however, the induction of Ugt1a1 in BB Wistar rats which spontaneously develop diabetes has been reported (Braun et al, 1998). Similar to our findings, Osabe et al., also observed that a high fat diet had no significant effect on the protein levels of Mrp2 and Mrp3 in male Wistar rats (Osabe et al, 2008). Drug transporters play a central role in drug disposition and their activities may directly be modulated by cytokines as well as nuclear receptors (Teng et al, 2008). It has been reported that the expression Mdr1 is down-regulated in primary cultures of rat hepatocytes stimulated with IL-6 and mice treated with TNF-α results in the increased expression of Mdr1b (Teng et al, 2008). In this study, we did not observe any changes in RXRα gene expression; however, we did find a reduction in RXRα nuclear protein levels. This discrepancy between RXRα gene and protein expression may be due to post-translational modification of RXRα. We have previously shown that phosphorylation and rapid nuclear export of RXRα results in reduced nuclear levels of the protein in inflammation (Ghose et al, 2004; Zimmerman et al, 2006). A reduction in RXRα nuclear protein levels have been associated with reduced expression of DMEs, and may contribute to reductions in expression of hepatic genes in HFD mice (Ghose et al, 2004).
The reductions in expression of the nuclear receptors and DMEs and transporters in HFD mice were associated with induction of pro-inflammatory cytokines (IL-β, TNF-α and IL-6) and cell-signaling pathways in the liver. Obesity has been characterized by chronic, low-grade-inflammation (Shoelson et al, 2007), and recent evidence have demonstrated mechanistic links between fatty acids, inflammation and hepatic insulin resistance, which is an important underlying cause of metabolic syndrome (Shoelson et al, 2006). In animal models of inflammation, expression of hepatic DME and transporter genes was altered, and cross-talk between JNK and NF-κB with nuclear receptors have been reported (Tan et al, 2004; Cai et al, 2005; Staudinger et al, 2008). The involvement of IL-1β and NF-κB in the regulation of the expression CAR has been demonstrated in human hepatocytes treated with the bacterial endotoxin, lipolysaccharide (LPS), and activated mitogen-activated protein kinases (MAPKs) are known to directly phosphorylate nuclear receptors in the presence of inflammation (Pascussi et al, 2003; Staudinger et al, 2008). Since these cell-signaling pathways were also induced in HFD mice, it is plausible that a complex interplay between cytokines, cell-signaling and nuclear receptors may be contribute towards altered expression of DMEs and transporters.
The role of DMEs in the biotransformation of many drugs have been well studied as their associated substrates, inducers and inhibitors have been classified (Wilkinson 2005). Changes in the expression of DMEs in the presence of inflammation have been correlated with changes in enzyme activity and pharmacological response to therapeutic drugs (Wilkinson 2005). Therefore, to further substantiate our findings, we determined the effect of obesity on the duration of sleep time induced by Midazolam, which is predominantly metabolized by Cyp3a, and the paralysis time induced by Zoxazolamine, which is primarily metabolized by Cyp1a2 and Cyp2e1 (Liang et al, 1996; Olkkola et al, 2008). Our studies revealed that HFD mice had a significantly longer sleep time after Midazolam (Cyp3a11 substrate), but Zoxazolamine (Cyp2e1 and Cyp1a2 substrate) treatment had no effect on paralysis time in our diet-induced obesity mouse model. The prolonged sleep time induced by Midazolam in HFD mice indicates that the decreased expression of Cyp3a11 in the presence of obesity is indeed reflected in its pharmacodynamics. In contrast, the pharmacodynamics of Zoxazolamine was unaffected in HFD mice where Cyp1a2 and Cyp2e1 gene expression was not altered.
Animal models are invaluable in the investigation of various pathophysiological conditions and our studies in using a mouse diet-induced obesity model reveal that excess body weight can alter drug pharmacodynamics. However, it is important to be aware of the fact that obesity is a condition that results from the interaction between different genes and environmental factors and no single animal model may be able to capture its complexity. For our studies, we chose CD1 mice, an outbred strain derived from Lynch’s Swiss mice, which takes into account the genetic variation that exist between human population, as well as the polygenic nature of obesity (Chia et al, 2005). Several genes have been implicated in human obesity and studies in genetically obese mice which are derived from the disruption of a single gene need to be interpreted with caution as well. It is well known that there is a parallel between the regulation of some DMEs and drug transporter genes in mouse and humans, however, future studies in humans that corroborate our findings are needed. Also, our findings indicate that the modulation of DMEs in diet-induced obesity is associated with changes in nuclear receptor expression, cytokines and key signaling components. Further investigations that dissect the exact contribution of nuclear receptor expression, cytokines and key signaling components in obesity will be necessary in order to understand the mechanism of regulation of hepatic DMEs and transporters in obesity. In addition, metabolic changes associated with obesity and/or accumulation of specific lipid molecules may contribute to alterations in hepatic gene expression. The role of insulin resistance and liver disease related to obesity may be contributing factors to modification of DMEs and transporters and need to be further investigated.
Conclusion
In conclusion, we have shown that diet-induced obesity in a mouse model can result in changes in the expression of drug metabolizing enzymes which can ultimately alter drug pharmacodynamics. Furthermore, our results show that pro-inflammatory cytokines and cell-signaling components are induced in the livers of HFD mice. This suggests that reduction in hepatic gene expression in diet-induced obesity may be modulated by cross-talk between nuclear receptors and inflammation-induced cell-signaling. Within the limits of extrapolation from our mouse models, our studies suggest that, pharmacologically, obese patients may respond differently to drugs and their treatment regimen may need to be reevaluated as their hepatic gene expression may be compromised.
Acknowledgments
This work was supported by grants from the National Institutes of Health (K01DK076057-02) to R.G.
Footnotes
Publisher's Disclaimer: This is a PDF file of an unedited manuscript that has been accepted for publication. As a service to our customers we are providing this early version of the manuscript. The manuscript will undergo copyediting, typesetting, and review of the resulting proof before it is published in its final citable form. Please note that during the production process errors may be discovered which could affect the content, and all legal disclaimers that apply to the journal pertain.
References
- Aitken AE, Richardson TA, Morgan ET. Regulation of drug-metabolizing enzymes and transporters in inflammation. Annu Rev Pharmacol Toxicol. 2006;46:123–49. doi: 10.1146/annurev.pharmtox.46.120604.141059. [DOI] [PubMed] [Google Scholar]
- Blouin RA, Warren GW. Pharmacokinetic considerations in obesity. J Pharm Sci. 1999;88(1):1–7. doi: 10.1021/js980173a. [DOI] [PubMed] [Google Scholar]
- Braun L, Coffey MJ, Puskas F, Kardon T, Nagy G, Conley AA, Burchell B, Mandl J. Molecular basis of bilirubin UDP-glucuronosyltransferase induction in spontaneously diabetic rats, acetone-treated rats and starved rats. Biochem J. 1998;336(Pt 3):587–92. doi: 10.1042/bj3360587. [DOI] [PMC free article] [PubMed] [Google Scholar]
- Breslin WL, Strohacker K, Carpenter KC, Esposito L, McFarlin BK. Weight gain in response to high-fat feeding in CD-1 male mice. Lab Anim. 2010;44(3):231–7. doi: 10.1258/la.2010.009114. [DOI] [PubMed] [Google Scholar]
- Cai D, Yuan M, Frantz DF, Melendez PA, Hansen L, Lee J, Shoelson SE. Local and systemic insulin resistance resulting from hepatic activation of IKK-beta and NF-kappaB. Nat Med. 2005;11(2):183–90. doi: 10.1038/nm1166. [DOI] [PMC free article] [PubMed] [Google Scholar]
- Chen C, Staudinger JL, Klaassen CD. Nuclear receptor, pregnane X receptor is required for induction of UDP-glucoronosyltransferases in mouse liver by pregnenolone-16 alpha-carbonitrile. Drug Metab Dispos. 2003;31(7):908–15. doi: 10.1124/dmd.31.7.908. [DOI] [PubMed] [Google Scholar]
- Chen M, Xu D, Hu XL, Wang H. Effects of liver fibrosis on verapamil pharmacokinetics in rats. Clin Exp Pharmacol Physiol. 2008;35(3):287–94. doi: 10.1111/j.1440-1681.2007.04826.x. [DOI] [PubMed] [Google Scholar]
- Cheng Q, Aleksunes LM, Manautou JE, Cherrington NJ, Scheffer GL, Yamasaki H, Slitt AL. Drug-metabolizing enzyme and transporter expression in a mouse model of diabetes and obesity. Mol Pharm. 2008;5(1):77–91. doi: 10.1021/mp700114j. [DOI] [PubMed] [Google Scholar]
- Cheymol G. Effects of obesity on pharmacokinetics implications for drug therapy. Clin Pharmacokinet. 2000;39(3):215–31. doi: 10.2165/00003088-200039030-00004. [DOI] [PubMed] [Google Scholar]
- Chia R, Achilli F, Festing MF, Fisher EM. The origins and uses of mouse outbred stocks. Nat Genet. 2005;37(11):1181–6. doi: 10.1038/ng1665. [DOI] [PubMed] [Google Scholar]
- Collins S, Martin TL, Surwit RS, Robidoux J. Genetic vulnerability to diet-induced obesity in the C57BL/6J mouse: physiological and molecular characteristics. Physiol Behav. 2004;81(2):243–8. doi: 10.1016/j.physbeh.2004.02.006. [DOI] [PubMed] [Google Scholar]
- Ghose R, Mulder J, von Furstenberg RJ, Thevananther S, Kuipers F, Karpen SJ. Rosiglitazone attenuates suppression of RXRalpha-dependent gene expression in inflamed liver. J Hepatol. 2007;46(1):115–23. doi: 10.1016/j.jhep.2006.09.008. [DOI] [PMC free article] [PubMed] [Google Scholar]
- Ghose R, Zimmerman TL, Thevananther S, Karpen SJ. Endotoxin leads to rapid subcellular relocalization of hepatic RXRalpha: A novel mechanism for reduced hepatic gene expression in inflammation. Nucl Recept. 2004;2(1):4. doi: 10.1186/1478-1336-2-4. [DOI] [PMC free article] [PubMed] [Google Scholar]
- He P, Court MH, Greenblatt DJ, von Moltke LL. Factors influencing midazolam hydroxylation activity in human liver microsomes. Drug Metab Dispos. 2006;34(7):1198–207. doi: 10.1124/dmd.105.008904. [DOI] [PubMed] [Google Scholar]
- Hirosumi J, Tuncman G, Chang L, Gorgun CZ, Uysal KT, Maeda K, Karin M, Hotamisligil GS. A central role for JNK in obesity and insulin resistance. Nature. 2002;420(6913):333–6. doi: 10.1038/nature01137. [DOI] [PubMed] [Google Scholar]
- Irizar A, Barnett CR, Flatt PR, Ioannides C. Defective expression of cytochrome P450 proteins in the liver of the genetically obese Zucker rat. Eur J Pharmacol. 1995;293(4):385–93. doi: 10.1016/0926-6917(95)90059-4. [DOI] [PubMed] [Google Scholar]
- Itoh M, Adachi M, Yasui H, Takekawa M, Tanaka H, Imai K. Nuclear export of glucocorticoid receptor is enhanced by c-Jun N-terminal kinase-mediated phosphorylation. Mol Endocrinol. 2002;16(10):2382–92. doi: 10.1210/me.2002-0144. [DOI] [PubMed] [Google Scholar]
- Khemawoot P, Yokogawa K, Shimada T, Miyamoto K. Obesity-induced increase of CYP2E1 activity and its effect on disposition kinetics of chlorzoxazone in Zucker rats. Biochem Pharmacol. 2007;73(1):155–62. doi: 10.1016/j.bcp.2006.09.006. [DOI] [PubMed] [Google Scholar]
- Kim S, Sohn I, Ahn JI, Lee KH, Lee YS, Lee YS. Hepatic gene expression profiles in a long-term high-fat diet-induced obesity mouse model. Gene. 2004;340(1):99–109. doi: 10.1016/j.gene.2004.06.015. [DOI] [PubMed] [Google Scholar]
- Leclercq IA, Field J, Enriquez A, Farrell GC, Robertson GR. Constitutive and inducible expression of hepatic CYP2E1 in leptin-deficient ob/ob mice. Biochem Biophys Res Commun. 2000;268(2):337–44. doi: 10.1006/bbrc.2000.2125. [DOI] [PubMed] [Google Scholar]
- Liang HC, Li H, McKinnon RA, Duffy JJ, Potter SS, Puga A, Nebert DW. Cyp1a2(-/-) null mutant mice develop normally but show deficient drug metabolism. Proc Natl Acad Sci U S A. 1996;93(4):1671–6. doi: 10.1073/pnas.93.4.1671. [DOI] [PMC free article] [PubMed] [Google Scholar]
- Maglich JM, Stoltz CM, Goodwin B, Hawkins-Brown D, Moore JT, Kliewer SA. Nuclear pregnane x receptor and constitutive androstane receptor regulate overlapping but distinct sets of genes involved in xenobiotic detoxification. Mol Pharmacol. 2002;62(3):638–46. doi: 10.1124/mol.62.3.638. [DOI] [PubMed] [Google Scholar]
- Mangelsdorf DJ, Evans RM. The RXR heterodimers and orphan receptors. Cell. 1995a;83(6):841–50. doi: 10.1016/0092-8674(95)90200-7. [DOI] [PubMed] [Google Scholar]
- Mangelsdorf DJ, Thummel C, Beato M, Herrlich P, Schutz G, Umesono K, Blumberg B, Kastner P, Mark M, Chambon P, Evans RM. The nuclear receptor superfamily: the second decade. Cell. 1995b;83(6):835–9. doi: 10.1016/0092-8674(95)90199-x. [DOI] [PMC free article] [PubMed] [Google Scholar]
- McFarlin BK, Strohacker KA, Kueht ML. Pomegranate seed oil consumption during a period of high-fat feeding reduces weight gain and reduces type 2 diabetes risk in CD-1 mice. Br J Nutr. 2009;102(1):54–9. doi: 10.1017/S0007114508159001. [DOI] [PubMed] [Google Scholar]
- Olkkola KT, Ahonen J. Midazolam and other benzodiazepines. Handb Exp Pharmacol. 2008;(182):335–60. doi: 10.1007/978-3-540-74806-9_16. [DOI] [PubMed] [Google Scholar]
- Osabe M, Sugatani J, Fukuyama T, Ikushiro S, Ikari A, Miwa M. Expression of hepatic UDP-glucuronosyltransferase 1A1 and 1A6 correlated with increased expression of the nuclear constitutive androstane receptor and peroxisome proliferator-activated receptor alpha in male rats fed a high-fat and high-sucrose diet. Drug Metab Dispos. 2008;36(2):294–302. doi: 10.1124/dmd.107.017731. [DOI] [PubMed] [Google Scholar]
- Pascussi JM, Dvorak Z, Gerbal-Chaloin S, Assenat E, Maurel P, Vilarem MJ. Pathophysiological factors affecting CAR gene expression. Drug Metab Rev. 2003;35(4):255–68. doi: 10.1081/dmr-120026394. [DOI] [PubMed] [Google Scholar]
- Pascussi JM, Gerbal-Chaloin S, Pichard-Garcia L, Daujat M, Fabre JM, Maurel P, Vilarem MJ. Interleukin-6 negatively regulates the expression of pregnane X receptor and constitutively activated receptor in primary human hepatocytes. Biochem Biophys Res Commun. 2000;274(3):707–13. doi: 10.1006/bbrc.2000.3219. [DOI] [PubMed] [Google Scholar]
- Ramadori G, Armbrust T. Cytokines in the liver. Eur J Gastroenterol Hepatol. 2001;13(7):777–84. doi: 10.1097/00042737-200107000-00004. [DOI] [PubMed] [Google Scholar]
- Rochette-Egly C. Nuclear receptors: integration of multiple signalling pathways through phosphorylation. Cell Signal. 2003;15(4):355–66. doi: 10.1016/s0898-6568(02)00115-8. [DOI] [PubMed] [Google Scholar]
- Shoelson SE, Herrero L, Naaz A. Obesity, inflammation, and insulin resistance. Gastroenterology. 2007;132(6):2169–80. doi: 10.1053/j.gastro.2007.03.059. [DOI] [PubMed] [Google Scholar]
- Shoelson SE, Lee J, Goldfine AB. Inflammation and insulin resistance. J Clin Invest. 2006;116(7):1793–801. doi: 10.1172/JCI29069. [DOI] [PMC free article] [PubMed] [Google Scholar]
- Staudinger JL, Lichti K. Cell signaling and nuclear receptors: new opportunities for molecular pharmaceuticals in liver disease. Mol Pharm. 2008;5(1):17–34. doi: 10.1021/mp700098c. [DOI] [PMC free article] [PubMed] [Google Scholar]
- Surwit RS, Kuhn CM, Cochrane C, McCubbin JA, Feinglos MN. Diet-induced type II diabetes in C57BL/6J mice. Diabetes. 1988;37(9):1163–7. doi: 10.2337/diab.37.9.1163. [DOI] [PubMed] [Google Scholar]
- Tan Z, Huang M, Puga A, Xia Y. A critical role for MAP kinases in the control of Ah receptor complex activity. Toxicol Sci. 2004;82(1):80–7. doi: 10.1093/toxsci/kfh228. [DOI] [PubMed] [Google Scholar]
- Teng S, Piquette-Miller M. Regulation of transporters by nuclear hormone receptors: implications during inflammation. Mol Pharm. 2008;5(1):67–76. doi: 10.1021/mp700102q. [DOI] [PubMed] [Google Scholar]
- Van Heek M, Compton DS, France CF, Tedesco RP, Fawzi AB, Graziano MP, Sybertz EJ, Strader CD, Davis HR., Jr Diet-induced obese mice develop peripheral, but not central, resistance to leptin. J Clin Invest. 1997;99(3):385–90. doi: 10.1172/JCI119171. [DOI] [PMC free article] [PubMed] [Google Scholar]
- Wang T, Shankar K, Ronis MJ, Mehendale HM. Mechanisms and outcomes of drug- and toxicant-induced liver toxicity in diabetes. Crit Rev Toxicol. 2007;37(5):413–59. doi: 10.1080/10408440701215100. [DOI] [PubMed] [Google Scholar]
- Wei P, Zhang J, Egan-Hafley M, Liang S, Moore DD. The nuclear receptor CAR mediates specific xenobiotic induction of drug metabolism. Nature. 2000;407(6806):920–3. doi: 10.1038/35038112. [DOI] [PubMed] [Google Scholar]
- Wilkinson GR. Drug metabolism and variability among patients in drug response. N Engl J Med. 2005;352(21):2211–21. doi: 10.1056/NEJMra032424. [DOI] [PubMed] [Google Scholar]
- Yang CS, Brady JF, Hong JY. Dietary effects on cytochromes P450, xenobiotic metabolism, and toxicity. Faseb J. 1992;6(2):737–44. doi: 10.1096/fasebj.6.2.1537464. [DOI] [PubMed] [Google Scholar]
- Yoshinari K, Takagi S, Yoshimasa T, Sugatani J, Miwa M. Hepatic CYP3A expression is attenuated in obese mice fed a high-fat diet. Pharm Res. 2006;23(6):1188–200. doi: 10.1007/s11095-006-0071-6. [DOI] [PubMed] [Google Scholar]
- Zimmerman TL, Thevananther S, Ghose R, Burns AR, Karpen SJ. Nuclear export of retinoid X receptor alpha in response to interleukin-1beta-mediated cell signaling: roles for JNK and SER260. J Biol Chem. 2006;281(22):15434–40. doi: 10.1074/jbc.M508277200. [DOI] [PubMed] [Google Scholar]