

Abstract
An isochorismate-pyruvate lyase with adventitious chorismate mutase activity from Pseudomonas aerugionsa (PchB) achieves catalysis of both pericyclic reactions in part by the stabilization of reactive conformations and in part by electrostatic transition-state stabilization. When the active site loop Lys42 is mutated to histidine, the enzyme develops a pH dependence corresponding to a loss of catalytic power upon deprotonation of the histidine. Structural data indicate that the change is not due to changes in active site architecture, but due to the difference in charge at this key site. With loss of the positive charge on the K42H sidechain at high pH, the enzyme retains lyase activity at approximately 100-fold lowered catalytic efficiency, but loses detectable mutase activity. We propose that both substrate organization and electrostatic transition state stabilization contribute to catalysis. However, the dominant reaction path for catalysis is dependent on reaction conditions, which influence the electrostatic properties of the enzyme active site amino acid sidechains.
The physiological function of the isochorismate-pyruvate lyase (PchB) from Pseudomonas aeruginosa is to convert isochorismate to salicylate and pyruvate (1). The salicylate is ultimately incorporated into the siderophore pyochelin from Pseudomonas aeruginosa for iron scavenging in iron-limiting environments. PchB cleaves pyruvate from isochorismate with quantitative hydrogen transfer from C2 to C9 (Figure 1A) (2), and this reaction has been proposed on computational grounds to be pericyclic (3). Pericyclic reactions have a transition state that is cyclic and bond breaking and formation are concerted, though not necessarily synchronous (bond breaking may proceed faster than bond formation, or the converse). PchB is an intertwined dimer with two equivalent active sites, with each monomer comprising three helices (4). Each active site is composed of residues from both monomers, with sidechains derived from the helices and a mobile loop connecting helices one and two. PchB is a structural homologue of the E. coli chorismate mutase (EcCM) (4) and has non-physiological chorismate mutase activity, albeit with considerably lower catalytic efficiency than for the lyase activity (1, 5). The mutase reaction is a Claisen rearrangement of chorismate to prephenate in which the pyruvylenol tail is transferred from a C3 ether linkage to a C1-C9 linkage (Figure 1B) (6). Therefore, PchB catalyzes two pericyclic reactions, which are unusual in biology.
Figure 1.

Pericyclic reactions catalyzed by PchB. A, isochorismate-pyruvate lyase, a quantitative hydrogen transfer from C2 to C9. B, chorismate mutase, a Claisen rearrangement shifting the pyruvylenol tail from C3 to C1.
The source of catalytic power for the chorismate mutases is a matter of debate, and by extension this is true for PchB as well. Chorismate mutases catalyze the unimolecular rearrangement of substrate to form product, and the reaction does not involve an enzyme-substrate covalent intermediate or acid/base chemistry. Therefore, it has been argued that the enzyme active site is merely a vessel which orients the enolpyruvyl tail over the ring such that the reaction is accelerated (7-11). This is accomplished by the strategic placement of two arginines deep within the cavity. According to this view, the arginine residues align the substrate carboxylates, thereby forming a reactive substrate conformation (or near attack conformation, NAC) which could provide the driving force for catalysis.
A counter argument is that the orientation of the substrate in the enzyme-substrate complex is not a part of the catalytic picture. Instead, a positively charged amino acid strategically placed near the ether oxygen of bond breakage provides a stabilizing effect for the developing negative charge (6, 12-21) and, of course, the arginine-carboxylate interaction would be present and possibly intensified in the transition state. Quantum mechanical/molecular mechanical calculations are in agreement with activation enthalpies and free energies from experiment and indicate that catalysis is due to a combination of conformational effects and electrostatic transition state stabilization (18, 19, 22). Mutation of this positively charged active site amino acid in the chorismate mutases had catastrophic functional effects (13, 15, 17, 23, 24). The reaction that is usually accelerated by more than a million-fold becomes undetectable. However, the limited experimental structural evidence (circular dichroism) suggested that the secondary structure of the E. coli mutant enzyme was not maintained so some or all of the loss of catalytic activity could have been caused by loss of structural integrity rather than loss of the electrostatic interaction (17).
Lys42 of PchB is the only active site amino acid found in the mobile loop between helices one and two (4), and is the positively charged amino acid comparable to that in the chorismate mutases hypothesized to be important in electrostatic stabilization of the transition state. Recent work has shown that mutation at the 42 site does not alter the active site architecture in PchB (5), as evidenced by comparable circular dichroism spectra of WT and K42-mutant enzymes and the X-ray crystallographic structure of K42A-PchB, which showed maintenance of active site architecture including the active site loop. The K42A-mutant protein demonstrated a 100-fold decrease in both the lyase and mutase activities. Active site mutations showed covariant changes in kcat/Km for the two activities, suggesting that the transition states of the rate determining steps for both activities are electrostatically and structurally similar. Unexpectedly, mutational effects at the active site on kcat showed no correlation between the two activities, indicating that there are alternate reaction pathways for the two activities and a structural lack of similarity between either the reactant or transition states for the two activities. The importance of the charged amino acid at the 42 site is further investigated in this work. We report here the pH profiles for both the mutase and lyase activities of the wild-type enzyme and of several mutant forms of the enzyme (K42A, K42H and K42E) and the structures of the wild-type and K42E mutant form, both with the products of the lyase reaction (salicylate and pyruvate) bound.
Materials and Methods
Protein preparation
Wild-type PchB without a histidine tag was prepared as previously described (4). K42H-, K42A- and K42E-PchB were prepared as previously described (5).
Preparation of isochorismate and chorismate
Isochorismate was isolated from K. pneumoniae 62-1 harboring the entC plasmid pKS3-02 (25) with only minor changes, as described previously (5). Chorismate (Sigma, 60-80% pure) was recrystallized as previously described (26).
Measurement of isochorismate-pyruvate lyase initial velocities (Figure 2)
Figure 2.
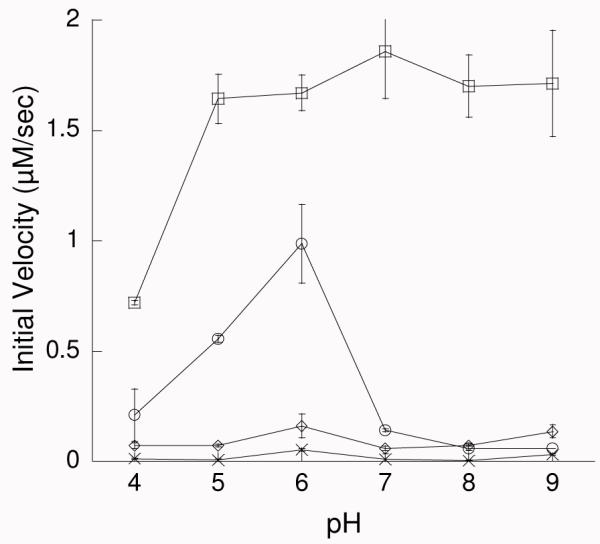
pH dependence of the initial velocities of the lyase activity for wildtype (□), K42H (○), K42A (◇) and K42E (×). All reactions were carried out at room temperature (22 °C) with 5.3 μM enzyme (wildtype or mutant) and initiated by the addition of 150 μM isochorismate.
Initial velocities for the production of salicylate were recorded at pH values from four to nine in steps of one pH unit for wild-type, K42H-, K42A- and K42E-PchB. A multicomponent buffer system was used to provide a constant ionic strength of 100 mM and to minimize salt effects: 50 mM formate, 50 mM MES, 100 mM TrisHCl, and adjusted to the appropriate pH with HCl or NaOH (27). All reactions were carried out at room temperature (25 °C) with 5.3 μM enzyme (wild-type or mutant), incubated in buffer for 10 min, and initiated with the addition of 150 μM isochorismate (saturating conditions) with a total reaction volume of 100 μL. The reactions were monitored for 50 s by the increase in fluorescence with an excitation wavelength of 300 nm and emission wavelength of 430 nm using Cary Eclipse fluorescence spectrometer (Varian). Data were plotted using Kaleidagraph (Synergy Software).
pH dependence of the kinetic parameters for the isochorismate-pyruvate lyase activity (Figures 3)
Figure 3.

Dependence of lyase kinetic parameters on pH. A) kcat – pH profiles and B) kcat/Km – pH profiles for WT (□) and K42H (○). The WT data were fit to eqn 1 (solid line) and for K42H to eqn 2 (dashed line).
Kinetic parameters for isochorismate-pyruvate lyase activity of wildtype and K42H-PchB were determined at pH values from 3.5 to 9.5 in steps of 0.5 pH units using the formate/MES/TrisHCl buffer described above. All reactions were carried out at room temperature with 1.5 μM enzyme (wildtype or mutant) incubated in buffer for 10 min, and initiated with the addition of 0.1 mM – 0.4 mM isochorismate. Product formation (initial velocity) was linear over the course of the experiment for all pH values tested. kcat and Km were calculated using SigmaPlot (SSPS, Inc.) and Kaleidagraph (Synergy Software).
pH dependence of the kinetic parameters for the chorismate mutase activity (Figure 4)
Figure 4.

Dependence of mutase kinetic parameters on pH. A) kcat – pH profiles for WT (□) and K42H (○). The WT data were fit to a simple linear regression (solid line) and for K42H to eqn 4 (dashed line). B) kcat/Km – pH profiles for WT (□) and K42H (○). The WT data were fit to eqn 1 (solid line) and for K42H to eqn 3 (dashed line).
Kinetic parameters for chorismate mutase activity of wildtype and K42H-PchB were determined in the formate/MES/TrisHCl buffer described above, at pH values ranging from 3.5 to 9.5 in steps of 0.5 pH units (however, there was no measurable activity over pH 8), and pH 7.0 to 8.0 in pH steps of 0.1. Protein concentrations varied per experiment from 90 μM to 900 μM per 100 μL run, with protein concentration increasing with pH, to optimize the signal-to-noise ratio. Reactions between pH 3.5 and 7 were carried out at room temperature. Temperature was kept constant for reactions from pH 7.0 to 8.0 using a Quantum Northwest TC 125 temperature controller set at 25° C. PchB wild-type and PchB K42H were incubated in the buffer for 10 minutes before each reaction. Reactions were initiated by the addition of the chorismate at concentrations ranging from 0.1 mM to 5.0 mM, and were mixed using a micropipette tip before placing the cuvette in the spectrophotometer. Initial velocities were determined by measuring the disappearance of chorismate at 310 nm (ε310 = 370 M−1 cm −1) using a UV Spectrophotometer (Cary 50 Bio, Varian). Substrate consumption was linear over the course of the experiment for those pH values that showed detectable activity. Michaelis-Menten kinetic data were fit by nonlinear regression. For experimental conditions at pH 7.5 and above, substrate concentrations were sub-saturating; therefore, kinetic constants were determined using Henderson and Dixon plots (28). All data were fit using KaleidaGraph (Synergy Software) or SigmaPlot (SSPS, Inc.).
Data analysis for pH studies
pH profiles of kcat and kcat/KM values for substrates were fit to equations 1-4. Plots for which the log of the parameter decreased at acidic pH with a slope of 1 were fit with equation 1:
Profiles in which the log of the plotted parameter decreased with a slope of 1 at acidic pH and decreased with a slope of −1 to a lower plateau value at basic pH were fit to equation 2:
Profiles in which the log of the plotted parameter decreased at basic pH with a slope of 2 were fit to equation 3:
Profiles in which the plotted parameter decreased at acidic pH with a slope of 1 and decreased at basic pH with a slope of 2 were fit to equation 4:
In equations 1-4, Y is the observed value (kcat or kcat/KM), c is a pH independent plateau value of Y, YL is a plateau value of Y at low pH, YH is a plateau value of Y at high pH, H is the proton concentration, and Ka1, Ka2 and Ka3 are the apparent dissociation constants for groups on the enzyme or substrate. Any data represented as a straight line is a simple linear regression.
Crystallization of WT and K42E PchB with salicylate and pyruvate
Crystallization was carried out using the hanging drop vapor diffusion method at 25° C. Salicylate and pyruvate were added to purified WT PchB (64 mg/ml) and K42E PchB (34 mg/ml) such that the ligands were in 20-fold molar excess, and the solution was incubated on ice for 30 min. Drops containing 1 μL of the WT/reaction product solution were mixed with 1 μL of a reservoir solution containing 0.2 M lithium sulfate, 0.1 M sodium acetate (pH 4.5) and 6% glycerol. WT parallelepiped crystals grew to ~ 0.12 mm × 0.12 mm × 0.05 mm within twenty-four hours. Drops containing 1 μL of the K42E/reaction product solution were mixed with 1 μL of a reservoir solution containing 0.004 M gly-gly, 0.100 M sodium acetate (pH 3.6) and 12% glycerol. K42E parallelepiped crystals grew to ~ 0.06 mm × 0.06 mm × 0.04 mm in two days.
Collection of crystallographic data
A crystal of WT or K42E PchB was transferred to a drop of mother liquor containing 20 – 32% (v/v) glycerol and flash cooled to −180° C with liquid nitrogen. Diffraction data were collected remotely at beam line 9-2 at the Stanford Synchrotron Radiation Lightsource. For WT, the collected diffraction images consisted of 1° oscillations with an exposure time of 20 sec and a detector distance of 290 mm. For K42E, the collected diffraction images consisted of 1° oscillations with an exposure time of 15 sec and a detector distance of 100 mm. The diffraction data was indexed and scaled using the XDS program package (29).
Structure determination
Structure determination was performed by molecular replacement for both WT and K42E PchB using Phaser from the CCP4 suite (30) and the PchB pyruvate-bound structure (2H9D) as a model (4) with the water and ligands omitted. The model building and refinement were conducted with Coot (31), Phenix (32) and REFMAC5 (33).
Crystallographic models
The final model for wildtype PchB contains one dimer per asymmetric unit. Monomers A and B are both composed of residues 2 – 98. Included in the model are one salicylate and one pyruvate per active site (therefore, two each total) and 44 waters. A Ramachandran plot generated in PROCHECK (34) shows that the model exhibits good geometry, with 96.5% of the residues in the most favored regions, 2.3% of the residues in the additionally allowed regions, and 1.2% in the generously allowed regions. The residue that is generously allowed is Ala50 of the A monomer (the B monomer has similar Φ and Ψ angles, but falls in the additionally allowed regions). Ala50 of the A monomer is found in well-defined density, and is between two prolines (Pro49-Ala50-Pro51).
The final model for K42E-PchB contains one dimer per asymmetric unit. Monomer A is composed of residues 1 – 97 and Monomer B has residues 1 – 41 and 48 – 97. A portion of the active site loop is disordered and not built in the B monomer, which has been documented previously for other PchB structures (4, 5). Included in the model are one salicylate and one pyruvate per active site (therefore, two each total) and 44 waters. A Ramachandran plot generated shows that the model exhibits good geometry, with 98.8% of the residues in the most favored regions and 1.2% of the residues in the generously allowed regions. The generously allowed amino acid is again Ala50. Data collection and refinement statistics can be found in Table 1.
Table 1. Crystallographic Statistics.
| WT | K42E | |
|---|---|---|
| Data Collection | ||
| Resolution Range (Å)1 | 31.71 - 1.95 (2.06 - 1.95) | 25.89 - 1.79 (1.84 - 1.79) |
| Space Group | P22121 | P21212 |
| Unit Cell (Å) | a = 47.3, b = 60.3, c = 60.6 |
a = 46.1, b = 57.3, c = 60.3 |
| Observations | ||
| Unique | 12,438 | 15,294 |
| Total | 45,612 | 54,206 |
| Completeness (%) | 95.6 (97.1) | 97.2 (97.9) |
| Rsym2 | 0.058 (0.226) | 0.098 (0.375) |
| ⟨1/σ(I)⟩ | 15.4 (5.2) | 5.7 (2.0) |
| Refinement | ||
| Resolution Range (Å) | 31.71 - 1.95 (2.00 - 1.95) | 25.89 - 1.79 (1.84 - 1.79) |
| Number of Reflections | 11177 (801) | 13690 (991) |
| R-factor 3 | 0.23 (0.26) | 0.21 (0.29) |
| Rfree4 | 0.29 (0.38) | 0.26 (0.41) |
| Dimers/asymmetric unit | 1 | 1 |
| Number of atoms | ||
| Protein, nonhydrogen | 1570 | 1529 |
| Nonprotein | 76 | 76 |
| R.m.s. deviations | ||
| Length (Å) | 0.011 | 0.022 |
| Angles (°) | 1.21 | 1.87 |
| Overall B factor (Å2) | 16.3 | 20.9 |
| Protein | 16.3 | 20.6 |
| Salicylate and pyruvate | 14.8 | 27.0 |
| Water | 18.3 | 26.0 |
Values in parentheses are for the highest resolution shell.
Rsym = Σ | I obs - I avg | /Σ I obs where the summation is overall reflections.
Rfactor = Σ | Fo - Fc | /Σ Fo.
For calculation of Rfree, 10.0% (WT), and 10.1% (K42E) of the reflections were reserved.
Structural analysis
All root-mean-square deviations were calculated using LSQMAN in the DEJAVU program package (35).
Protein Data Bank Submission
The atomic coordinates and structure factors (entries 3REM and 3RET) have been deposited in the Protein Data Bank, Research Collaboratory for Structural Bioinformatics, Rutgers University, New Brunswick, NJ.
Calculation of ΔΔG≠
The “mutational effect” was determined by dividing kcat/Km value or kcat value of the mutant enzyme by that of the wild type, as done previously (5). The ΔΔG‡ was calculated from the equation:
Results
Initial velocity data of WT and mutant PchB
As an initial experiment, the isochorismate-pyruvate lyase activity of wild type and mutant PchB (K42A, K42E, and K42H) was determined by monitoring the accumulation of the product salicylate by fluorescence over a range of pH values. The initial velocities at saturating isochorismate concentrations are plotted versus pH (Figure 2). K42E displayed no detectable activity at any pH tested. WT and K42A were active across the entire pH range from 4 to 9, with a constant level of activity at pH 5 and above (within experimental error) as expected based on previous work (5). Only the K42H velocity changed significantly as a function of pH in the range of the expected pKa of the sidechain.
pH dependence of lyase activity
The effect of pH on the kcat and kcat/KM values was determined over the pH range from 3.5 to 9.5 using a buffer system that maintained a constant ionic strength over the entire pH range. The WT kinetic parameters were plotted as a function of pH and the resulting profile showed a decrease with decreasing pH with a slope of 1 (Figure 3). Fitting of these data to equation 1 indicated one group with a pKa1 of 2.78 ± 0.02 (kcat) or 2.79 ± 0.08 (kcat/KM) that must be protonated for efficient catalysis (Table 2). We attribute this pKa1 value to the isochorismate substrate (calculated pKa = 3.6 (36)). K42H was active over the same pH range. Whereas the wild type values for kcat and kcat/KM remained constant at pH values over 4.5, the kinetic parameters for K42H peaked at pH 5, and then decreased until pH 7 at which point they maintained a constant value until pH 9. These data were fit to equation 2, and indicated a comparable pKa1 of 3.04 ± 0.00 (kcat) or 3.00 ± 0.01 (kcat/KM) for isochorismate. A second ionizable group must be protonated for most efficient catalysis and displays a slope of −1 between pH 6 and 7. We attribute this to the histidine of the active site K42H mutation, since this is not evident in the WT protein (PchB contains one naturally occurring histidine which is on the protein surface). pKa2 values calculated for this group are 6.65 ± 0.13 (kcat) or 6.29 ± 0.00 (kcat/KM). Therefore, the positive charge at the 42 position significantly promotes catalysis: ~5-fold difference in kcat, and greater than a 100-fold difference in kcat/KM at high pH between WT and K42H when the histidine is not protonated. Nevertheless, there is a significant contribution to catalysis unrelated to the positive charge allowing for lyase activity when the active site histidine is not protonated.
Table 2. pH Profiles for wild-type and mutant PchB.
| Activity | Protein | Kinetic parameter (Y) |
pK values and kinetic constants |
Titratable group | |
|---|---|---|---|---|---|
| isochorismate- pyruvate lyase |
WT | k cat | c | 0.90±0.01 | |
| pK a1 | 2.78 ± 0.02 | isochorismate | |||
| k cat/K M | c | 4.17 ± 0.09 | |||
| pK a1 | 2.79 ± 0.08 | isochorismate | |||
| K42H | k cat | YL | 0.75 ± 0.02 | ||
| YH | 0.03 ± 0.07 | ||||
| pK a1 | 3.04 ± 0.00 | isochorismate | |||
| pK a2 | 6.65 ± 0.13 | His 42 | |||
| k cat/K M | YL | 3.40 ± 0.01 | |||
| YH | 1.90 ± 0.00 | ||||
| pK a1 | 3.00 ± 0.01 | isochorismate | |||
| pK a2 | 6.29 ± 0.00 | His 42 | |||
| chorismate mutase |
WT | k cat/K M | c | 2.0 ± 0.1 | |
| pK a1 | 2.7 ± 0.0 | chorismate | |||
| K42H | k cat | c | 0.6 ± 0.1 | ||
| pK a1 | 3.6 ± 0.0 | chorismate | |||
| pK a2 | 7.7 ± 0.0 | His 42 | |||
| pK a3 | 8.5 ± 0.1 | ||||
| k cat/K M | c | 1.3 ± 0.2 | |||
| pK a1 | 9.0 ± 0.6 | ||||
| pK a2 | 6.1 ± 0.4 | His 42 | |||
pH dependence of mutase activity
WT was active across the entire pH range from 3.5 to 9.5. The WT mutase kinetic parameters were plotted as a function of pH and the resulting profile was fit by a simple linear regression (kcat) or as for the lyase reaction with equation 1 due to a decrease with decreasing pH with a slope of 1 (kcat/KM) (Figure 4). Fitting of the kcat/KM data indicated one group with a pKa1 of 2.7 ± 0.0 (kcat/KM) that must be deprotonated for efficient catalysis (Table 2). We attribute this pKa1 value to the chorismate substrate (calculated pKa = 3.6 (36)). The K42H mutase activity was limited by our ability to accurately measure such a slow reaction. Unlike the lyase activity, K42H had no detectable mutase activity above pH 7.8. The kcat for K42H peaked at pH 5.5, indeed the mutant enzyme was more active than WT in this pH range, and then decreased until pH 7.8. The mutase kcat data were fit to equation 4, where kcat decreases at low pH with a slope of 1 and decreases at around pH 7 with a slope of −2. This fit indicated a comparable pKa1 of 3.6 ± 0.00 (kcat) for chorismate and two enzymatic ionizable groups that eliminate activity when deprotonated with a pKa2 value of 7.7 ± 0.0 which is presumably the K42H sidechain, and also a pKa3 value of 8.5 ± 0.1. The kcat/KM – pH profile for the K42H mutase activity was best fit to an equation for two ionizable groups at neutral pH (equation 3). This fit indicated two enzymatic ionizable groups that eliminate activity when deprotonated with a pKa1 value of 9.0 ± 0.6 and a pKa2 value of 6.1 ± 0.4 which we attribute to the K42H sidechain. There was no detectable activity at pH values above 7.8, which may indicate that the positive charge at the 42 position is important for the mutase activity or may represent the limit of our ability to detect activity.
Structural information for WT and K42E PchB
Circular dichroism spectroscopy has been used previously to assess the secondary structure of PchB. Spectra for the three mutant forms of PchB tested in this work were found to be comparable to wild type with strong minima at 208 and 212 nm, characteristic of helical structure (5). Circular dichroism spectra at the extreme pH values (3.5 and 9.5) gave traces comparable to those previously reported (data not shown). WT PchB and mutants also crystallize into comparable structures from conditions ranging in pH values from 3.5 to 8.5 (4, 5). Two new structures are reported here: the WT structure with the products of the lyase reaction (salicylate and pyruvate) bound and the K42E structure with the same ligands (Figure 5). The K42A structure with the same ligands has been reported previously (5). The K42H protein crystallized and diffracted to better than 3 Ǻ resolution; however, the data were insufficient for structure solution (too highly mosaic) despite repeated trials. The root-mean-square deviations for all of these structures range from 0.42 – 0.66 Å for 96 – 97 of the 101 α-carbons, indicating the very high conservation of fold. A stereo image of the active site is displayed in Figure 5C to further emphasize that the active site of the K42E mutant enzyme and WT overlay precisely, and that the loss of activity in this mutant is not the result of changes in the active site architecture.
Figure 5.

WT and K42E structures. A. Cartoon of the WT (grey) and K42E-PchB (purple) active sites superimposed highlighting the conservation of secondary structure and active site loop conformations. Salicylate and pyruvate are shown as sticks, along with the active site residues displayed in panel C. B. 2Fo - Fc electron density map of the K42E active site contoured at 1.5 σ. The mutated residue is shown in yellow, the salicylate in grey and the pyruvate in orange. C. Close-up of the active site overlay in panel A (with cartoon removed for clarity) which shows the maintenance of conformation of the active site sidechains and the ligands. Figure generated using PyMol (41).
Discussion
Rationale of the K42H mutant
We have previously shown that mutation of the amino acid at the 42 site in PchB to a neutral sidechain (K42Q, K42A) caused ≥ 100-fold decrease in both mutase and lyase activity, whereas mutation to a negative sidechain (K42E) led to abrogation of detectable activity (5). We have also shown that the K42H mutation had differing kinetic constants at pH 5 and pH 7.5. Therefore, we proposed that study of this functional PchB mutant with a titratable charge could provide insight into the alternate reaction pathways of the pericyclic reactions catalyzed by the enzyme. Both reactions in the wild-type active site generate essentially pH-independent values of kcat and kcat/Km between pH 5 and 9.5 (Figures 3 and 4). This is consistent with both the reactive substrate conformation and electrostatic transition state stabilization hypotheses because the pKa of Lys42 may be >10. However, when Lys42 is mutated to histidine with an expected pKa of ~6, the values of all rate constants are somewhat reduced (with the exception of the kcat for the mutase activity which is actually greater at low pH) and develop a pH dependence corresponding to a loss of catalytic power upon deprotonation of the histidine. Furthermore, any difference in activity between the unprotonated histidine and the alanine mutant forms may be due to a difference in hydrogen bonding from the amino acid at this site and the substrate: hydrogen bonding between a lysine or histidine at this site may promote loop closure and formation of the proper substrate conformation for catalysis which is missing in the alanine mutant form.
Lyase activity
For the physiological lyase activity, the results are straightforward. Both WT and K42H demonstrated Michaelis-Menten kinetics over the entire pH range tested (3.5 – 9.5). kcat is titrated with pH, with an increase in the catalytic rate as the substrate isochorismate is deprotonated (pH 3.5 – 5). For only the mutant protein, there is a decrease in rate with the deprotonation of the mutant histidine (pH 5.5 – 7.5). This deprotonation event has a characteristic pKa for the histidine sidechain (~6.5), and a slope of −1, indicative of a change in a single ionizable group. Once a pH of 8 is reached, the catalytic rate again becomes stable. Over the pH range tested, the wildtype enzyme had a stable Km, whereas the Km of the K42H protein gradually increased. For K42H, the effects on kcat and Km over the pH range are comparable with about an order of magnitude change between the most active pH and the least.
Contribution of positive charge at 42 site to lyase activity
A valuable method for measuring ΔΔG for the enzyme substrate complex is the determine the Kd for the substrate. This approach provides information for reactions in which the ensemble of the ES complex for substrate binding is equivalent to that for the transition to the ES‡. This is valid for many systems but not for PchB, which is hypothesized to have a change in conformation (loop closure) between the ES and ES‡ and for which loop dynamics is proposed to be important in catalysis (37). However, we can easily measure kcat/Km and kcat to provide an alternate approach for determining the needed information for the ensemble ES sub-states involved in the catalytic cycle. A mutation may affect either or both of the two kinetic parameters kcat/Km and kcat. A mutational effect on kcat/Km reports on mutational changes in the free energy of the catalytic transition state versus mutational effects on the free energy of the kcat/Km reactant state: free enzyme and free substrate. A mutational effect on kcat reports on mutational changes in the free energy of the catalytic transition state versus mutational changes in the free energy of the reactant state for kcat, which is the enzyme-substrate complex.
We propose that the mutation from lysine to histidine is likely to have no substantial effect on the free energy of the free enzyme, since changes in the free energy would probably have structural consequences. Although we cannot derive the free energies from the structural observations, the extremely similar circular dichroism spectra and crystallographic structures for the wild-type and mutant enzymes illustrate that the active site architecture is conserved. Therefore, we argue that the free energies of the reactant states for kcat/Km (free enzyme) are relatively unchanged between wildtype and the K42H mutant. Calculations of the mutational effect at this site using kcat/Km yield the contribution of electrostatics for the 42 site. At pH 5.5, where K42H-PchB is most efficient, the kcat/Km mutational effect was 0.2, which represents a ΔΔG‡ of 1.0 kcal/mol, most likely the effect relative to sidechain shape and thus the position of the positive charge in the active site (Table 3). At pH 9, the kcat/Km mutational effect is 0.003, which represents a ΔΔG‡ of 3.4 kcal/mol resulting from contributions due to the loss of the positive charge and from an alteration in shape of the active site loop to accommodate the Lys to His change. Therefore, the loss of the positive charge at the 42 site contributes 2.4 kcal/mol (3.4 kcal/mol – 1.0 kcal/mol) and represents an experimentally determined free energy contribution from electrostatic transition state stabilization for the lyase activity. We would like to note that we have previously reported a mutational effect of 0.01 for the K42A mutation (ΔΔG‡ of 2.7 kcal/mol) which is in good agreement with the calculations here, and that the K42A-PchB structure showed a conservation of active site architecture (5).
Table 3. Contribution of positive charge at 42 site to lyase activity.
| pH |
kcat/K (M−1 s−1) |
mutational effect (mutant / WT) |
ΔΔG‡ (kcal/mol) |
kcat (min−1) |
mutational effect (mutant / WT) |
ΔΔG‡ (kcal/mol) |
Free Energy Contribution | |
|---|---|---|---|---|---|---|---|---|
| 9 | WT | 16,300 ± 700 | 6.5 ± 0.4 | two contributions from difference in protonated lysine versus unprotonated histidine (steric and charge) |
||||
| K42H | 47 ± 4 | 0.003 | 3.4 | 1.3 ± 0.1 | 0.2 | 0.95 | ||
| 5.5 | WT | 11,800 ± 100 | 9.2 ± 0.2 | one contribution from difference in protonated lysine and protonated histidine (steric only) |
||||
| K42H | 2,100 ± 100 | 0.18 | 1 | 7.1 ± 0.4 | 0.8 | 0.13 | ||
| 2.4 | 0.82 | subtraction of above contributions leaving only charge contribution |
The same calculations can be made relative to kcat (Table 3). The reactant state for these calculations is the enzyme-substrate complex, which in principle could be either stabilized or destabilized by the electrostatic charge between the wildtype and K42H mutant. At pH 5.5, the kcat mutational effect was 0.8, which represents a ΔΔG‡ of 0.13 kcal/mol, and at pH 9, the kcat mutational effect is 0.2, which represents a ΔΔG‡ of 0.95 kcal/mol. Therefore, the loss of the positive charge at the 42 site contributes 0.82 kcal/mol (0.95 kcal/mol – 0.13 kcal/mol) and represents a net free energy contribution for electrostatic transition state stabilization of the lyase activity from the enzyme-substrate complex to the transition state. In other words, this is the mutational change in free energy for the transition state corrected for the mutational change in the free energy of the reactant state (the enzyme-substrate complex). Since the ΔΔG‡ of the transition state between the wildtype and K42H mutant remains constant between the two calculations (2.4 kcal/mol), the enzyme-substrate complex (the reactant state of the kcat calculations) in the K42H mutant must be stabilized by roughly 1.6 kcal/mol relative to WT (2.4 kcal/mol – 0.82 kcal/mol).
Mutase activity
Analysis of the chorismate mutase activity is less straightforward: since there is no plateau at high pH, we cannot do a full analysis. If the lyase and mutase activities were covariant with respect to kcat, then we would expect a kcat of 0.3 min−1 at pH 9 for the mutase reaction (Figure 4A), which is well above our limit of detection. However, in agreement with our previous data (5), the two activities are not covariant for kcat, with differently shaped curves and no detectable mutase activity above pH 7.8. Nevertheless, the pH dependency of the mutase reaction for K42H kcat can be fit to a curve representing the deprotonation of the substrate from pH 3.5 to 5.5 (increasing kcat) and the deprotonation of the histidine and a second enzyme-derived ionizable group from pH 5.5 to 7.5 (decreasing kcat). Interestingly, from pH 4.5 to 6, the K42H has a larger kcat than the wildtype enzyme.
Contribution of enzyme-derived ionizable groups to mutase activity
The lyase and mutase covariance in kcat/Km shown previously (5) was not borne out by these pH profiles, with the caveat that we cannot determine kcat/Km for an enzyme that does not turnover detectably. It is tempting to hypothesize that the positive charge is required for mutase catalysis such that when the histidine is deprotonated the protein is no longer a catalyst. However, this hypothesis is confounded by two problems. First, the data could merely be limited by our ability to measure the very slow mutase reaction in the mutant enzyme above pH 7.8. Second, the curves fit in Figure 4 indicate there is a deprotonation of two ionizable groups. We assign one of these groups to the histidine at the mutated 42 site, in agreement with the lyase activity. The second ionizable group is also assumed to be enzyme-derived, and it is possible that this second ionization has an amplified effect on the poor mutase activity. There are two possibilities (that we can think of) for this ionizable group. First, within the active site, there are two arginines that charge-pair to the carboxylates of the substrate. If one of these arginines were to be deprotonated, then the substrate would not be as well-oriented in the active site, thereby slowing catalysis. However, the measured pKa values (8.5 – 9) would indicate a significant change from that of arginine in solution (12.5) and should reasonably also cause a similar effect on the lyase activity. A second, more favored hypothesis is that there is an ionizable group that is involved in protein structure stability. When this group is deprotonated, it is possible that a hydrogen bond or salt link is lost (or formed) that promotes enzyme stability (or flexibility) thereby slowing catalysis. While this change may be small and not evident in the robust lyase activity, a small change in structural stability or flexibility could play a major role in loss of the poor mutase activity.
Previous pH dependence studies on this enzyme
Combinatorial mutagenesis experiments of PchB identified Gln90 as an important residue in catalysis (38). This residue hydrogen bonds to the substrate/product (4), and is within hydrogen bonding distance to Lys42. Q90E activity was titrated by changing the pH: the enzyme was more efficient at low pH (kcat/Km) when the Glu was protonated and could thus interact with substrate (38). Interestingly, Q90E showed covariance for the two activities over the pH range tested (5-9), and changes in catalytic efficiency were due to changes in Km (kcat remained constant). This led to the conclusion that substrate binding is dependent on protonation of the glutamic acid, which mimics the naturally occurring glutamine at low pH. These data are consistent with EcCM, in which the homologous mutation could be rescued at low pH (17, 24). We propose an alternative hypothesis: since Q90E is within hydrogen bonding distance of Lys42, the previously reported change in catalytic efficiency may be an effect of a direct interaction between the two amino acids (Q90E and K42) at higher pH. This interaction would promote closing of the active site without substrate, change the Km, and not be related to the catalytic mechanism.
Enzyme catalysis
Formation of a reactive substrate conformation and electrostatic transition state stabilization have been argued to contribute equally to catalysis, accounting for the 9.1 kcal/mol difference between the B. subtilis chorismate mutase catalyzed and uncatalyzed mutase reactions (12): the ΔΔG‡ calculated by quantum mechanics/molecular modeling methods for the electrostatic transition state stabilization was 4.2 kcal/mol (12) and for the free energy cost of substrate preorganization was 3.8 – 5 kcal/mol (18, 20). The ΔΔG‡ of 2.4 kcal/mol for electrostatic transition state stabilization calculated herein using the K42H mutant is approximately a third of the free energy difference between the PchB catalyzed and uncatalyzed lyase reactions (7.43 kcal/mol) (39). This suggests that substrate preorganization is the more energetically costly of the two contributing factors. Of note, there is a considerable entropic penalty for transition from the enzyme-substrate complex to the transition state for this reaction. However, the entropic penalty has been argued to be compounded by the organization of the enzyme during active site loop closure, which may occur after the formation of the enzyme-substrate complex and concomitantly with substrate organization (39).
Conclusions
If the kcat/Km is covariant for the two activities over the pH range, then the pH dependence reflects the behavior of the free enzyme with both substrates. In other words, the transition states of the rate determining steps for the lyase and mutase activities should be structurally and electrostatically similar. However, we cannot detect activity in the K42H-mutant above pH 7.8, making it impossible to determine the kcat/Km at high pH for the mutase activity of the mutant enzyme. There are at least two reasons to believe that kcat/Km is not covariant for the two activities over the pH range. First, the transition state of the rate determining step cannot possibly be electrostatically similar at low and high pH for the K42H mutation if the residue at the 42 site is involved in catalysis. Second, the curves in Figures 3B and 4B are clearly not the same shape even ignoring our inability to measure activity at high pH for the mutant. Together, this may suggest a different level of contribution of this charged amino acid in the two activities.
Benkovic and colleagues (40) have proposed the “catalytic network” that provides for the ensemble conformation of a protein as a third dimension to the standard reaction coordinate. In this hypothesis, a reaction coordinate becomes a three dimensional “mountain range” and the authors note that reaction conditions, such as pH, may alter the dominant path from substrate to product (40). Since the reactant state for kcat/Km is the free enzyme, and our structural data suggest a conservation of the architecture of the reactant state, we propose that the path through the catalytic network is altered with changing pH. In the case of the lyase activity, a path from reactants to products is accessible at all of the values of pH tested; however, the efficiency of the reaction varies depending on the whether or not a positive charge is present to stabilize bond breaking at the ether oxygen. For the mutase activity, there may be no accessible path (no conformation in the sampled ensemble that promotes catalysis) without electrostatic transition state stabilization.
Acknowledgements
Diffraction data were collected at the Stanford Synchrotron Radiation Laboratory, a national user facility operated by Stanford University on behalf of the U.S. Department of Energy, Office of Basic Energy Sciences. The SSRL Structural Molecular Biology Program is supported by the Department of Energy, Office of Biological and Environmental Research, and by the National Institutes of Health, National Center for Research Resources, Biomedical Technology Program, and the National Institute of General Medical Sciences. We would like to thank the staff at the Stanford Synchrotron Radiation Laboratory for their support and assistance. We are grateful to Drs. T.C. Gamblin and R. N. De Guzman for equipment use, and to Dr. R. L. Schowen for insightful discussions.
Abbreviations and Full Textual Notes
- PchB
isochorismate-pyruvate lyase from Pseudomonas aeruginosa
- EcCM
chorismate mutase from E. coli
Footnotes
This publication was made possible by funds from the American Lung Association of Kansas and from the Kansas Masonic Cancer Research Institute, by the Graduate Training Program in Dynamic Aspects of Chemical Biology NIH grant number T32 GM08545 (J.O.) from the National Institute of General Medical Sciences, by NIH grant number P20 RR016475 from the INBRE Program of the National Center for Research Resources, and by NIH grants numbered R01 AI77725 and K02 AI093675 from the National Institute for Allergy and Infectious Disease.
References
- 1.Gaille C, Kast P, Haas D. Salicylate biosynthesis in Pseudomonas aeruginosa. Purification and characterization of PchB, a novel bifunctional enzyme displaying isochorismate pyruvate-lyase and chorismate mutase activities. J. Biol. Chem. 2002;277:21768–21775. doi: 10.1074/jbc.M202410200. [DOI] [PubMed] [Google Scholar]
- 2.DeClue MS, Baldridge KK, Kunzler DE, Kast P, Hilvert D. Isochorismate Pyruvate Lyase: A Pericyclic Reaction Mechanism? J. Am. Chem. Soc. 2005;127:15002–15003. doi: 10.1021/ja055871t. [DOI] [PubMed] [Google Scholar]
- 3.Marti S, Andres J, Moliner V, Silla E, Tunon I, Bertran J. Mechanism and plasticity of isochorismate pyruvate lyase: a computational study. J. Am. Chem. Soc. 2009;131:16156–16161. doi: 10.1021/ja905271g. [DOI] [PubMed] [Google Scholar]
- 4.Zaitseva J, Lu J, Olechoski KL, Lamb AL. Two crystal structures of the isochorismate pyruvate lyase from Pseudomonas aeruginosa. J. Biol. Chem. 2006;281:33441–33449. doi: 10.1074/jbc.M605470200. [DOI] [PubMed] [Google Scholar]
- 5.Luo Q, Olucha J, Lamb AL. Structure-function analyses of isochorismate-pyruvate lyase from Pseudomonas aeruginosa suggest differing catalytic mechanisms for the two pericyclic reactions of this bifunctional enzyme. Biochemistry. 2009;48:5239–5245. doi: 10.1021/bi900456e. [DOI] [PubMed] [Google Scholar]
- 6.Gustin DJ, Mattei P, Kast P, Wiest O, Lee L, Cleland WW, Hilvert D. Heavy Atom Isotope Effects Reveal a Highly Polarized Transition State for Chorismate Mutase. J. Am. Chem. Soc. 1999;121:1756–1757. [Google Scholar]
- 7.Hur S, Bruice TC. The mechanism of catalysis of the chorismate to prephenate reaction by the Escherichia coli mutase enzyme. Proc. Natl. Acad. Sci. U.S.A. 2002;99:1176–1181. doi: 10.1073/pnas.022628599. [DOI] [PMC free article] [PubMed] [Google Scholar]
- 8.Hur S, Bruice TC. The near attack conformation approach to the study of the chorismate to prephenate reaction. Proc. Natl. Acad. Sci. U.S.A. 2003;100:12015–12020. doi: 10.1073/pnas.1534873100. [DOI] [PMC free article] [PubMed] [Google Scholar]
- 9.Hur S, Bruice TC. Just a near attack conformer for catalysis (chorismate to prephenate rearrangements in water, antibody, enzymes, and their mutants) J. Am. Chem. Soc. 2003;125:10540–10542. doi: 10.1021/ja0357846. [DOI] [PubMed] [Google Scholar]
- 10.Hur S, Bruice TC. Comparison of formation of reactive conformers (NACs) for the Claisen rearrangement of chorismate to prephenate in water and in the E. coli mutase: the efficiency of the enzyme catalysis. J. Am. Chem. Soc. 2003;125:5964–5972. doi: 10.1021/ja0210648. [DOI] [PubMed] [Google Scholar]
- 11.Zhang X, Zhang X, Bruice TC. A definitive mechanism for chorismate mutase. Biochemistry. 2005;44:10443–10448. doi: 10.1021/bi050886p. [DOI] [PubMed] [Google Scholar]
- 12.Claeyssens F, Ranaghan KE, Manby FR, Harvey JN, Mulholland AJ. Multiple high-level QM/MM reaction paths demonstrate transition-state stabilization in chorismate mutase: correlation of barrier height with transition-state stabilization. Chem. Commun. 2005:5068–5070. doi: 10.1039/b508181e. [DOI] [PubMed] [Google Scholar]
- 13.Cload ST, Liu DR, Pastor RM, Schultz PG. Mutagenesis Study of Active Site Residues in Chorismate Mutase from Bacillus subtilis. J. Am. Chem. Soc. 1996;118:1787–1788. [Google Scholar]
- 14.Kast P, Asif-Ullah M, Hilvert D. Is chorismate mutase a prototypic entropy trap? -- activation parameters for the Bacillus subtilis enzyme. Tetrahedron Lett. 1996;37:2691–1694. [Google Scholar]
- 15.Kast P, Asif-Ullah M, Jiang N, Hilvert D. Exploring the active site of chorismate mutase by combinatorial mutagenesis and selection: the importance of electrostatic catalysis. Proc. Natl. Acad. Sci. U.S.A. 1996;93:5043–5048. doi: 10.1073/pnas.93.10.5043. [DOI] [PMC free article] [PubMed] [Google Scholar]
- 16.Kienhofer A, Kast P, Hilvert D. Selective stabilization of the chorismate mutase transition state by a positively charged hydrogen bond donor. J. Am. Chem. Soc. 2003;125:3206–3207. doi: 10.1021/ja0341992. [DOI] [PubMed] [Google Scholar]
- 17.Liu DR, Cload ST, Pastor RM, Schultz PG. Analysis of Active Site Residues in Escherichia coli Chorismate Mutase by Site-Directed Mutagenesis. J. Am. Chem. Soc. 1996;118:1789–1790. [Google Scholar]
- 18.Ranaghan KE, Mulholland AJ. Conformational effects in enzyme catalysis: QM/MM free energy calculation of the ‘NAC’ contribution in chorismate mutase. Chem. Commun. 2004:1238–1239. doi: 10.1039/b402388a. [DOI] [PubMed] [Google Scholar]
- 19.Ranaghan KE, Ridder L, Szefczyk B, Sokalski WA, Hermann JC, Mulholland AJ. Transition state stabilization and substrate strain in enzyme catalysis: ab initio QM/MM modelling of the chorismate mutase reaction. Org. Biomol. Chem. 2004;2:968–980. doi: 10.1039/b313759g. [DOI] [PubMed] [Google Scholar]
- 20.Strajbl M, Shurki A, Kato M, Warshel A. Apparent NAC effect in chorismate mutase reflects electrostatic transition state stabilization. J. Am. Chem. Soc. 2003;125:10228–10237. doi: 10.1021/ja0356481. [DOI] [PubMed] [Google Scholar]
- 21.Warshel A, Sharma PK, Kato M, Xiang Y, Liu H, Olsson MH. Electrostatic basis for enzyme catalysis. Chem Rev. 2006;106:3210–3235. doi: 10.1021/cr0503106. [DOI] [PubMed] [Google Scholar]
- 22.Claeyssens F, Harvey JN, Manby FR, Mata RA, Mulholland AJ, Ranaghan KE, Schutz M, Thiel S, Thiel W, Werner HJ. High-accuracy computation of reaction barriers in enzymes. Angew. Chem. Int. Ed. 2006;45:6856–6859. doi: 10.1002/anie.200602711. [DOI] [PubMed] [Google Scholar]
- 23.Kast P, Grisostomi C, Chen IA, Li S, Krengel U, Xue Y, Hilvert D. A strategically positioned cation is crucial for efficient catalysis by chorismate mutase. J. Biol. Chem. 2000;275:36832–36838. doi: 10.1074/jbc.M006351200. [DOI] [PubMed] [Google Scholar]
- 24.Zhang S, Kongsaeree P, Clardy J, Wilson DB, Ganem B. Site-directed mutagenesis of monofunctional chorismate mutase engineered from the E. coli P-protein. Bioorg. Med. Chem. 1996;4:1015–1020. doi: 10.1016/0968-0896(96)00099-5. [DOI] [PubMed] [Google Scholar]
- 25.Schmidt K, Leistner E. Microbial Production of (+)-trans-Isochorismic Acid. Biotech. & Bioeng. 1995;45:285–291. doi: 10.1002/bit.260450402. [DOI] [PubMed] [Google Scholar]
- 26.Rieger CE, Turnbull JL. Small scale biosynthesis and purification of gram quantities of chorismic acid. Preparative biochemistry & biotechnology. 1996;26:67–76. doi: 10.1080/10826069608000051. [DOI] [PubMed] [Google Scholar]
- 27.Gondry M, Lautru S, Fusai G, Meunier G, Menez A, Genet R. Cyclic dipeptide oxidase from Streptomyces noursei. Isolation, purification and partial characterization of a novel, amino acyl alpha,beta-dehydrogenase. Eur. J. Biochem. 2001;268:1712–1721. doi: 10.1046/j.1432-1033.2001.02038.x. [DOI] [PubMed] [Google Scholar]
- 28.Segel IH. Enzyme Kinetics: Behavior and Analysis of Rapid Equilibium and Steady State Enzyme Systems. John Wiley & Sons; New York: 1975. [Google Scholar]
- 29.Kabsch W. Xds. Acta. Crystallogr. D66:125–132. doi: 10.1107/S0907444909047337. [DOI] [PMC free article] [PubMed] [Google Scholar]
- 30.McCoy AJ, Grosse-Kunstleve RW, Storoni LC, Read RJ. Likelihood-enhanced fast translation functions. Acta Cryst. 2005;D61:458–464. doi: 10.1107/S0907444905001617. [DOI] [PubMed] [Google Scholar]
- 31.Emsley P, Cowtan K. Coot: model-building tools for molecular graphics. Acta Cryst. 2004;D60:2126–2132. doi: 10.1107/S0907444904019158. [DOI] [PubMed] [Google Scholar]
- 32.Adams PD, Afonine PV, Bunkoczi G, Chen VB, Davis IW, Echols N, Headd JJ, Hung LW, Kapral GJ, Grosse-Kunstleve RW, McCoy AJ, Moriarty NW, Oeffner R, Read RJ, Richardson DC, Richardson JS, Terwilliger TC, Zwart PH. PHENIX: a comprehensive Python-based system for macromolecular structure solution. Acta Crystallogr. D. D66:213–221. doi: 10.1107/S0907444909052925. [DOI] [PMC free article] [PubMed] [Google Scholar]
- 33.Winn MD, Isupov MN, Murshudov GN. Use of TLS parameters to model anisotropic displacements in macromolecular refinement. Acta Crystallogr. 2001;D57:122–133. doi: 10.1107/s0907444900014736. [DOI] [PubMed] [Google Scholar]
- 34.Laskowski R, MacArthur M, Moss D, Thornton J. PROCHECK: a program to check the stereochemical quality of protein structures. J. Appl. Cryst. 1993;26:283–291. [Google Scholar]
- 35.Kleywegt GJ, Jones TA. Detecting folding motifs and similarities in protein structures. Methods Enzymol. 1997;277:525–545. doi: 10.1016/s0076-6879(97)77029-0. [DOI] [PubMed] [Google Scholar]
- 36.Advanced Chemistry Development Software v8.14 for Solaris, calculated by Advanced Chemistry Development Software v8.14 for Solaris. 2009. [Google Scholar]
- 37.Luo Q, Olucha J, Lamb AL. Entropic and enthalpic components of catalysis in the mutase and lyase activities of Pseudomonas aeruginosa PchB. J. Am. Chem. Soc. 2011;133:7229–7233. doi: 10.1021/ja202091a. [DOI] [PMC free article] [PubMed] [Google Scholar]
- 38.Kunzler DE, Sasso S, Gamper M, Hilvert D, Kast P. Mechanistic insights into the isochorismate pyruvate lyase activity of the catalytically promiscuous PchB from combinatorial mutagenesis and selection. J. Biol. Chem. 2005;280:32827–32834. doi: 10.1074/jbc.M506883200. [DOI] [PubMed] [Google Scholar]
- 39.Luo Q, Olucha J, Lamb AL. Entropic and enthalpic components of catalysis in the mutase and lyase activities of Pseudomonas aeruginosa PchB. J. Am. Chem. Soc. 2011 doi: 10.1021/ja202091a. in press. [DOI] [PMC free article] [PubMed] [Google Scholar]
- 40.Benkovic SJ, Hammes GG, Hammes-Schiffer S. Free-energy landscape of enzyme catalysis. Biochemistry. 2008;47:3317–3321. doi: 10.1021/bi800049z. [DOI] [PubMed] [Google Scholar]
- 41.DeLano W. The PyMOL Molecular Graphics System, in www.pymol.org. DeLano Scientific; San Carlos, CA: 2002. www.pymol.org [Google Scholar]