

Abstract
Mathematical modeling and computational analysis are essential for understanding the dynamics of the complex gene networks that control normal development and homeostasis, and can help to understand how circumvention of that control leads to abnormal outcomes such as cancer. Our objectives here are to discuss the different mechanisms by which the local biochemical and mechanical microenvironment, which is comprised of various signaling molecules, cell types and the extracellular matrix (ECM), affects the progression of potentially-cancerous cells, and to present new results on two aspects of these effects. We first deal with the major processes involved in the progression from a normal cell to a cancerous cell at a level accessible to a general scientific readership, and we then outline a number of mathematical and computational issues that arise in cancer modeling. In Section 2 we present results from a model that deals with the effects of the mechanical properties of the environment on tumor growth, and in Section 3 we report results from a model of the signaling pathways and the tumor microenvironment (TME), and how their interactions affect the development of breast cancer. The results emphasize anew the complexities of the interactions within the TME and their effect on tumor growth, and show that tumor progression is not solely determined by the presence of a clone of mutated immortal cells, but rather that it can be ‘community-controlled’.
It Takes a Village – Hilary Clinton
Keywords: Tumor progression, mechanical effects, hybrid model, breast cancer
1 Introduction
1.1 What is cancer?
Cells embedded in an in vivo tissue continuously sense the biochemical and mechanical state of their environment, transduce the extracellular signals into intracellular signals, integrate these signals, and respond accordingly. The response at the cell level may involve changes in metabolic state, gene expression, growth, differentiation, cell division, cell movement, or apoptosis1. Maintenance of homeostasis at the tissue level involves the tissue-wide integration of and response to signals from within the tissue and its surroundings, and disruption at any of the detection, transduction or response steps may lead to neoplastic growth, i.e., abnormal, unchecked growth of the tissue, producing what is called a neoplasm or tumor. Tumors can be benign, pre-malignant or malignant, and when they become malignant they become a cancer. More precisely, cancer denotes diseases that give rise to abnormal cells that proliferate indefinitely, and that can invade nearby tissues and spread to other parts of the body through the blood and lymph systems. A decade ago Hanahan and Weinberg (2000) identified six essential characteristics of cancer that are summarized as follows.
Self-sufficiency in growth signals – normally cells require a signal to enter the proliferative state, and many oncogenes mimic such growth signals.
Insensitivity to anti-growth signals – where cells ignore the external and internal signals that regulate cell proliferation.
Evasion of apoptosis –where cells circumvent programmed cell death.
Unlimited ability to divide – in normal tissue cells typically double 50–80 times (the Hayfllick limit), but cancer cells can divide considerably more by, e. g., suppressing p53.
Sustained angiogenesis – tumor cells can induce production of capillary sprouts from nearby vessels, which then provide nutrients and a pathway to the circulatory system.
Tissue invasion and metastasis – without this characteristic tumors remain benign, but with it they can spread to other tissues and organs, via the circulatory system or the lymph system.
The first four of these are also characteristic of a benign tumor, while the fifth is a necessary condition for unlimited growth at the location where the tumor is initiated. Thus the primary characteristic of cancer cells is their ability to invade and metastasize. A summary of the steps and processes involved in metastasis, which distinguishes cancer from benign tumors, is shown in Figure 1. In the figure metastasis occurs via the circulatory system, but it can also occur via the lymphatic system. In either case, an essential characteristic of cancer cells is their ability to spread from the point of initiation.
Figure 1.

The major steps involved in metastasis. (From (Cotran et al., 1994), with permission)
There are numerous environmental causes of cancer, which is initiated with either mutations or viral or bacterial agents. Most tissues in the body can give rise to cancer, some even yield several types, and each cancer has unique features. A carcinoma is a cancer that begins in the skin or in tissues that line or cover internal organs. A sarcoma is a cancer that begins in bone, cartilage, fat, muscle, blood vessels, or other connective or supportive tissue. Leukemia is a cancer that starts in blood-forming tissue such as the bone marrow, and causes large numbers of abnormal blood cells to be produced and enter the blood. Lymphoma and multiple myeloma are cancers that begin in the cells of the immune system. Central nervous system cancers are cancers that begin in the tissues of the brain and spinal cord.
Given the complexity of normal embryonic development and the multitude of steps and checkpoints involved, it is unsurprising that there are numerous steps at which the homeostatic balance in a tissue can be upset. While the hallmarks of cancer listed earlier focus on properties of the cancer cells, cancer development in vivo is context-dependent in that environmental factors play a major role in the transition from normal cell to benign tumor to cancer. Our focus in the remainder of this section will be on identifying some of the key processes involved, discussing the role of mathematical modeling and computational analysis in their understanding, and briefly reviewing previous work.
1.2 The processes involved in the progression from the normal to the invasive phenotype
The four major steps in terms of cell mechanisms and processes that are involved in progression of a normal somatic cell to the metastasis-competent state are as follows.
Transformation and initiation
The first step in the progression involves multiple genetic changes that accumulate with successive cell divisions. This is facilitated by ‘immortalization’ of cells (the ability to divide indefinitely) via, e. g., activation of telomerase, an enzyme that prevents shortening of chromosomes during cell division. This can lead to clones capable of neoplastic growth wherein genetic errors can arise and accumulate with each cell division. It can also involve activation of growth promoting oncogenes, inactivation of cancer suppressor genes, and changes in the expression of genes that regulate apoptosis. For example, cells can be transformed by over expression of the proto-oncogenes c-Myc and Ras (Silvera et al., 2010), or alternatively, by down regulation of the tumor suppressor protein p53, which down regulates c-Myc and prevents the accumulation of telomerase (Sachdeva et al., 2009). This step is certainly stochastic and hence it is difficult to predict the outcome in individual cases.
Neoplastic growth
This is characterized by a higher than normal density at which growth saturates, usually lower than normal nutritional requirements in the growth medium, and loss of contact inhibition of growth. Tumor cells may face hypoxia, acidity, and limited nutrient availability as they grow, and some types have developed adaptive responses to cope with metabolic and other types of stress. Under normal conditions cells utilize the Krebs cycle for generating ATP, but tumor cells shift their metabolism toward high levels of glucose consumption and lactate production (the Warburg Effect) (Warburg, 1956; Kim & Dang, 2006). One adaptive response to ensure an adequate glucose supply is to stimulate angiogenesis (discussed later) in nearby vessels and to migrate toward these vessels. In this phase tumor cells may also produce chemoattractants to attract stromal cells such as macrophages to the tumor, which provide more growth factors. Thus tumor cells can pursue strategies of metabolic adaptation to survive periods of metabolic stress and maintain viability as cells accumulate (Jones & Thompson, 2009).
Numerous signal transduction pathways are involved in the control of growth and proliferation, but we focus on two widely-studied pathways – the transforming growth factor-β (TGF-β) pathway and the epidermal growth factor (EGF) pathway – that are sufficiently representative of how major pathways can interact in growth control. TGF-βs are polypeptide growth factors that regulate numerous processes, including cell division, differentiation, motility, adhesion, and death (Kretzschmar et al., 1999; Massague & Gomis, 2006). In breast cancer, which is discussed in detail later, TGF-β acts as a tumor suppressor in early stages of the disease, but in later stages of the disease it can promote tumor progression, in part by enhancing tumor cell motility and invasiveness (Kretzschmar et al. (1999) and references therein).
TGF-β signals through complexes of type II and type I receptors. Upon ligand binding, TRII receptors phosphorylate and activate the TRI receptors, which then activate RSmads such as Smad2 and Smad3 via phosphorylation (Massague & Gomis, 2006). Phosphorylated Smads form complexes with regulatory Smads, translocate into the nucleus, and regulate the transcription of TGF-β target genes (cf. Figure 2(a)). TGF-β signaling also activates signal transducers other than Smads, such as Erk MAP kinases, PI3 kinase and Rho-like GTPases (Derynck & Zhang, 2003; Luo et al., 2007).
Figure 2.

(Left) The TGF-β pathway. (From (Massague & Gomis, 2006) with permission.) (Center) The Ras-Raf-MEK-ERK pathway. (From (Shin et al., 2009) with permission.) (Right) A schematic of the combined pathways. (From (Guo & Wang, 2009), with permission.)
One of the pathways that exerts a regulatory effect on the TGF-β pathway by regulation of Smad signaling is the Erk MAP kinase pathway, which is activated by receptor tyrosine kinases (RTKs) such as EGFR, and by Ras, a small G-protein that is activated by RTKs (Luo et al., 2007). As with the TGF-β pathway, signaling through the Ras-Raf-MEK-ERK pathway (cf. Figure 2(b)) affects many cellular processes, including growth, cell-cycle progression, differentiation, and apoptosis (Dhillon et al., 2007). The SOS-Grb2 complex catalyzes exchange of GDP with GTP on Ras, and the active Ras-GTP binds the Raf-1 kinase, which induces the recruitment of Raf-1 from the cytosol to the cell membrane. Activated Raf-1 phosphorylates and activates mitogen-activated protein kinase (MEK), a kinase that in turn phosphorylates and activates mitogen-activated protein kinase (MAPK or ERK), which has numerous downstream effects (cf. Figure 2(b)). One of these is phosphorylation of the linker regions of Smad2 and Smad3, which can inhibit the TGF-β-induced nuclear translocation of these Smads and the antiproliferative effect of TGF-β (Kretzschmar et al., 1999). Activated ERK also feeds back to the pathway activation at several levels (Shin et al., 2009). For example, it exerts a negative feedback effect by interfering with Ras activation through SOS phosphorylation (Bourhis et al., 1997; Wang et al., 2009a).
In addition to the multitude of biochemical signals to which cells within a tissue are exposed, they are also subject to external forces that arise from cell-cell or cell-substrate (fluid or ECM) interactions, and to internal forces generated in the cytoskeleton. These can be either contractile or tensile, and either tangential or normal to the cell boundary. Tangential or shear forces involve relative motion of adjacent regions of the cell and can thereby open mechanosensitive channels and deform the cytoskeleton. While biochemical signaling pathways still receive the most attention, it is widely recognized in molecular biology that forces within a cell and between a cell and its environment, whether the environment is other cells in an epithelial sheet, or the ECM in the tissue context, give rise to an additional mode of signaling that can influence cell growth, differentiation, and the morphology of a tissue or organ. Of course this has long been known in biophysics, and an early formulation of this effect appears in Pauwels (1960). Whether the forces act directly by suppressing growth or gene expression, or indirectly by activating intracellular biochemical pathways, depends on the context.
Folkman & Greenspan (1975) and Folkman & Moscona (1978) were amongst the first to study the effect of cell shape on proliferation. They showed that DNA synthesis increases when cells flatten on the substrate, while proliferation stops in cells that are allowed to round up. It is now known that the rigidity of the substrate affects the force that can be transmitted through a focal adhesion (FA) to the cytoskeleton, which in turn can affect the stresses exerted on the nucleus and thereby modulate mechanosensitive pores (see Wang et al. (2009b) for a discussion in the framework of the tensegrity model, which postulates that the forces that are transmitted through a tissue can feed back to regulate tissue shape and form). Recent work has shown that cell-cell, cell-substrate and cell-ECM contacts such as FAs involve a complex mechanotransduction system of transmembrane proteins such as integrins, which connect via adapter proteins to the cytoskeleton, and localized signaling molecules such as focal adhesion kinase (FAK) and Src family kinases, which connect to intracellular signaling pathways such as the MAPK pathway (cf. Fig. 3) (Butcher et al., 2009). An increase in the force on a FA, whether internally-generated by contraction in the cytoskeleton, or externally applied, leads to activation of FAK via phosphorylation and to downstream signaling steps via the small G proteins Ras, Rac and Rho. FAK activation is required for mechanically-induced ERK activation and proliferation, while suppression of ERK activation blocks this induction (Frisch et al., 1996; Hebner et al., 2008). Related work shows that nectins and NECL-5, as well as the integrin α5β3 and platelet-derived growth factor receptor, are involved in contact inhibition of cell movement and proliferation (Takai et al., 2008). Other recent results directly related to the analysis in Sections 2 and 3 of this manuscript will be discussed there.
Figure 3.

A schematic of the structures involved in cell-ECM contacts. From (Butcher et al., 2009), with permission.
Angiogenesis
Initially, solid tumors are avascular i.e., they do not have their own blood supply, and rely on diffusion from the surrounding vasculature to supply oxygen and nutrients and to remove waste products. As the tumor grows, nutrient demand increases until the flux of nutrients through the surface of the tumor is too small to supply the entire mass of cells. A necrotic core of dead cells may develop at the center and eventually the tumor stops growing and reaches a steady state size of ~1–3 mm, in which the number of dying cells counterbalances the number of proliferating cells. Growth can resume only if the tumor becomes vascularized i.e., if it becomes permeated with a network of capillaries. An early response of tumor cells to hypoxia (oxygen deprivation) is the expression of genes that code for tumor angiogenic factors (TAFs), primarily vascular endothelial growth factor (VEGF) and basic fibroblast growth factor (bFGF; also called FGF-2), that are used to induce a nearby vessel to grow new capillaries to vascularize the tumor through a process called angiogenesis. These growth factors diffuse from tumor cells to the nearby primary vessels, and initiate activation of endothelial cells that line the blood vessel walls, inducing them to proliferate and migrate chemotactically towards the tumor. This results in the creation of a new capillary network that extends from a primary vessel into the growth-factor-secreting tumor, thereby bringing essential nutrients to the tumor and providing a shorter route for the spread of cancer cells to other parts of the body (Folkman, 1971). A number of comprehensive reviews of the biological background and mathematical models of angiogenesis are available (Mantzaris et al., 2004; Roose et al., 2007; Lowengrub et al., 2010).
Invasion
Cell-cell interactions modulated by cadherins, a family of Ca++- binding transmembrane glycoproteins that interact with members of the same type on adjacent cells, are critical for tissue formation and homeostasis. As with integrins, cadherins interact with the cytoskeleton via adapter proteins, and are an integral part of what are called adheren junctions between cells. These junctions encircle each cell in a belt-like structure that contains myosin II and tropomyosin. The tension created by these belts stabilizes tissues, and maintains their integrity. The first stage of single-cell invasion involves detachment of epithelial cells from the primary tumor by loss of expression or function of the adhesion molecule E-cadherin, which leads to loss of connections with neighboring cells and reorganization of the actin cytoskeleton into actin stress fibers anchored to the focal adhesion complexes that are essential for traction during cell migration. The down-regulation of E-cadherin leads to release of soluble β-catenin, which in turn activates the expression of c-Myc, the oncogenic transcription factor. These cells, which are called mesenchymal cells, also secrete ECM proteases and exhibit increased expression of extracellular matrix proteins and their receptors, which characterizes the migratory phenotype. Ultimately expression of epithelial genes is lost and there is new or elevated expression of mesenchymal markers such as vimentin, N-cadherin and fibronectin. Collectively the genetic and epigenetic changes involved constitute the epithelial-mesenchymal transition (EMT), and clearly not all cells in a migrating mass have to undergo the EMT. In some contexts the cells differentiate further into the specialized contractile myofibroblast cell type that expresses α-smooth muscle actin and secretes various proteases and cytokines.
Cancer cells invade the surrounding tissue either as individuals or as small groups of cells, and may secrete enzymes that degrade the ECM to facilitate passage of cells. Migration is to nearby vessels (if the tumor is vascularized cells may enter the circulatory system directly) or to the lymph system. In the former case it may involve chemotaxis to attractants released by nearby stromal cells in response to stimuli from the tumor. For example, it has been shown that invasion and metastasis involve a paracrine signaling loop between tumor cells and host macrophages using colony-stimulating factor (CSF-1) produced by the former and epidermal growth factor produced by the latter. Tumor cells secrete CSF-1 and sense EGF, whereas the macrophages secrete EGF and sense CSF-1 (Green et al., 2009). (cf. Figure 4.) Similarly, in breast cancer macrophages are recruited to the tumor by expression of tumor-derived chemotactic signals, where they stimulate tumor cell migration and invasion by secretion of chemotactic signals such as EGF.
Figure 4.

A schematic of a model for the role of tumor associated macrophages (TAMs) in cancer progression. Macrophages in the stroma surrounding a tumor are attracted by CSF-1 released by the tumor cells, and they in turn release chemokines that stimulate further production of CSF-1. This stimulates tumor cell migration, and both tumor cells and macrophages are stimulated to release VEGF and TGFβ. (From Green et al. (2009), with permission.)
Movement is a very complex process that involves the spatiotemporal control and integration of a number of sub-processes, including the transduction of chemical or mechanical signals from the environment, intracellular biochemical responses, and translation of the intra- and extracellular signals into a mechanical response (Mitchison & Cramer, 1996; Sheetz et al., 1999). Four major stages are involved in the mechanical response. (1) Extension of directed protrusions (lamellipodia, filopodia, or pseudopodia) at the leading edge. The force for this results from localized polymerization of monomeric actin (G-actin) into cross-linked networks of actin filaments (F-actin) in lamellipodia or bundles of filaments in filopodia or pseudopodia. (2) Anchoring of protrusions to the substrate or the ECM via adhesive complexes, which serve as sites for force transmission to the substrate (Soll, 1995; Small et al., 2002). In cells such as fibroblasts, these complexes, which are called focal complexes (FCs), can mature into larger FAs that serve as ‘traction pads’ over which the cell body moves (Small, 1989; Friedl & Wolf, 2003). (3) Next, depending on the cell type, actomyosin filaments (complexes of F-actin and the motor protein myosin II) contract at the front, in the perinuclear region, or at the rear, to move the cell body forward. (4) Finally, cells release attachments at the rear (Pollard et al., 2000).
Force transmission to the ECM via FCs and FAs involves integrin binding to extracellular ligands, force-modulated receptor clustering, and interactions with cytoskeletal structural and signaling proteins (Hynes, 2002; Bershadsky et al., 2003; Bershadsky et al., 2006). On solid substrates FCs appear beneath the leading edge of the cell (Smilenov et al., 1999) and may or may not mature into oriented FAs, depending on the cell type and the substrate. The standard model for the development of FAs involves integrin-ligand binding followed by strengthening of the attachment (Lotz et al., 1989). The strengthening arises from increases in cell-substrate contact area due to spreading, from receptor recruitment and clustering at FAs, and from interactions with the cytoskeleton to distribute the forces across bound receptors. Growth of FAs involves positive feedback, since FA size is proportional to the force applied to it by the cell (Balaban et al., 2001), and FAs grow in the direction of the applied force, even in the absence of stress fibers. In vivo these adhesions act as mechanotransducers that adjust their size in proportion to the stiffness of the ECM and the force applied to them. Moreover, stress is necessary for the development of FAs, because inhibition of myosin II via over-expression of a myosin ATPase inhibitor blocks the maturation of FCs into mature FAs (Helfman et al., 1999; Bershadsky et al., 2003). FAs are stationary in motile cells but slip centripetally in stationary cells (Smilenov et al., 1999), and thus the integrated mechanical system of networks and adhesion sites may have multiple stable states corresponding to macroscopic motile or stationary states of a cell.
Cells are quite adaptable to their environment, and other modes of locomotion are possible. It is known e. g., that leukocytes can move up to 100 times faster than mesenchymal and epithelial cell types, probably by using frequent shape changes characteristic of amoeboid cells (Pittet & Mempel, 2008). Recently it has been shown that integrin-mediated adhesion is only needed to pass through barriers like the endothelial layer, and that migration through the ECM can be adhesion-independent (Lämmermann et al., 2008). After a quadruple knockout of all the integrins expressed by dendritic cells, it was found that these cells move in 3D collagen gels and in vivo by extension of the anterior actin network of the cell, in concert with actomyosin contractions of the trailing edge, to move the rigid nucleus through narrow spaces. In essence it appears that these cells ‘swim’ by a controlled sequence of shape changes, but it remains to be seen if some minor adhesion molecules were involved (Friedl, 2010).
1.3 An overview of the modeling and computational issues
The sequence of steps in the progression from normal cell to cancer cell involves a hierarchy of time and space scales, and the complexity of the processes involved precludes a unified model that incorporates all the sub-processes. We describe some of the modeling and computational issues raised and the main types of models for the sub-processes.
Models of progression – from a single mutation to a ‘viable’ neoplasm. The early stages of cancer development are certainly stochastic, whether at the level of mutations in normal cells or at the level of survival of transformed cells. At present we have no information on the survival of individual transformed cells in vivo, and thus we cannot predict the probability of generating a successful neoplasm. Moreover, while population means are relevant at that level, they are of little value at the level of individual realizations without further knowledge of the distribution. A review of many of the models formulated in the past 50 years appears in Little (2010).
Integration of signaling networks – As described earlier, there is cross-talk between signal transduction networks for growth factors and other cytokines, and for mechanical influences. Kinetic data is sparse in all these systems, and thus it is important to understand the qualitative effects of these interactions and the sensitivities of the outcome to changes in the signal levels, the strength of interactions, and the kinetic parameters. In particular, a major unknown factor is the effect of force on gene expression and how to model transduction through the focal adhesions and the cytoskeleton. Again one can expect a diversity of effects, as exemplified by just two cases, one in which stress affects apoptosis via the mitochondria (Cheng et al., 2009) and the other in which stress affects the balance between two antagonistic transcription factors that govern the expression of the VEGF receptor (Mammoto et al., 2009).
Another aspect of signaling concerns the indirect interactions between signaling networks in different, spatially-separated cell types in the local environment. This ‘action-at-a-distance’ brings in the role of transport through the intervening tissue and the effects of inhomogeneity and anisotropy on transport. For example, tumors frequently recruit macrophages (TAMs) and interact with TAFBs via growth factor signaling networks. Tumors may also induce stiffening of the surrounding tissue, but this could potentially impede transport and thus reduce interaction with macrophages and fibroblasts. In the brain, anisotropy of the surrounding ECM and astrocyte networks plays an important role in the growth of tumors.
Many existing models of tumor growth have focused on the transport of nutrients and mechanical properties, but little has been done to incorporate both signaling networks and cell-cell interactions into the continuum models. One aspect of this is discussed in Section 3, where a hybrid model is used. As noted earlier, after tumor spheroids reach a certain size dependent on local conditions, growth occurs primarily in a shell at the outer boundary of the tumor. This makes it feasible to use a hybrid model, in which proliferating cells at the boundary retain their identity, whereas cells in the interior are effectively homogenized and treated as a continuum. This allows for changes in adhesive properties, metabolic state and other characteristics at the individual cell level in regions where it is likely to be most important, while retaining the computational advantage of a continuum description for both the interior of the tumor and the exterior tissue. What is lacking to date is a detailed analysis of the algorithms used heretofore (Kim et al., 2007) and improvements in the computational implementation of the algorithms. Furthermore, more work is needed on continuum models of tissues and on methods for homogenizing a multiphase description that embeds cell-level properties into the constitutive relations for the continuum (Macklin et al., 2009; Preziosi & Tosin, 2009; Lowengrub et al., 2010).
The early stage of invasion that involves the EMT has not been modeled in detail, but this is a critical step. Here a hybrid model of the type described in Section 3 is useful because the effects of changes in cell-cell adhesion and intracellular mechanics can be incorporated. Cellular automata models can also be useful, but there is difficulty in properly incorporating mechanics into such models, and as we have seen above, mechanics plays a major role at this stage.
Modeling of movement of single cells and small groups of cells through the ECM, both of tumor cells and the fibroblasts and macrophages in the stroma surrounding a tumor, is still in its infancy. However, understanding how to do this is important for predicting how to subvert metastasis. A great deal of attention has focused on the movement of cells on well-defined 2D substrates, but the cell morphology and the interaction with the environment can be very different in 3D. In fact, as we noted previously, cells in the ECM can move even in the absence of integrins, i.e., in the absence of the primary modulator of cell-ECM interactions. We suggested that cells swim under these circumstances, but there is little known about the efficiency of movement or even what signals induce the sequence of shape changes that produces translocation. Inhomogeneity and anisotropy of the surrounding tissue play an important role in determining how cells move and tumors grow and spread, especially in the brain. Detailed models of single cell motility have been used to predict the effects of substrate properties on cell speed (DiMilla et al., 1991; Gracheva & Othmer, 2004; Stolarska et al., 2009) in 2D, and less detailed cell-based models of tissues have been used to predict movement of cellular aggregates such as the Dictyostelium discoidium slug (Palsson & Othmer, 2000; Palsson, 2008) and to understand how forces are transmitted through a 3D moving aggregate (Dallon & Othmer, 2004). However there are as yet no satisfactory models of movement in 3D that account for local mechanical interactions of the ECM and remodeling of it, via either stress effects or secreted proteases. Continuum models based on kinetic equations have been developed ((Painter, 2009) and references therein), but much remains to be done to embed cell-level behavior into the continuum equations.
Integration of molecular and cell-level behavior into population- and continuum-level descriptions. To date most models evade this issue by simply postulating constitutive equations for material behavior, but more quantitative predictions from models will only be possible if they reflect the molecular, cell and tissue properties with greater fidelity. When constitutive relations that better reflect these lower-level properties and behaviors become available, one can envision detailed models of a growing tumor and the surrounding microenvironment, including the various embedded cells in the stroma, so as to quantitatively study the role of mechanics, transport of nutrients, feedback loops between tumor cells and stromal cells, and cell movement (Preziosi & Tosin, 2009).
1.4 An overview of the paper
It is clear from the foregoing that the interactions between a tumor and its microenvironment plays a critical role in the transition from benign or pre-malignant tumor to cancer. In the remaining sections we treat two aspects of these interactions. In the following section we develop a continuum model for mechanics and nutrients that we use to quantify the effects of the material properties of the surroundings on the growth of tumors, and we compare our predictions with experimental observations. In Section 3 we introduce a hybrid model for breast cancer that incorporates signaling from stromal cells to tumor cells in addition to the mechanical effects of the environment. There we model tumor cells using a cell-based model and the surrounding tissue as a continuum.
2 A continuum approach to the effect of stress on tumor growth
As was described earlier, extracellular mechanical stresses can be transmitted to the cytoskeleton via integrins and thereby affect growth and gene expression. In particular, Helmlinger et al. (1997) were amongst the first to show experimentally that compressive stress in a tumor reduces its growth rate. When a tumor spheroid was grown in a sufficiently large agarose gel environment, the spheroid grew isotropically and reached an equilibrium size that scales inversely with the stiffness of the agarose. When an initially spherical tumor was embedded in a glass capillary tube 1 mm in diameter and 1 cm long, the mechanical properties of the surrounding medium determined whether or not growth was isotropic. When grown in a free suspension in the capillary, growth was isotropic up to a diameter of ~500 μm, when the experiment was terminated. In contrast, when the capillary contained 0.7% agarose gel the tumors were oval-shaped with an aspect ratio of approximately 2:1 when the major axis was less than about 450 μm. That this anisotropic growth is due to the anisotropic stress distribution in the gel was established by showing that tumors removed from the tube subsequently grew isotropically.
More recent work has confirmed these results and has also begun to elucidate the effects of mechanical stress on intracellular kinetics and gene expression involved in the transformation of normal cells, and on the proliferation and apoptosis of tumor cells. Koike et al. (2002) showed that highly invasive AT3.1 carcinoma cells do not form spheroids when grown in free suspension, but do when grown in agarose. They also showed that the size of the spheroids is inversely proportional to the agarose stiffness. These cells do not express E-cadherin, which may account for the fact that they do not form spheroids in free suspension. However, when grown in a gel the reactive stress induces the production of hyaluronan, an adhesion molecule found in connective tissue and believed to aid progression of malignant tumors (Park et al., 2008; Gotte & Yip, 2006), which may facilitate growth of tumors as spheroids when under stress. Concerning apoptosis, Cheng et al. (2009) showed that it is the compressive mechanical stress, not nutrient availability, that leads to an increased rate of apoptosis in mammary 67NR carcinoma cells. These results are opposite those of Helmlinger et al. (1997), who showed that increased mechanical stress decreases the apoptotic rate. The difference may stem from different packing arrangements of cells in different cell lines, and if confirmed in other experiments it precludes the possibility of assigning unique effects of stress on tumor growth.
In this section we describe a continuum framework for modeling the mechanics of a growing tumor so as to investigate the combined effects of nutrient supply, mechanical stresses, and geometric constraints on tumor growth in three dimensions. There are numerous mathematical models describing tumor growth, all of which are reviewed in one of Araujo & McElwain (2004); Rejniak & McCawley (2010); Kim et al. (2007) or Lowengrub et al. (2010). We discuss four of these that pertain to the experiments of Helmlinger et al. (1997) and Cheng et al. (2009). Chen et al. (2001) treat the tumor as a two phase mixture, wherein one phase represents the cellular material and the other represents the extracellular fluid. The agarose is treated as a hyperelastic solid and growth is incorporated by specifying a nutrient dependent growth rate of the tumor/agarose interface. Ambrosi & Mollica (2004) treat the tumor and surrounding agarose as an elastic material and incorporate tumor growth using a multiplicative decomposition of the deformation gradient. Roose et al. (2003) describe the tumor and agarose as a two-phase poroelastic material wherein fluid movement is governed by Darcy’s law, while the solid phase is treated as a hypoelastic material. The residual stress due to the growth of the tumor is incorporated via an effective prestress in the hypoelastic constitutive equation. The radial component of displacement predicted by this model compares qualitatively with their experimentally-measured radii for MU89 melanoma tumor spheroids. All of these mathematical models assume spherical symmetry, which reduces them to one dimension and thus precludes analysis of anisotropic growth.
Kim et al. (2007) describe a two-dimensional hybrid discrete-continuum model in which cells in the proliferating layer of the tumor spheroid are modeled by discrete deformable ellipses, each of which can grow and divide. The mechanical properties of each axis of the ellipse are described by viscoelastic spring-dashpot systems, and the deformation of the cellular layer is coupled to the deformation of two continuum regions, one that represents the quiescent and necrotic regions in the tumor interior, and one external to the proliferating zone that represents the surrounding agarose. These authors predict the dependence of the size of the necrotic core, the quiescent region, and tumor on agarose stiffness and nutrient supply.
Here we develop and solve a three-dimensional continuum model of tumor growth and use it to investigate the effects of agarose gel inhomogeneities and other factors on tumor growth. We treat the tumor and surrounding agarose as a single-phase hypoelastic material, which for small strains, is equivalent to linear elasticity. While a variety of constitutive models for the material properties of tumor have been used, most soft biological tissues, including tumors, exhibit viscoelastic material properties (Fung, 1993; Sinkus et al., 2005), and for large strains hypoelastic materials dissipate energy, which reflects a viscoelastic response (Olsen & Bernstein, 1984; Mihailescu-Suliciu & Suliciu, 1979). Agarose has been shown to exhibit a fairly complicated rheology and has been generally treated as an elastic material (Normand et al., 2000). Therefore, modeling the tumor as a hypoelastic material is a reasonable assumption, and we do this here. Because the tumor and agarose deformations can be quite large, hypoelastic constitutive equations lead to computational algorithms with better numerical properties, because it is not necessary to relate the current configuration to a fixed reference configuration.
2.1 The mathematical model
2.1.1 The evolution equations for nutrients
We assume that transport of nutrients occurs via diffusion and advection due to growth. Thus one can in general describe the evolution of nutrient profiles with a system of reaction-diffusion equations containing an advective term. The coupling of nutrient evolution to the momentum equation given later is via the advective velocity, whereas the reverse coupling enters through the growth term and its effect on the deformations. The general form the ith component of this reaction-diffusion system is
| (1) |
Here ci is the concentration of the ith nutrient, v = du/dt is the velocity (where u is the displacement), and Di is the diffusion coefficient. The function Ri(c) describes the net rate of production of the nutrient, which is fixed by the reactions for its production, uptake and utilization. Ri depends on the vector of nutrient concentrations c = [c1, c2 …] since in general it is possible that reactions of the nutrients with one another affects the uptake or production rates. We assume that these species occur in small enough quantities so that their interconversion does not affect the momentum balance of the bulk material.
In most experimental systems involving the growth of multicell tumor spheroids the primary nutrients are oxygen and glucose. It has been shown experimentally that an increase in the glucose concentration decreases oxygen uptake (the Crabtree effect), and converesly, an increase in the oxygen concnetration decreases the glucose uptake (the Pasteur effect) (Mueller-Klieser et al., 1986; Casciari et al., 1992b). However, in both cases an increase in the concentration of one nutrient has only a small effect on the uptake of the second, and to simplify the model for the numerical experiments done here we consider oxygen as the only nutrient. For some of the experiments described earlier it is known that the nutrient levels do not limit the tumor growth, and thus we do not expect to find necrotic cores in the tumor.
Previous results due to Casciari et al. (1992b) and to Freyer & Sutherland (1985) lead to a Michaelis-Menten form for the consumption of oxygen, and thus the evolution of the oxygen concentration is described by
| (2) |
Here c is the concentration of oxygen, and A and k are empirically determined paramters (Casciari et al., 1992b). φ(x) is the characteristic function of the tumor: φ(x) = 1 inside the tumor and φ(x) = 0 in the agarose, and the subscripts on Da/t reflect the fact that the diffusion coefficient is different in the tumor than in the surrounding agarose. The oxygen evolution is coupled to the mechanics through the velocity v, which is found from the momentum balance equations developed in the following sections.
2.1.2 Deformation and growth
Various models of growing biological tissues incorporate growth by postulating a multiplicative decomposition of the deformation gradient
where X represents a material coordinate point, into a part that describes growth and a part that describes deformations due to incompatible local growth and any externally applied tractions or body forces. Thus the deformation gradient is written as F = FP FG, where FG is the growth component and FP is the passive component (Skalak, 1981; Rodriguez et al., 1998; Taber & Perucchio, 2000). In models of hypoelasticity the material is effectively incrementally elastic in that the configuration at time t is the reference configuration for the material at time t + δt, where δt is suitably small. Because deformations are small in each time increment, F − I is small. From this it follows, by neglecting nonlinear terms and differentiating the result with respect to time, that the multiplicative decomposition of F leads to an additive decomposition of the symmetric part of the rate of deformation tensor
where v(x, t) is the veloctity and x represents a spatial coordinate point. Thus
| (3) |
where DP is the passive component of the rate of deformation gradient that is incorporated into the constitutive equation, and DG is the growth component of D that depends on the local nutrient concentration and local stresses.
The experimentally-observed dependence of the volumetric growth rate on the local oxygen concentration has the form
| (4) |
where G1 and G2 are constant parameters (Casciari et al., 1992b). We assume that tumor growth is isotropic, and thus the growth component of the rate of deformation tensor has the form
| (5) |
Here G is the overall growth rate (which will be related to Ḡ later); it takes into account both nutrient concentrations and stress feedback. Anisotropic growth can be incorporated by appropriately modifying one or more diagonal and/or off-diagonal entries in DG.
2.1.3 Momentum balance and constitutive equations
We assume that the tumor and agarose are slightly compressible materials (Roose et al., 2003) on which no body forces are acting. Since the tumor grows very slowly (approximately 1 mm in diameter over the course of one month), we also neglect all inertial effects. The momentum balance equation can therefore be expressed as
| (6) |
where σ is the Cauchy stress tensor. We assume conservation of angular momentum, and thus σ is symmetric. The constitutive equation used to describe the agarose and tumor is given by
| (7) |
The left-hand side of (7) is the Oldroyd time derivative, which ensures frame invariance of (7), C is a constant, fourth-rank Hooke tensor that depends on E, the Young’s modulus of the material, and ν, the Poisson ratio. When the stress and rate of deformation tensors are written in Voigt form, i.e., σ = [σxx σyy σzz σyz σxz σxy]T, the Hooke tensor can be written as
| (8) |
where
| (9) |
We note that the stress depends only on the passive component of the rate of deformation, i.e., D − DG = DP, which allows for development of residual stresses if local growth rates are incompatible. If growth is uniform throughout a growing body on which there are no additional applied forces, then all stresses should be identically zero, but if local growth rates vary between adjacent material elements, residual stresses must develop for a body to remain continuous. The assumption that the stress depends only on DP allows for the formation of these stresses.
2.1.4 Stress feedback
To incorporate the effects of stress on the growth of the tumor, we include a stress feedback function in the overall volumetric growth rate. Following Roose et al. (2003) and Kim et al. (2007), we assume that the stress feedback is isotropic and depends linearly on the average bulk stress. This stress feedback is represented by
| (10) |
where β is a constant parameter representing the strength of the stress feedback. Furthermore, we assume that the overall volumetric growth rate depends multiplicatively on the nutrient-dependent and stress-feedback components, and therefore
| (11) |
In this formulation it is only the magnitude, not the sign, of the isotropic stress that affects growth. Said otherwise, compressive and tensile stresses contribute equally to the decrease of the growth rate. While it has not been established experimentally, it is plausible that only compressive stresses reduce the growth while tensile stresses do not, and it may be that shear stresses are also important, as in blood flow; both effects are easily incorporated, but even in the isotropic case the functional form of the dependence of growth on stress is not known. Moreover, it can be shown experimentally and mathematically that the bulk stresses inside an agarose-embedded, isotropically-growing tumor of convex shape are exclusively compressive.
2.2 Computational results
2.2.1 The effect of stress on growth under spherically symmetric conditions
Experiments on spherical tumor growth involve seeding liquid agarose gels with single tumor cells at a seed density at which there is no interaction between the growing spheroids over the course of an experiment. Once the agarose solidifies, nutrient-rich culture medium is added to compartments above and below the disk-shaped, solidified suspension. The geometry of our numerical simulations is based on this experimental configuration.
We consider a single tumor spheroid growing in a solidified medium, which is significantly larger in the experimental setup than our computational domain, and we impose zero normal displacements on the exterior faces (cf. Figure 5). This reflects our assumption that the normal displacement decay occurs on a sufficiently small length scale to vanish at the boundaries of the computational domain, despite the fact that it is smaller than the experimental domain. For spherical growth we invoke reflective symmetry conditions to only simulate one-eighth of a tumor, and to retain the symmetry zero normal displacements are imposed on the three symmetry planes. We assume that the initial tumor radius is 0.1 mm and the length of one edge of the cubic domain is 0.4 mm. In the experiments each cell has a diameter of ≈ 20 μm, and thus there are approximately 5 cells along a radius of 0.1 mm of the tumor. In the Helmlinger et al. (1997) experiments, tumor growth starts at the single cell level, but it is computationally prohibitive to start at this level in the numerical experiments. Furthermore, begining with one cell would preclude treating the tumor as a single-phase continuum; a hybrid model of the type described later would be required. For this reason we start with a larger tumor and assume that all initial velocities and stresses are zero.
Figure 5.

(a) The geometry and boundary conditions of numerical experiments. n is the outer normal to the boundary of the domain. (b) Experimental tumor growth. Tumor growth induces a crack in the surrounding agarose (red arrows on top figure) and the tumor grows into the void caused by the crack (bottom). From Cheng et al. (2009), with permission.
In addition to the conditions at the boundary of the domain, additional conditions must be satisfied at the tumor-agarose interface. Specifically, the displacements and surface tractions at this interface must satisfy the continuity conditions
| (12) |
where [| * |] represents the jump across the interface, and nt is the outer unit normal to the tumor at the tumor-agarose interface. The finite element implementation employed to solve the model equations automatically satisfies these and other interface conditions specified later.
Figure 5 also illustrates boundary conditions for oxygen diffusion and uptake. To retain symmetry, we assume that there is no flux of oxygen across the three faces of the domain that intersect the tumor. We impose no-flux boundary conditions on the lateral boundaries at x = 0.4 mm and y = 0.4 mm, and the boundary at z = 0.4 mm corresponds to the nutrient medium, where we impose a fixed oxygen concentration of 0.2 mol/m2. In addition, the concentrations and normal diffusion fluxes across the tumor-agarose interface must be continuous. This is represented by the conditions
| (13) |
We allow the oxygen profile, which evolves according to (2), to reach a steady state in the initial domain shown in Figure 5 before initiating tumor growth, since this occurs on a time scale that is short compared with that of tumor growth.
All parameter values used for the numerical simulations are given in Table 1. Whenever possible, we based our parameter values on experimental data or previous models. We chose our oxygen-dependent growth rate so that the tumor would reach size of approximately 1 mm in the course of 30 days if grown in free suspension. We chose the stress feedback parameter so that equilibrium radius of the tumor growing in 0.5% agarose is twice the original radius and so that the tumor approaches the equilibrium size at approximately 25 days of growth. All simulations were done using the finite element method with remeshing on Comsol Multiphysics®. All simulations were run until the rate of tumor growth decreased signficantly from its initial rate, which is approximately 0.13 day−1.
Table 1.
Parameter values for the continuum tumor model.
| Parameter | Description | Value | Refs. |
|---|---|---|---|
| Dt | oxygen diffusion in the tumor | 1.55 × 10⁻⁴ m2/day | (Mueller-Klieser & Sutherland, 1984) |
| Da | oxygen diffusion in 1% agarose | 1.86 × 10⁻⁴ m2/day | (McCabe & Laurent, 1975) |
| A | oxygen uptake parameter | 2.2 × 10³ mol/(m3 · day) | (Casciari et al., 1992b; Casciari et al., 1992a) |
| k | oxygen uptake parameter | 4.64 × 10⁻³ mol/m3 | (Casciari et al., 1992b; Casciari et al., 1992a) |
| G1 | growth rate parameter | 0.14 day−1 | this work |
| G2 | growth rate parameter | 8.3 × 10⁻³ mol/m3 | (Casciari et al., 1992b; Casciari et al., 1992a) |
| Et | Young’s modulus for tumor | 4.55 kPa | (Roose et al., 2003) |
| Ea | Young’s modulus for 0.5% agarose | 0.218 kPa | (Roose et al., 2003) |
| Ea | Young’s modulus for 1% agarose | 0.369 kPa | (Roose et al., 2003) |
| ν | Poisson ratio for all materials | 0.3 | (Roose et al., 2003) |
| β | stress rate scaling parameter | 11 kPa−1 | this work |
The evolution of the radius of the growing tumor is shown in Figure 6. As expected, the tumor reaches a smaller equilibrium size at an earlier time in the 1% agarose, as seen in Figure 6(c). In 1% agarose the tumor stops growing after about 10 days, but in 0.5% agarose it continues to grow, but with a decreasing rate.
Figure 6.

(a) Final configuration at time t=25 days for tumor growth in 1% agarose and (b) 0.5% agarose. Original tumor position is outlined in black. (c) Evolution of the tumor radius. Dashed line corresponds to evolution in 0.5% agarose and solid line corresponds to growth in 1% agarose.
The average bulk stress profiles (i.e., (σxx + σyy + σzz)/3) in the 1% and 0.5% agarose gels at t = 25 days are shown in Figure 7(a) and (b), respectively. The growth rate reaches a value of approximately 0.01 day−1 when the bulk stresses internal to the tumor are approximately 0.08 kPa. While the computed radii compare well to experimental results, these stresses are approximately one order of magnitude smaller than those predicted by Roose et al. (2003), and two orders of magnitude smaller than those measured by Helmlinger et al. (1997). However, we expect the stresses computed here to be somewhat smaller than in experiments, because there tumor growth begins with a single cell, which results in larger relative deformations, and therefore larger stresses. Specifically, in the experiments described in Roose et al. (2003) tumor growth starts with a single cell, which is approximately 10 μm in radius, and equilibrium tumor size for 0.5% agarose is approximately 180 μm. Therefore, throughout the course of the experiment and their numerical simulation the tumor radius increases approximately 18-fold. In our computations for 0.5% agarose, the initial tumor has a radius of 100 μm and reaches an equilibrium size of approximately 200 μm. Hence the increase in radius is approximately 1/10 that in the experiment, and therefore it is to be expected that our computed stresses are approximately 10 times smaller than in the experiment. To circumvent using a large initial radius one could use a three-dimensional version of the hybrid model discussed later for the simuations presented here. This would allow us to begin with a single cell and then convert the growing tumor into a continuum when it reached the appropriate size. This would likely provide a more accurate stress approximation, and is part of our future work.
Figure 7.

Average bulk stress ((σxx + σyy + σzz)/3) distribution near or upon approaching equilibrium size. (a) In 1% agarose at 25 days. (b) In 0.5% agarose at 25 days. (c) Inhomogeneous agarose concentration at 7.5 days (discussed later).
2.2.2 The effect of stress on growth under spatially inhomogeneous conditions
Surprisingly, our attempt to replicate the capillary tube experiment of Helmlinger et al. (1997) does not result in tumor growth similar to that observed experimentally. We ran simulations, using the parameters and stress feedback described here in both 0.5% and 1% agarose, beginning with a tumor of initial radius 100 μm placed in the center of a capillary-shaped domain with a 300 μm radius and a total length of 1200 μm. In these simulations the tumor retains its spherical symmetry (data not shown). The radial growth profiles of the tumor in the capillary tube were similar to those illustrated in Figure 6(c), and we observed that level surfaces of constant non-zero bulk stresses remained concentrated in spherical shells surrounding the growing tumor. To illustrate this stress profile in a domain comparable to the domain used in our simulations of spherical tumor growth, we simulate a growing tumor in the domain depicted in Figure 5, but with the boundary condition σ · n = 0 at z = 0.4 mm. In other words, to represent conditions similar to those found in the capillary tube, rather than fixing the normal displacement at this boundary as before, we assume that the boundary can move but is traction free.
Figure 8 shows the displacement magnitudes and bulk stress profile in the domain at t = 25 days, at which point the growth rate of a tumor growing in 1% agarose is approximately 5−4 days−1. In simulations in which the top boundary is fixed, the magnitude of the displacement field is non-zero only in a small portion of the agarose surrounding the tumor (data not shown). However with a free top domain boundary, the displacements are larger at this boundary (Figure 8(a)), but the stress field is clearly concentrated near the tumor-agarose interface (Figure 8(b)). Helmlinger et al. (1997) and Cheng et al. (2009) also note that experiments show that non-zero stresses are concentrated in a small shell surrounding the growing tumor and then decay quickly to zero away from the tumor, and our numerical investigation confirms this. This indicates that the stress feedback is likely non-linear and/or non-isotropic, as is assumed by us and in other mathematical models (e. g., Roose et al. (2003); Kim et al. (2007)). Nonlinear stress feedback may be such that small stress gradients are amplified interior to the tumor resulting in a much more inhomogeneous growth rate than occurs with a linear stress feedback. In addition, it is possible that the growth rate is not affected by bulk stresses, but rather the tumor tends to grow in the direction of least resistance, resulting in anisotropic growth. We also neglect the effects of the formation of a necrotic core or any other local modulations in material properties that may occur due to stresses, and these local modulations may have an affect on tumor growth rates (Paszek & Weaver, 2004). However, our simulations using a Poisson ratio of ν = 0.42 exhibited results similar to those shown in Figure 8, and therefore it is unlikely that the compressibility of the material causes the stress distribution to be localized to the periphery of the tumor (data not shown).
Figure 8.

(a) Magnitude of the displacement field at t = 25 days for tumor growth in a domain with a free top boundary. (b) (σxx + σyy + σzz)/3 at t = 25 days.
Helmlinger et al. (1997) note that it is not known how local modulation of the material properties of the surrounding tissue will affect the tumor growth, and here we investigate this computationally. We assume that the tumor is embedded in a very pliable agarose gel (with E = 0.1 kPa) and directly adjacent to one side of the tumor is a rigid agarose gel with a elastic modulus of E = 1.0 kPa. The setup of the simulation is as illustrated in Figure 5 with normal displacements at the top boundary fixed. However, the overall elastic modulus of the agarose is defined by the function
| (14) |
While elasticity parameter values for agarose used in tumor experiments typically fall in the range of 0.15 kPa – 0.4 kPa, here we choose the values in (14) for agarose elasticity because they are still within a reasonable range and simultaneously illustrate the model’s ability to capture experimentally-observed inhomogeneity in tumor growth. We note that the numerical setup here effectively resembles the experimental setup of Cheng et al. (2009) in which tumor growth leads to a crack in the surrounding agarose, which in turn results in the tumor growing primarily into the stress-free void generated by the crack (see Figure 5(b)).
A comparison of the radial component of the tumor in the y – z plane at x = 0 to the radial component along the x axis is illustrated in Figure 9. Since the elastic modulus of the agarose increases as x increases, the tumor grows in the y – and z–directions at a faster rate than in the x-direction. The dependence of the length of the tumor radius in the y – z plane on the radial length of the tumor in the x direction can be described by the line y = 1.81x − 83.9. The ratio of the two lengths described by this line is similar to the ratio of the major and minor diameters of the tumor in the capillary tube experiment from Helmlinger et al. (1997).
Figure 9.

(a) Evolution of the tumor radius along the x-axis (solid) and radius in y – z plane at x = 0 (dashed). (b) The length of the radius along x axis relative to radius in y – z plane. Line of best fit y = 1.81x − 83.9
Therefore, the model described here is able to capture the inhomogeneous deformations that have been observed experimentally, despite the fact that here the deformations are caused by inhomogeneity of material properties, while in Helmlinger et al. (1997) inhomogeneous growth is induced by the shape of the capillary. The bulk stress distribution at t = 7.5 days is illustrated in Figure 7(c). We note here that due to the variable material properties, the bulk stresses are inhomogeneous in the tumor interior, which leads to variable growth rates within the tumor. Furthermore, this leads to the presence of shear stresses inside the tumor. Figure 10 shows the σrθ shear stress component at the plane defined by z = 0. In this stress component and θ is the angle between the positive x axis and the ray defined by r. In the case of spherically symmetric tumor growth, σrθ inside the tumor is zero to numerical accuracy. Therefore, inhomogeneous growth rates inside the tumor lead to non-negligible shear stresses, which may impact local tumor growth rates. Endothelial cells that line blood vessels typically respond to shear stresses by increasing proliferation (see e.g., (Shyu, 2009; Hudlicka & Brown, 2009)), and it is not clear whether shear stresses have a similar effect on tumor growth.
Figure 10.
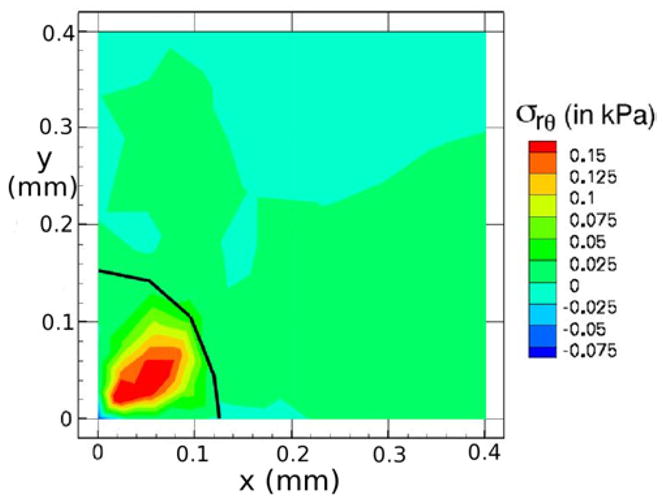
Shear stress σrθ distributions on the plane defined by z = 0 for agarose with variable material defined by (14). Here and θ is the azimuthal angle.
3 A model for ductal carcinoma in situ
As in other tissues, the TGF-β family of growth factors regulates many cellular processes during both normal mammary gland development and during the initiation and progression of breast tumors. As described earlier, TGF-β inhibits cell cycle progression of epithelial cells, probably by down-regulation of factors such as c-Myc, that lead to arrest of the cell cycle in G1 and thereby control epithelial cell proliferation during gland development. Moreover, it also has a biphasic role in tumor progression: in early development of ductal carcinoma in situ (DCIS) it inhibits the outgrowth of tumors, but in later stages it can promote tumor progression by increasing tumor cell motility and altering the microenvironment. However, mutations in the TGF-β signaling pathways are relatively rare in breast cancers – instead there are more subtle changes in the balance between the growth-inhibiting effect of TGF-β and the growth-promoting effects of other factors. These include regulation of the levels of transcriptional co-repressors or co-activators involved in the Smad pathway, and epigenetic regulation of critical steps in the progression to cancer (Hinshelwood et al., 2007). Some of these are changes in stromal cells such as fibroblasts and macrophages that are induced by TGF-β, which suggests that the effects of TGF-β in the microenvironment, together with its roles in EMT and metastasis, stimulate cancer progression and overwhelm its effects as a tumor suppressor. The effect of the microenvironment on tumor growth via nutrient levels and other passive factors such as the tissue properties has long been recognized, but the active role of the microenvironment has gained attention recently (Gatenby & Gillies, 2008), as exemplified by the characterization of stromal fibroblasts as ‘contracted farmers’ used by tumors to prepare the microenvironment (Cheng & Weiner, 2003). This highlights the necessity of incorporating interactions between signaling networks within the local microenvironment into mathematical models of tumor growth and invasion, and in this section we develop one that enables us to study some of these interactions and their effects.
3.1 Biological background
Breast ducts are made of a layer of epithelial cells (ECs), a layer of myo-epithelial cells, and a layer of basal membrane, all surrounded by connective tissue that contains stromal cells such as fibroblasts and the extracellular matrix. The ducts have diameters of 80–90 μm in mice and 0.2–0.4 mm in humans (Franks et al., 2003). In mice the ECs are roughly 10 μm in diameter, and thus 8–9 layers of ECs suffice to completely block a duct.
Under homeostatic conditions breast duct ECs secrete various growth factors, including TGF-β, and stromal fibroblasts secrete EGF, but the rates are balanced and growth is controlled. When a sufficient number of ECs inside a duct are transformed (which we designate as TECs), they proliferate in the duct and increase their secretion of TGF-β (Massague, 1998). The increased level of TGF-β in the stroma induces differentiation of fibroblasts into myofibroblasts and upregulates their secretion of EGF. This closes the paracrine positive feedback loop and can strengthen the feedback, since the increased EGF level can induce upregulation of Her2/Neu, a member of the EGFR family, which in turn strengthens signaling via the EGF pathway (Cheng & Weiner, 2003). This increase in EGF signaling disrupts the balance with the TGF-β-pathway that controls proliferation (see Figures 12 and 2(c)). Patients with breast cancer often show upregulated Her2/Neu, making Her2/Neu a common target for treatment (Bhowmick et al., 2004).
Figure 12.

The interaction of the EGF and TGF-β pathways in the control of proliferation in breast cancer (see also Figure 2(c)). In normal ECs these pathways are balanced so as to control growth, but in TECs increased secretion of TGF-β induces fibroblasts and myofibroblasts to secrete more EGF. This disrupts the proliferation-inhibition mechanism by partially blocking the TGF-β-Smad pathway and triggers proliferation.
There are also other effects of stromal fibroblasts on tumor growth. When ECs are transformed to TECs and a carcinoma develops, the number of fibroblasts may increase more than five-fold and these stromal fibroblasts secrete large amounts of the ECM in addition to EGF (Bissell & Radisky, 2001). Fibroblasts from normal tissue may even have an inhibitory effect on growth while those cultured from tumors stimulate cell growth as described above (Adams et al., 1988; Bhowmick et al., 2004), particularly in breast tissue (Samoszuk et al., 2005). Recently Yashiro et al. (2005) demonstrated that tumor size is significantly increased in mice when breast cancer cells are co-inoculated with breast fibroblasts. In addition, before TECs begin to degrade the duct wall and migrate into the surrounding tissue, they first fill in the duct by proliferating. A sufficient tumor mass induces a response in inflammatory cells such as macrophages, which appear to detect TECs as a wound (Matrisian, 1999). Thus fibroblasts, myofibroblasts and macrophages in the microenvironment surrounding a tumor play an important role in tumor growth and metastasis by enhancing local signaling and by modifying the ECM locally.
Franks et al. (2005) developed a continuum model of comedo ductal carcinoma in situ of the breast. Tumor cells are subject to mechanical and nutritional stresses by high pressures and oxygen deprivation, and experience expansion when the duct wall deforms. They postulate such stresses may stimulate the cells to produce proteolytic enzymes to degrade the duct wall, therefore making it more compliant and prone to penetration by the tumour cells. They found that mechanical stress is likely the dominant mechanism, with the wall deforming most at the centre of the duct. These authors do not treat the interactions between stromal cells and tumor cells.
In the following sections we introduce a 2D hybrid model describing the interactions amongst TECs, fibroblasts and myofibroblasts via EGF and TGF-β. Rather than treating the entire domain as either a continuum or using only a cell-based model, we adapt a hybrid approach in which a cell-based model is used to describe the dynamics of TECs in the duct and ECs on the interface between stroma and the duct, and to describe the dynamics of the sinks and sources that arise from the fibroblasts and myofibroblasts in the stromal tissue. The surrounding stroma is modeled as a viscoelastic continuum. We begin with a simplified model for the dynamics of EGF and TGF-β in a single cell to illustrate some of the major factors involved in the interaction between a TEC and the stroma.
3.2 The intracellular dynamics of the EGF-TGF-β signaling pathways
The intracellular signaling model is based on the following assumptions: (i) TGF-β-occupied receptors phosphorylate Smads, (ii) EGF-occupied receptors activate a molecule that binds to either form of the Smads, (iii) the proliferation rate is a monotone decreasing function of the concentration of phophorylated Smad. The symbols and their definitions are given in Table 2. The reactions involved in the model are as follows.
Table 2.
Definition of variables in EGF-TGF-β signaling pathways
| Notation | Description | Abbreviation |
|---|---|---|
| E | EGF | |
| T | TGF-β | |
| R1 | TGF-β receptor | TGFβR |
| R2 | EGF receptor | EGFR |
| S | unphophorylated Smad | uSmad |
| Sp | phosphorylated Smad | pSmad |
| A | inactive form of the EGF-activated molecule | iEGFAM |
| A* | active form of the EGF-activated molecule | aEGFAM |
- Ligand binding:
- Smad reactions and activator reactions
Here overlines denote complexes.
Evolution Equations
| (15) |
| (16) |
| (17) |
| (18) |
| (19) |
| (20) |
| (21) |
| (22) |
| (23) |
| (24) |
with conservation relations
and initial condition (6.3, 1.1, 3.2, 0.4, 0.16, 2.7, 0.1, 6.7, 5.8, 25.5).
The rate constants and other parameters that appear in these equations are given in Table 3.
Table 3.
Parameters in the model of the intracellular dynamics. Some parameters were estimated to fit the experimental data in (Kretzschmar et al., 1999).
| Parameter | Description | Value | Refs. | |
|---|---|---|---|---|
|
|
association (TGF-β) | b 4.44 nM−1 min−1, | (Schmierer et al., 2008; Chung et al., 2009) | |
|
|
dissociation (TGF-β) | 2.4 × 10⁻¹ min−1 | (Schmierer et al., 2008; Chung et al., 2009) | |
|
|
association (EGF) | 9.7 × 10⁻² nM−1 min−1 | (Hendriks et al., 2005) | |
|
|
dissociation (EGF) | 1.2 × 10⁻¹ min−1 | (Hendriks et al., 2005) | |
|
|
association (uSmad) | 2.4 × 10⁻² nM−1 min−1 | (Chung et al., 2009) | |
|
|
dissociation (uSmad) | 3.96 × 10⁻¹ min−1 | (Chung et al., 2009) | |
|
|
phosphorylation (Smad) | 2.4 × 10⁻¹ min−1 | (Chung et al., 2009) | |
|
|
association (iEGFAM) | 1.2 × 10⁻¹ nM−1 min−1 | estimated | |
|
|
dissociation (iEGFAM) | 2.8 × 10⁻¹ min−1 | estimated | |
|
|
activation (aEGFAM) | 8.15 × 10⁻³ min−1 | estimated | |
|
|
association (aEGFAM:uSmad) | 3.0 × 101 nM−1 min−1 | (Chung et al., 2009) | |
|
|
dissociation (aEGFAM:pSmad) | 9.6 × 10⁻¹ min−1 | (Chung et al., 2009) | |
| kA | inactivation (aEGFAM) | 1.7 × 10⁻¹ min−1 | estimated | |
| kS | dephosphorylation (Smad) | 3.96 × 10⁻¹–3.96 × 101) min−1 (1.3d-2) | (Chung et al., 2009) | |
| R10 | conservation constant (TGF-β -uSmad) | 104/cell (1.0d1 nM) | (Hendriks et al., 2005) | |
| R20 | conservation constant (EGF-iEGFAM) | 104/cell (1.0d1 nM) | (Hendriks et al., 2005) | |
| S0 | conservation constant (Smad) | 40 nM | estimated | |
| A0 | conservation constant (EGFAM) | 40 nM | estimated |
Figure 13 shows experimental and numerical results for EGF-TGF-β control over TEC growth. Kretzschmar et al. (1999) found that the Ras pathway inhibits the TGF-β-controlled anti-proliferation effect, as shown in Figure 13(A). Receptor-activated Smad2 or Smad3 translocates to the nucleus and forms a transcriptional complex on the activin/TGFb response element (ARE). Strong (up to 14-fold) activation of an ARE reporter construct (A3-Luc) by TGF-β was observed in nontumorigenic EpH4 cells (squares in Figure 13(a)), but only weak activation (2-fold) of A3-Luc by TGF-β was found in the v-Ha-Ras-transformed derivative, EpRas cells (triangles in Figure 13(a)), suggesting impaired Smad signaling. We did not model the detailed steps in the process, but rather, we assumed that pSmad represents a measure of activity similar to that of the ARE reporter construct (A3-Luc). Our model for the intracellular dynamics predicts that the EGF-Ras pathway can block the TGF-β-Smad pathway and lead to a reduced pSmad concentration and increased proliferation (Figure 13(B)). To compare the results, we assume that the EGF level is low under normal conditions, and that a high EGF level represents hyperactive Ras mutant cells (EpRas).
Figure 13.

(A) Activation of the A3-Luciferase reporter construct at the indicated concentration of TGF-β analyzed in EpH4 (squares) and EpRas, a Ras-transformed derivative, (triangles) of mammary epithelial cells. (Modified from (Kretzschmar et al., 1999) with permission.) (B) Model predictions: inhibition of pSmad level when ECs are exposed to a higher concentration of EGF. For comparison of the model predictions with normal (EpH4) and mutant (EpRas) cell responses in (A), we assume that increased signaling due to increased EGF is equivalent to the Ras-mutant response.
3.3 Mechanical effects on tumor growth
It is believed that mechanics plays a large role in ductal breast tumors. Healthy breast ducts and their surrounding stroma respond very sensitively to changes in compressive and tensile stresses to facilitate lactation. Paszek & Weaver (2004) note that mammary epithelial cells that have undergone a cancerous transformation also respond to stresses intracellularly by possibly increasing FGF and VEGF signalling to promote their proliferation and by increasing production of MMPs to promote invasion. They also note that a generally stiff breast tumor is interspersed with small regions that are significantly more compliant, and it may be that such material inhomogeneities contribute to breast cancer progression.
Since inertial effects are negligible for the slow movements involved in growth and division, there is no net force on ECs, and as long as the duct is not occluded there will be little mechanical feedback from the surrounding tissue. However, if proliferation of TECs leads to complete occlusion of the duct the tumor cells will begin to experience a reactive force from the surrounding tissue, which has been called the ‘reciprocal tissue resistance force’ (Paszek & Weaver, 2004). This reactive force can alter the cytoskeleton, open mechanosensitive channels, and lead to altered gene expression (Helmke & Davies, 2002; Chen et al., 2004). The stiffness of the surrounding tissue is increased after EC transformation (Krouskop et al., 1998) in an inhomogeneous manner, and differentiated and highly contractile myofibroblasts also contribute to stiffening by reorganizing collagen fibrils (Paszek & Weaver, 2004). The effects of these forces interact with those of many soluble factors in the ECM, leading to homeostasis in normal tissue, but it is not clear at present what type of perturbations are necessary to initiate malignant transformation (Paszek & Weaver, 2004). In the remainder of this section, communication between fibroblasts/myofibroblasts and TECs is mediated by soluble growth factors (EGF and TGF-β), and mechanical interaction between stroma and growing TECs inside the duct is incorporated in the model. Mechanical stresses influence growth in a phenomenologically-specified manner in the current model, but future work will address the effects of mechanical stresses on intracellular kinetics and other modes of interaction. We begin in the next section with a description of the cell-based component of the hybrid model.
3.3.1 The cell-based component
There are four different kinds of cells involved – ECs, TECs, fibroblasts, and myofibroblasts. ECs and TECs are modeled as in the KSO model (Kim et al., 2007) and a fibroblast or myofibroblast is considered as a point sink/source. The KSO model, which is based on an earlier model for the mechanical behavior of cells and tissues under stress (Dallon & Othmer, 2004), addresses three major aspects (i) how an individual cell reacts to forces on it, (ii) how cells interact mechanically with their surroundings, and (iii) how growth and division are described, and how stress affects growth. The cells are treated as oriented ellipsoids whose cytoplasm is an incompressible, viscoelastic solid. In the absence of growth their volume is constant under all deformations, and growth is included in series with the active response and the passive forces.
In the KSO model a cell can grow and divide into two daughter cells according to the algorithm given there, which incorporates an intrinsic cell volume V0 that cells attain immediately after division, an intrinsic cell-cycle time τc, and rules for how a cell divides under a given stress. Since the effect of stress is isotropic, all cells relax to a spherical shape, whatever their initial shape, in the absence of external forces. In the absence of nutrient or stress limitations cells grow to the volume 2V0 and then instantly divide into equal two daughter cells. Under external forces the orientation of cell division is determined by the direction of the net force exerted on the cell, as others have assumed.
Cells experience growth delay or inhibition as a result of several control mechanisms. The growth inhibition has two components. First, the growth along each axis is zero when the force acting on the cell in that direction is too compressive or tensile. The second, which is specific to the model used here, is a pSmad-dependent, switch-like component described shortly. Throughout we assume that there is an adequate supply of nutrients and we do not treat them explicitly.
Changes in the length of an axis a of a cell consist of the change due to the length of the spring-dashpot component ( ) and the change due to the growth ( ). This leads to two equations for the lengths of the axes that have to be solved subject to the volume constraint. We assume that the growth rate of TECs depends on the stress acting on the cells and the level of the phosphorylated Smad (Sp) independently, and thus we use the multiplicative form of the growth rate function for the ith axis given by
| (25) |
where σ is the stress acting on the cell and P is a function of Sp. The growth function f(σ) is defined so that cells grow under sufficiently small tensile and compressive stress, but do not if stresses are too large. As in Section 2, the growth rate due to stress decays linearly with increasing tensile or compressive stress (see Fig 4 in KSO for the explicit form of the stress dependence of growth). The function P(Sp) is defined as
| (26) |
and as a result growth is either on or off, the latter if either the stress or Sp is too large. The force balance equations for each cell are derived in KSO, taking into consideration all the forces acting on the cell: the adhesion forces, internal pressure, and other forces, and these are not repeated here. The solution of these equations provide the time-dependent track of each cell.
Here we restrict attention to two space dimensions, and therefore the cells are treated as oriented ellipses. In the context of the DCIS model, TEC growth is a passive process and active motion of the TECs is not incorporated. ECs are a key structural element for maintaining the integrity of a breast duct and do not proliferate unless it is necessary in order to maintain the integrity of the duct, and we assume that only TECs proliferate. Some cells on the ECM-cell interface are involved in active motion to invade into the stroma, and these types of motions are important in the later invasive stage or in certain types of brain tumor growth, but we do not include such active cell movement here.
3.3.2 The continuum components for mechanics and growth factors
As was indicated earlier, we use a continuum description for the mechanical response of the stroma outside the breast duct. The stromal region, denoted Ωs, is treated as a linear viscoelastic material as in KSO, where details of the constitutive equations and boundary conditions are given. Forces acting on the boundary between the stroma and the duct are calculated from the cell-based component, as shown in Figure 3 in KSO. These equations are solved using the finite element method based on the triangular mesh shown in Figure 14.
Figure 14.

(Left) Model domain: fibroblasts, myofibroblasts, and TECs interact via EGF and TGF-β. In the figure, the annular domain outside the duct is treated as a viscoelastic continuum region which consists of myo-epithelial cells and stroma. (Right) Changes in the length of the a-axis of a cell (the ellipsoid) under a given stress (fa; arrow) consist of the passive change in the first component, which comprises a Maxwell element in parallel with a nonlinear spring, and the change due to the growth ( ). The mechanical and growth elements are the same along all axes.
Myofibroblasts in the stromal tissue can exist in two states, an inactive one and an active one, and the latter as well as the fibroblasts are treated as point sources of EGF. Furthermore, we assume that the fibroblasts and myofibroblasts are randomly distributed initially, and we ignore the possible chemotaxis-driven migration of myofibroblasts toward tumor sites. These assumptions allow us to model cells as fixed sites, thereby avoiding the development of a realistic model for cell migration through the complex ECM. An inactive myofibroblast is activated in response to a sufficiently high level of TGF-β at the location of that cell, and both fibroblasts and myofibroblasts secrete EGF at a constant rate – higher for the latter than for the former. The spatial distributions of EGF and TGF-β evolve according to reaction-diffusion equations that include the effects of the point sources due to cell secretion. We let E(x, t) and T(x, t) be the concentration of EGF and TGF-β respectively, and we assume that there is no flux of EGF or TGF-β at the outer boundaries of the domain shown in Figure 14. We also assume that (i) there are fixed a total number of fibroblasts and myofibroblast near the duct, (ii) initially all myofibroblasts are inactive, and (iii) cells in the duct (ECs and TECs) produce TGF-β, and these cells are moving sources for TGF-β. The governing equations for E(x, t) and T(x, t) are as follows.
| (27) |
Here DE and DT are space-dependent diffusion coefficients of EGF and TGF-β respectively, and are the locations of TECs, fibroblasts, and myofibroblasts at time t, respectively. Nt, Nf, and Nm are the total number of TECs, fibroblasts, and myofibroblasts, respectively, V* is the volume of the extracellular medium, are the volumes of a fibroblast, myofibroblast, and epithelial cell, respectively, and ν is the outer unit normal of the boundary of the region containing the duct and the ECM. The volumes of fibroblasts, and myofibroblasts are constant, but the volume of TECs is variable, since they grow and divide. The threshold function for activation of myofibroblasts is
| (28) |
We have assumed that ECs and TECs secrete TGF-β at the same rate, and thus the only difference between ECs and TECs is that the latter proliferate when the pSmad level drops below the threshold .
The reaction-diffusion equations (27) are solved on the regular grid using the alternating-direction implicit (ADI) method and the nonlinear solver nksol for algebraic systems. A typical spatial grid size used is hx = hy = 0.01 on a square domain of 1 mm side length. An initial time step of 0.001, which corresponds to 3.6 seconds, was used, but adaptive time stepping based on the number of iterations is used to control this step. After convergence of the solution step for the growth factors, the level of pSmad (Sp) at all EC locations is checked in order to determine whether the cells on the duct wall have to be transformed to TECs and DCIS has to be initiated. We also have to transfer the EGF flux from the fibroblast/myofibroblast locations to grid points in order to update the reaction-diffusion equations. For this purpose the EGF level at the center of the cell is used, and interpolation to and from grid to cell is done as described in Dallon & Othmer (1997). We also use the level of TGF-β at a site to determine if a myofibroblast is to be activated. Details concerning the numerical algorithm for this mixed on-lattice, off-lattice scheme can be found in Dallon & Othmer (1997).
3.4 Computational results
Figure 15 shows the tumor patterns that result from one, two, or three TECs initiated at different EC locations on the breast duct. These histological patterns of ductal carcinomas have been observed experimentally and are called micropapillary (a), tufting (b) (Bostwick et al., 1993), cribriform (c), and solid (Winchester et al., 2000), respectively. Rejniak & Dillon (2007) investigated this patterning in the absence of the surrounding tissue and concluded that two key parameters, variability in cell orientation and cell replication, may determine those four patterns. What is lacking in their model is mechanical feedback from the surrounding stroma via the reciprocal tissue resistance force. In fact, in our simulations, we observe that the cribriform pattern at the initial stage (days 5–7) later turns into the solid pattern (after day 10). Even though the patterns in the three cases appear different at intermediate stages of development, all tumors eventually merge to a solid pattern and continue to grow outward against the resistance of the stroma. Thus the distinct patterns may simply be transient patterns enroute to complete occlusion of the duct in DCIS, after which the stresses from the surrounding stroma play a large part in the further growth of the tumor. We also observe different patterns when we change certain mechanical or biochemical properties, such as the adhesion strength between cells or between cells and breast duct (data not shown).
Figure 15.

The patterns of growth of activated TECs at different locations. One (Figures (a)–(d)), two (Figures (e)–(h)), and three (Figures (i)–(l)) TECs initially grow to occlude the duct after 10 days.
Since these simulations were done in a two-dimensional cross section, the effects of growth only in the radial direction are considered in Figures 15–20 but the growth effects in longitudinal direction are shown in Figure 21. 3D hybrid simulations will reveal more realistic patterns of intraductal microarchitectures. As noted in Rejniak & Dillon (2007), the direction of cell division plays a significant role in determining the variable tumor growth patterns, and our preliminary study shows quite different patterns might be generated when different division rules are applied (data not shown). This would be important for maintaining homeostasis of normal ductal structure in particular. It is also not clear how the original location(s) of TECs is determined, but it is likely that these locations reflect the location of the first viable clones of transformed cells. Here we simply specify TECs at random locations, but as shown in Figure 12, the transition from ECs to TECs is controlled in part by interactions between fibroblasts and established TECs via EGF and TGF-β. A more detailed investigation of the role of the microenvironment in the initial development of TECs remains to be done.
Figure 20.

The effect of blocking TGF-β secretion from ECs. (a) The activation time of TECs and myofibroblasts as a function of TGF-β secretion rate. Larger TGF-β secretion rates lead to earlier activation of both TECs and myofibroblasts. (b) The TEC population at day 10 as a function of the TGF-β secretion rate. TEC population at day 10 were reduced compared to the control.
Figure 21.

The effect of stiffer stromal tissue on tumor growth. Upper stromal tissue has larger stiffness than lower stromal tissue. In general, TECs grow in longitudinal direction but generate bulb shape in less stiff (lower) stromal directional.
In figure 16 we show the results of computations that illustrate how the interaction between TECs and stromal cells (fibroblasts and myofibroblasts) can regulate both the conversion of ECs into TECs and the growth of TECs. The process is initiated by a higher level of TGF-β signaling by ECs, which in turn triggers fibroblasts to proliferate more rapidly, followed by differentiation of some fibroblasts into myofibroblasts when the TGF-β level exceeds the threshold thT = 0.757 nM in the stromal tissue at about 76 h. The increased level of EGF leads to the activation of ECs into TECs when the pSmad level at the EC site drops below the threshold at about 90 h, and these new TECs grow inward in the duct. This positive feedback between the fibroblasts and TECs continues, and the expanding tumor exerts force on the breast duct wall which generates a reactive force from the viscoelastic stroma. Despite the fact that we do not consider longitudinal growth in this simulation, our model shows the importance of the TEC-stroma interaction in the initiation and early enhancement of TEC growth inside the duct. In the simulation we simply activate myofibroblasts at the pre-determined locations near the duct, rather than including another set of equations to describe the transition from fibroblasts to myofibroblasts. The locations of fibroblasts/myofibroblasts are indicated in Figure 16(g). Figure 16(h) shows the time evolution of the TEC population within the duct. The time evolution of the pSmad level for the 1st cell, which is indicated by an arrow in 16(a), is shown in Figure 16(i). The pSmad level for this cell decreases quickly due to the emergence of myofibrobasts, which have a higher EGF production rate ( ), around t=76 h, and reaches the threshold value for transformation of that EC into a TEC around t=90 h. The effect of myofibroblasts is discussed in more detail in the Figure 18. Even though we made a simple but reasonable assumption that pSmad acts as a switch for proliferation, it is not clear whether this rule can be applied to the entire EC population along the duct, since it may be that only a few activated ECs are necessary to ensure the survival of the tumor.
Figure 16.

(a–f) The temporal evolution of TEC growth inside a duct. The panels show the configuration of TECs and the stromal mesh at 2 h (a), 90 h (b), 200 h (c), 300 h (d), 400 h (e), 478 h (f). ECs are activated into TECs and begin to grow (~ t = 90h), when pSmad values drops below the threshold value ( ). Activated TECs and their progeny are gray in (b–f) while unactivated ECs are green in (a). (g) The location of fibroblasts (blue) and myofibroblasts (red). These cells are fixed sources of EGF in the simulation. Initially only three fibroblasts were located in the computational domain and myofibroblasts are activated when the TGF-β level exceeds thT = 0.7567 nM (~ t = 76h). (h) The temporal evolution of number of TECs. (i) The temporal evolution of the pSmad concentration at one TEC site (marked by an arrow in (a)). Similar profiles of pSmad are observed for all TECs.
Figure 18.

The effect of myofibroblasts on tumor growth. (a,c) The configurations of cells within a duct and of the stroma surrounding the duct at t=378 h in the presence (a) and absence (c) of myofibroblasts. (b,d) EGF concentration profile at t=378h in the presence (b) and absence (d) of myofibroblasts. (e) pSmad concentration of a selected cell ci with cell location in (f). In the absence of myofibroblasts, the pSmad level has not reached the threshold value ( ) and ECs are not activated (dotted line). However, in the presence of myofibroblasts the pSmad level drops below the threshold (arrow) and ECs become TECs. (f) Trajectories of the moving cell (ci) in the presence of and absence of the myofibroblasts in the stromal tissue respectively. The site was the center of cell mass. The dotted lines indicate the regular computational grid (hx=0.01 on [0, 1]2). (g) The time evolution of the EGF concentration at the cell site selected in (f) above. (h) TGFβ concentration at a myofibroblast site with approximate location (0.358, 0.126).
Figure 17(a–c) and Figure 17(d–f) show the concentrations of EGF and TGF-β at t = 2 h, 80 h, and 478 h, respectively. The early high level of EGF at three cells (figure 17(a); t=2 h) later evolves into many localized peaks at the sites of fibroblasts/myofibroblasts at t = 80 h and 478 h (figure 17(b–c)), as myofibroblasts become activated at about 76 h. This occurs in response to elevated values of TGF-β at these sites that has diffused outward from TGF-β-secreting ECs and TECs in the duct. The EGF released diffuses toward the duct and activates ECs. In the early stages of the simulations, when ECs are not yet activated, TGF-β is localized at the duct periphery (figure 17(d)) and diffuses into the surrounding stroma. Later the highest levels of TGF-β are concentrated in the duct interior following transformation of ECs to TECs (after t= 96 h) and increased TGF-β secretion within the duct (figure 17(f)). Examples of pSmad values inside three representative cells (cell index=1, 20, 30) at the corresponding times (t = 2 h, 80 h, 478 h) are shown in Figure 17(g–i). These figures show that initially high pSmad values (t=2 h) at these selected EC sites decrease as time progresses, eventually leading to pSmad values below the threshold for transformation.
Figure 17.

The concentrations (in nM) of EGF (a–c) and TGF-β (d–f), on the dimensionless domain [0,1]2 at time t = 2 h (a,d), 80 h (b,e), 478 h (c,f). Initial conditions for EGF and TGF-β were 3.0d-10, 3.0d-10 respectively. (g–i) pSmad concentration (nM) at the selected cell sites (1st, 20-th, 30-th cell site) at time t = 2 h (g), 80 h (h), 478 h (i). Intial high values (~ 20.5 nM) of pSmad at the cell sites significantly decreased (~ 5.1 nM) below the threshold value ( ) for higher levels of EGF and TGF-β in (c) and (f).
Figure 18 shows the effect of myofibroblasts on TEC growth and the evolution of other components. In the presence of myofibroblasts the ECs are activated and TECs proliferate (Figure 18a) due to the high level of EGF secreted by myofibroblasts (Figure 18(b)). In the absence of myofibroblasts TEC growth is inhibited (Figure 18(c)) due to the low level of EGF (Figure 18(d)). This dramatic difference is due to the large difference in pSmad and EGF concentrations between the two cases (shown for one cell in Figures 18(e) and (g)). These results show that the myofibroblasts are required to achieve the elevated EGF production necessary to lower pSmad levels to the threshold level for TEC activation. As shown in figures 18(b) and 18(d), the difference in EGF concentrations in the presence and absence of myofibroblasts is dramatic, which results from the fact that EGF secretion rates from myofibroblasts are typically 2–10 times larger than fibroblast secretion rates. In addition, the fibroblast population is smaller than the myofibroblast population. As shown above in Figure 16(i), most ECs are activated by 96 h, which implies that the presence of fibroblasts is not sufficient to activate TECs and secretion of EGF by myofibroblasts is crucial for TEC activation and growth in the duct. While pSmad concentration slowly decreases as a function of time due to an increased EGF concentration from fibroblasts alone, the pSmad level decreases much more rapidly when activated myofibroblasts are present in the stroma, which in turn leads to TEC activation. (see figure 18(e)).
The trajectories of a moving epithelial cell (given by its center of mass) are shown in figure 18(f). This movement of the cell is due to passive growth, not active migration, and its location is bounded by four computational cells (Qi, i = 1, …, 9) shown. In the absence of myofibroblasts, none of the ECs were activated by 20 days and the trajectory of the same cell in (f) is bounded by a computational grid (Q1, Q2, Q5, Q4) (data not shown). Figure 18(g) shows the time evolution of the EGF concentration at this cell site. The EGF level increases much more rapidly when myofibroblasts are activated around 76 h, which corresponds to the sudden drop of pSmad shown in (e), as compared to the slow increase in EGF from fibroblasts alone. The TGF-β concentration in the presence of both fibroblasts and myofibroblasts is also significantly different as compared to that when only fibroblasts are the source, since many more ECs become transformed to TECs, thereby increasing the source of TGF-β in the duct. Figure 18(h) illustrates the TGF-β concentration at a myofibroblast site (0.358, 0.126). The TGF-β concentration increases slowly with time when only fibroblasts are present, but it increases much more rapidly when a significant number of myofibroblasts are present. To simulate the absence of myofibroblasts we assumed that myofibroblasts are not activated even when TGF-β concentration is above the threshold thT, and the results indicate that activation of myofibroblasts in the stroma plays a significant role in communicating with the ECs in the duct. In early breast cancer development, myofibroblasts are abundant near a breast duct in the stromal tissue and our results indicate that they play a significant role in the activation of TECs and enhancement of tumor growth.
In Figure 19 we investigate the effect of myofibroblast location on activation of both TECs and myofibroblasts. Since the interaction between TECs and these stromal cells results from counter-diffusion of EGF and TGF-β, these interactions are strong and both cell types are activated earlier when myofibroblasts are located close to TECs in the duct. It is clear from this that if myofibroblasts are also chemotactic to TGF-β the strength of the positive feedback would be further enhanced. This figure also confirms the important role of myofibroblasts in enhancing TEC growth by activating TECs at the earlier stages of cancer development.
Figure 19.

The effect of myofibroblast location on activation of TECs and myofibroblasts. Thirteen myofibroblasts were located on a circular track as in Figure 16(g), but at various distances (20, 120, 220, 320 μm) from the duct periphery. When TECs and myofibroblasts are located close to each other, both cell types are activated at earlier times due to the relatively short diffusion distance.
We also tested the effect of TGF-β secretion rates on TEC growth and the activation of TECs and myofibroblasts. When TGF-β secretion rates are increased, both TECs and myofibroblasts are activated at an earlier time (Figure 20(a)), and the TEC population at day 10 is also increased (Figure 20(b)). A qualitatively similar result can be achieved by increasing the diffusion rates of EGF and TGF-β (data not shown). As we saw earlier, it can be difficult for fibroblasts alone to generate a sufficiently high level of EGF for activating TECs and increasing TEC growth. This figure and Figure 22 below imply that it is important to block secretion of both TGF-β and EGF (or to lower the diffusion rates of the signals) in order to achieve slower TEC growth.
Figure 22.

Simulated therapy – the effect of blocking EGF secretion from fibroblasts. (a) Activation time of TECs and myofibroblasts as a function of EGF secretion rate ( ). The secretion rate of EGF from both fibroblasts ( ) and myofibroblasts ( ) were reduced by 2-, 3-, and 5-fold compared to the control case. There are delays in activation of TECs when EGF secretion rates are reduced, while the activation time for myofibroblasts remains the same, the latter a reflection of the fact that ECs and TECs secrete at the same rate. (b) The TEC population at day 10 compared to the control (arrow). (c) Time evolution of pSmad concentration at one epithelial cell near (0.4, 0.5) for the four cases of decreased EGF secretion rate considered. Myofibroblasts are activated for all four cases around 76 h when TGF-β reaches the threshold, while the pSmad level decreases slowly for smaller values of the EGF secretion rate, leading to a delay of the TEC activation time. (d) Initially slow increase of EGF concentration at (0.42, 0.5) near breast duct membrane begins to accelerate when myofibroblasts are activated at 76 h for all four EGF secretion rates considered.
As observed earlier, a variety of stromal components can contribute to the stiffening of stromal tissue, including reorganization of collagen fibrils by myofibroblasts (Paszek & Weaver, 2004) and local stiffening after TEC transformation (Krouskop et al., 1998). Furthermore, an increase of the reactive force due to the growth of TECs then may lead to tumor invasion in later stages (Paszek & Weaver, 2004). In Figure 21 we show the effect of stress on TEC growth in a longitudinal cross-section of a duct. Two activated TECs grow in the longitudinal direction in the face of resistence from stromal tissue above (stiffer) and below (more compliant). Due to the stiffer stromal tissue above the growth is confined to the longitudinal direction, whereas when the stroma is more compliant the growing tumor forms a bulge. In any case the TECs grow inward first to fill up the duct, as in the case of growth patterns in the radial direction in Figure 15. Once the space is filled near the origin of TECs, TECs begin to feel a reciprocal tissue resistance force from the surrounding stromal tissue and tend to grow in the longitudinal direction, i.e., in the direction of less stress. This is qualitatively consistent with experimental results described earlier on anisotropic growth (Helmlinger et al. (1997); Cheng et al. (2009)).
It has been suggested that attacking the active players that facilitate the interaction between the TECs and the stroma, such as fibroblasts, may result in better clinical outcomes in breast cancer patients. In Figure 22, we display results of tests to determine the effect of blocking EGF secretion from both fibroblasts and myofibroblasts. We consider EGF secretion rates that are decreased by factors of 2, 3, and 5, from the control case, which simulates the effect that a hypothetical drug may have. The TEC population at the final simulation time (t=10 days) is reduced by 49%, 33%, and 10% for a 5-,3-, and 2-fold rate decrease, respectively, when compared to the control (see Figure 22(b)). This reduction is due to delays of TEC activation due to the decreased rate of EGF secretion by fibroblasts and myofibroblasts. This is seen in Figure 22(d), where it is clear that slower EGF secretion rates result in slower increases in EGF concentration that in turn lead to slower decrease in the pSmad level at the TEC site. To illustrate this point, we chose an epithelial cell near (0.42, 0.5) and displayed the time evolution of pSmad in this cell in Figure 22(c), and the EGF concentration at this location (see Figure 22(d)).
4 Conclusions and open problems
It is now well established that the TME, which comprises cell types such as epithelial and endothelial cells, inflammatory cells, fibroblasts, and myofibroblasts, as well as the surrounding ECM, affects tumor growth and metastasis (Samoszuk et al., 2005). Cells in the TME communicate via secreted cytokines and growth factors, and are subject to the mechanical forces transmitted through the TME that arise from tumor expansion. Fibroblasts and macrophages are of particular interest because both in vitro and in vivo studies have shown that they contribute to the formation and growth of tumors (van den Hooff, 1988).
In Section 2 we presented a mathematical model of a tumor growing in an agarose gel. Both the tumor and the gel are treated as single-phase hypoelastic continua, and the model equations are solved in a three-dimensional domain using the finite element method. The results here constitute the first set of numerical simulations in three-dimensions that investigate the effects of inhomogeneous material properties on non-spherical tumor growth. Nonetheless, there are several limitations of the continuum model described here. The first, as discussed earlier, is that it is necessary to start with a larger tumor than in experiments. However, as also noted, a hybrid model such as the one described in Section 3 can remedy this and allow us to start growth with a single cell. Second, we assume homogeneous material properties of the tumor and agarose and do not consider local modulations in stiffness due to formation of the necrotic core and compression of the tumor, nor do we consider the effects of stress on the stiffness of the surrounding agarose gel. These effects can be incorporated in the model as more experimental evidence regarding them becomes available. In spite of these limitations, the numerical investigations here have enabled us to gain some insight into the effects of mechanical stresses on tumor growth. In particular, we show that the effect of stress on tumor growth is very complicated, and it is likely that these effects are nonlinear and/or anisotropic.
There remain various unanswered questions regarding the stress affects on tumor growth, and the mathematical model presented here provides a framework to address several of these questions mathematically. Some of these questions include what is the form of a nonlinear stress feedback function that would appropriately amplify local variations in the stress gradient. Ambrosi and Mollica use an exponential stress feedback that depends on the bulk stresses and apply this function to spherically-symmetric tumor growth (Ambrosi & Mollica, 2004). They obtain results that compare to experiments qualitatively, but the use of their exponential stress feedback has not been attempted in the three-dimensional context. Another question that arises is whether or not the stress feedback should depend on average bulk stresses or does tumor growth depend on the maximum bulk stress. Also, it is not clear whether tensile and compressive stresses affect tumor growth differently, and how shear stresses should be incorporated into an anisotropic stress feedback. These are all open problems that will be addressed in future work.
The questions that arise here also call for further experimental investigation. It would be beneficial to know whether shear stresses affect tumor growth rates positively or negatively, as bulk stresses do. Spatial dependence of stresses in an experimental setting in which tumor growth rates are spherically inhomogeneous (such as in the capillary tube experiment of Helmlinger et al. (1997)) may shed light on the type of stress feedback that tumors experience. Knowledge of material properties of necrotic tumor regions would also benefit further mathematical, and in turn experimental, investigation.
The hybrid model for DCIS has the potential for many other computational experiments not done here to understand the interaction between the tumor and the microenvironment. Easy extensions of the current model include (i) the role of myofibroblast motility, (ii) a sensitivity study for certain important parameters such as TGF-β secretion rate, the transition rate from fibroblasts to myofibroblasts, diffusion coefficients of growth factors, and pSmad production rate, (iii) ECM stiffening to account for changes observed after EC transformation (Krouskop et al., 1998), and (iv) inclusion of proteinase secretion by fibroblasts.
The last of these illustrates the need for a more detailed treatment of the early steps of cancer invasion into the surrounding tissue, and the later migration of cells through the ECM. Both the myoepithelial cells and the basement membrane in normal breast tissue or DCIS define a clear boundary between stromal tissue and the epithelial cell layer in the breast duct. This layer forms a continuous sheet connected by intermediate or gap junctions and intercellular adhesion molecules for mechanical support of the duct structure. Due to the tight connections, it only allows passage of small molecules in normal duct, acting like a semi-permeable membrane in the two-chamber system in Kim et al. (2010). It was found that myoepithelial cell layer breakdown is an early indicator of the formation of an aggressive cell clone and may be associated with tumor invasion in breast cancer (Man et al., 2003).
Experiments and modeling work in Kim et al. (2010) confirmed the role of fibroblasts on promotion of TEC growth in vitro. Kim & Friedman (2009) extended the model to investigate how fibroblasts and myofibroblasts in the stroma affect tumor cell invasion in a Boyden Invasion Chamber. The semi-permeable membrane between two chambers mimics the layers of basal membrane and myoepithelial cells between the duct and the stroma, but the detailed intracellular dynamics of the EGF-TGF-β pathways, a realistic geometric representation of the duct structure, and the mechanical interaction between stroma and duct are not included.
The hybrid model developed herein is a first step toward incorporating these factors, and can be used both for in vitro experiments and in vivo studies. A hybrid model has numerous advantages which stem from the fact that changes in biochemical pathways or mechanical properties can be made in selected cells, which the majority of the tissue is treated as a continuum. For instance, one can easily alter individual properties such as adhesion, or study the effect of therapeutic drugs on individual cells in a heterogeneous population. An important further step not treated here is to extend the model to three space dimensions to understand, e. g., the growth patterns in a geometrically-realistic duct, to investigate the role of fibroblasts/myofibroblasts distributed in 3D, and to study the dependence of direction of division on growth rates and tissue properties. One can test and reproduce the experimental results by Cheng et al. (2009), in which an oval shaped spheroid is observed when anisotropic compression is applied in one direction. As discussed in the background section, ECs and TECs show different sensitivities to external mechanical stimuli, and the individual cell model is well suited to investigate this effect. Another direction concerns the extension of the model to include invasion of individual cells through the ECM. Cell migration is a complex process since the microenvironment is a heterogeneous material including proteins, cells, and extracellular fibril structures. More detailed and realistic quantitative data may be derived from a model that includes continuous mechanical feedback between a cell and the collagen network, which in turn may lead to a better understanding of cell motility through the ECM.
Understanding the relationship between a tumor and its microenvironment may lead to important new therapeutic approaches in controlling the growth and metastasis of cancer. Indeed, instead of targeting the tumor cells, one may target stromal elements in order to manipulate the host-tumor interaction in a way that will inhibit growth and metastasis of the tumor (Chen et al., 2008). For instance, remodeling of the microenvironment can create an elevated interstitial fluid pressure and increased resistance to movement. Several drugs in current use target tumor associated fibroblasts or tumor associated macrophages (Chen et al., 2008), and studies such as reported here can shed light on unforeseen effects of these agents.
Figure 11.

(Left) A normal breast duct, showing one layer of epithelial cells (purple rectangles) enclosed by a layer of myo-epithelial cells (brown triangles) followed by the basement membrane and the stroma (from Paszek & Weaver (2004), with permission). Fibroblasts (white diamonds) are sparsely distributed in stromal tissue. (Center) DCIS: A necrotic core does not develop because the tumor is small and the nutrient can permeate throughout it (from Ma et al. (2003) with permission.) (Right) A high-grade (comedo) DCIS. The larger size leads to a necrotic core at the center due to hypoxia. The arrows (a–d) indicate the necrotic core (a), the proliferating zone (b), the duct wall (c), and the healthy stroma (d), respectively (from Franks et al. (2005) with permission.)
Table 4.
Parameters that are used in the ECM model.
| Parameter | Description | Value | Refs. | |
|---|---|---|---|---|
| Diffusion coefficients (cm2 s−1) | ||||
|
|
EGF in surrounding tissue | 5.18 × 10⁻⁷ | (Thorne et al., 2004) | |
|
|
EGF in the duct | 1.66 × 10⁻⁶ | (Thorne et al., 2004) | |
|
|
EGF in tumor | 1.0 × 10⁻⁷ | this work | |
|
|
TGF-β in surrounding tissue | 1.8 × 10⁻⁷ | (Brown, 1999; Koka et al., 1995; Woodcock et al., 1993) | |
|
|
TGF-β in the duct | 3.6 × 10⁻⁷ | this work | |
|
|
TGF-β in tumor | 1.0 × 10⁻⁷ | this work | |
| Production rates | ||||
|
|
production rate of EGF from fibroblasts | 1 × 10⁻⁶–5 × 10⁻⁴ pg/(cell·h) (1.0d-6) | (Danielsen & Rofstad, 1998), this work | |
|
|
production rate of EGF from myofibroblasts | 2.09 × 10⁻⁶ pg/(cell · h) | this work | |
|
|
production rate of TGF-β from TECs | 3.86 × 10⁻⁵ pg/(cells · h) | (Wakefield et al., 1987), this work | |
| decay rates | ||||
| dE | EGF | 3.6 × 10⁻³ h−1 | (Kudlow et al., 1986), this work | |
| dT | TGF-β | = dE | this work | |
| Threshold values | ||||
| thT | the threshold TGF-β value for activation of myofibroblasts | 0.7567 nM | (Kunz-Schughart et al., 2003), this work | |
Acknowledgments
Supported in part by NIH Grant GMS # 29123, NSF Grants DMS # 0517884 and DMS # 0817529 to HGO, and the Minnesota Supercomputing Institute. Y. Kim is partially supported by an NSF grant to the Mathematical Biosciences Institute, OSU, and by a Rackham grant, University of Michigan-Ann Arbor.
A Glossary of selected terms and abbreviations
- angiogenesis
the development of new blood vessels, especially in tissues where circulation has been impaired by trauma or disease, e.g cancer
- angiogenesis inhibitors
agents and endogenous substances that antagonize or inhibit the development of new blood vessels, e.g. endostatin, angiostatin
- apoptosis
programmed cell death characterized by nuclear breakdown and removal of remains by phagocytes
- basement membrane (BM)
thin layer of extracellular matrix lying between the epithelium and its underlying connective tissue
- capillaries
the finest branches of blood vessels which connect small arteries and small veins
- chemotaxis
the directed movement of a microorganism or cell in response to a chemical stimulus
- cadherin
A protein used in cell-cell adhesion, especially in epithelial cells
- carcinoma in situ
a confined neoplastic tissue
- collagen
fibrous protein that is a major component of the extracellular matrix and connective tissues. These have a high tensile strength and exist in many forms; type I; the most common, is found in skin, tendon and bone; type II is found in cartilage; type IV is present in the basement membrane
- connective tissue
supporting tissue that consists of cells embedded in a relatively large amount of extracellular matrix
- cytokine
extracellular signaling protein that acts as a local mediator in cell-cell communication. Those involved in taxis are sometimes called chemokines
- dysplasia
intermixing of differentiated and altered cells causing tissue disorganization
- endothelium
single sheet of flattened cells (endothelial cells) that forms the lining of all blood vessels. These regulate exchanges between the bloodstream and surrounding tissues and is usually surrounded by a basement membrane
- epithelial cell (EC)
A cell type that forms surfaces, the linings of cavities, etc. They are polarized and adhere via cohesive interactions to neighboring cells, which leads to formation of continuous cell
- epithelial-mesenchymal transition (EMT)
The transition from the immotile, tightly-coupled cell state in a cell sheet to the motile, free-ranging state. This is an essential step in the transition to invasiveness
- extracellular matrix (ECM)
complex network of proteins (such as collagen) secreted by cells. Serves as a structural element in tissues
- fibroblast growth factor (FGF)
multi-functional growth factor present in several tissues in vivo and is synthezied by a number of cell types in vitro. Basic FGF (bFGF) can bind with high affinity to heparin sulfate proteoglycans. Also known as heparin-binding factor
- fibronectin
serves as an extracellular adhesion molecule by anchoring cells to collagen. Is secreted by fibroblasts, endothelial cells, macrophages, as well as certain epithelial cells
- focal adhesion
a transmembrane macromolecular complex comprising integrins and other proteins through which both mechanical force and regulatory signals are transmitted
- growth factor
an extracellular signaling molecule that stimulates a cell to grow or proliferate, e.g. vascular endothelial growth factor (VEGF) and fibroblast growth factor (FGF)
- haptotaxis
the movement of a cell up an adhesive gradient
- heparin sulfate proteoglycan
an abundant component of most extracellular structures and can bind growth factors (such as TGF-β s and FGFs), proteases and protease inhibitors. The plasma membrane (cell surface) proteoglycans can bind to ECM components
- homeostasis
refers to the ability of a system to maintain its internal state within tolerable limits in the face of changes in the external state of the system
- hypoxia
the reduction of oxygen levels
- integrins
member of the large family of transmembrane proteins involved in the adhesion of cells to the extracellular matrix
- macrophage
a type of scavenger cell that engulfs cellular debris and damaged cells by phagocytosis. Some macrophages are free-moving, others are located in fixed locations (e.g. Kupffer cells in the liver)
- matrix metalloproteinase (MMPs)
proteolytic enzymes that degrade extracellular matrix. They are inhibited by tissue inhibitors of matrix metalloproteinases
- mesenchymal cell
mural precursor cell that is capable of replication as an undifferentiated cell or differentiating into connective tissue, blood vessel, or lymphatic cells. They exhibit little interaction between cells, are not polarized, and can be motile and thus invasive
- metastasis
the process by which cancer spreads from the site of initiation of the primary tumor to distant locations in the body. This occurs via either the circulatory system or the lymphatic system
- monocyte
type of white blood cell produced in the bone marrow. Monocytes remain in the blood stream for a short time and then migrate to tissues and mature into macrophages
- monocyte chemotactic protein-1 (MCP-1)
chemotactic and activating signal for monocytes, expressed mainly by tumor cells as well as ECs, fibroblasts, and macrophages
- mural cell
A smooth muscle cell or pericyte
- mutation
Any change in the genetic information relative to a reference “wild-type” genome, including changes that affect expression of genes without altering their coding sequences and changes that do not cause any detectable phenotypic difference (silent mutations). Chromosomal mutations involve deletion, inversion, duplication, or other changes of a portion of a chromosome
- nectins
Nectins and nectin-like molecules (Necls) are immunoglobulin-like transmembrane cell adhesion molecules expressed in various cell types
- neoplasia
The abnormal, uncontrolled proliferation of cells, usually uncoordinated with that of the normal tissue around it
- neoplasm
A solid lesion formed by neoplastic growth of cells It usually causes a lump or tumor. Neoplasms may be benign, pre-malignant or malignant
- oncogenes
these are genes that, when mutated or over-expressed, contribute to cancer in a positive, gain-of-function manner and are dominant (as opposed to recessive). A proto-oncogene is a normal gene that can become an oncogene due to mutations or increased expression
- platelet-derived growth factor (PDGF)
a protein, produced by platelets and other cells, that strongly stimulates cell growth and division and is involved in mural cell recruitment in angiogenesis
- p53
a tumor suppressor protein involved in regulation of the cell cycle
- ras
A small G-protein involved in many signal transduction pathways
- somatic mutation
a heritable change in the DNA that can be passed to the progeny of the mutated cell in the course of cell division. Distinquished from germ line mutations, which are heritable changes in the germ cells (i.e., sperm and eggs). Somatic mutations are frequently caused by environmental factors, such as exposure to ultraviolet radiation or to certain chemicals
- stroma
The supportive framework of an organ (or gland or other structure), usually composed of connective tissue
- stromal cells
Cells that make up the support structure of biological tissues and support the functional organ or parenchymal cells. Fibroblasts, immune cells, pericytes, endothelial cells, and inflammatory cells are the major types of stromal cells
- transforming growth factor beta (TGF-β)
synthesized in a wide variety of tissues including platelets, placenta, and both normal and transformed cell lines. TGF-β has a potential role in embryonic development, cellular differentiation, hormone secretion and immune function. Shown to act as a negative autocrine growth factor
- tumor angiogenic factor (TAF)
a substance causing proliferation of new blood vessels. Found in hypoxic tissues, or tissues with high metabolic requirements, such as in certain cancers
- tumor-associated fibroblast (TAFB)
fibroblasts that interact with a developing tumor via growth factor signalling networks
- tumor-associated macrophage (TAM)
macrophages that are attracted to solid tumor sites
- vascular endothelial growth factor (VEGF; also called vascular permeability factor, VPF)
an endothelial-cell specific mitogen that has been shown to be a critical regulator of vascular development and growth
Footnotes
A glossary of terminology is included at the end of this manuscript.
Publisher's Disclaimer: This is a PDF file of an unedited manuscript that has been accepted for publication. As a service to our customers we are providing this early version of the manuscript. The manuscript will undergo copyediting, typesetting, and review of the resulting proof before it is published in its final citable form. Please note that during the production process errors may be discovered which could affect the content, and all legal disclaimers that apply to the journal pertain.
Contributor Information
Yangjin Kim, Department of Mathematics & Statistics, Univ of Michigan - Dearborn, Dearborn, MI 48128-2406.
Magdalena A. Stolarska, Department of Mathematics, University of St. Thomas, St Paul, MN 55105
Hans G. Othmer, School of Mathematics and Digital Technology Center, University of Minnesota, Minneapolis, MN 55455
References
- Adams EF, Newton CJ, Braunsberg H, Shaikh N, Ghilchik M, James VH. Effects of human breast fibroblasts on growth and 17 beta-estradiol dehydrogenase activity of MCF-7 cells in culture. Breast Cancer Res Treat. 1988;11(2):165–72. doi: 10.1007/BF01805840. [DOI] [PubMed] [Google Scholar]
- Ambrosi D, Mollica F. The role of stress in the growth of a multicell spheroid. J Math Biol. 2004;48:477–499. doi: 10.1007/s00285-003-0238-2. [DOI] [PubMed] [Google Scholar]
- Araujo RP, McElwain DLS. A history of the study of solid tumour growth: The contribution of mathematical modelling. Bull Math Biol. 2004;66(5):1039–1091. doi: 10.1016/j.bulm.2003.11.002. [DOI] [PubMed] [Google Scholar]
- Balaban N, Schwartz U, et al. Force and focal adhesions assembly: a close relationship studied using elastic micropatterned substrates. Nature Cell Biology. 2001;3:466–472. doi: 10.1038/35074532. [DOI] [PubMed] [Google Scholar]
- Bershadsky AD, Balaban NQ, Geiger B. Adhesion-dependent cell mechanosensitivity. Annu Rev Cell Dev Biol. 2003;19:677–95. doi: 10.1146/annurev.cellbio.19.111301.153011. [DOI] [PubMed] [Google Scholar]
- Bershadsky AD, Ballestrem C, Carramusa L, Zilberman Y, Gilquin B, Khochbin S, Alexandrova AY, Verkhovsky AB, Shemesh T, Kozlov MM. Assembly and mechanosensory function of focal adhesions: experiments and models. Eur J Cell Biol. 2006;85:165–173. doi: 10.1016/j.ejcb.2005.11.001. [DOI] [PubMed] [Google Scholar]
- Bhowmick NA, Neilson EG, Moses HL. Stromal fibroblasts in cancer initiation and progression. Nature. 2004;432(7015):332–7. doi: 10.1038/nature03096. [DOI] [PMC free article] [PubMed] [Google Scholar]
- Bissell MJ, Radisky D. Putting tumours in context. Nat Rev Cancer. 2001;1(1):46–54. doi: 10.1038/35094059. [DOI] [PMC free article] [PubMed] [Google Scholar]
- Bostwick DG, Amin MB, Dundore P, Marsh W, Schultz DS. Architectural patterns of high-grade prostatic intraepithelial neoplasia. Hum Pathol. 1993;24:298–310. doi: 10.1016/0046-8177(93)90041-e. [DOI] [PubMed] [Google Scholar]
- Bourhis X, Dong-Le, Berthois Y, Millot G, Degeorges A, Sylvi M, Martin PM, Calvo F. Effect of stromal and epithelial cells derived from normal and tumorous breast tissue on the proliferation of human breast cancer cell lines in co-culture. Int J Cancer. 1997;71(1):42–48. doi: 10.1002/(sici)1097-0215(19970328)71:1<42::aid-ijc9>3.0.co;2-3. [DOI] [PubMed] [Google Scholar]
- Brown DR. Dependence of neurones on astrocytes in a coculture system renders neurones sensitive to transforming growth factor beta1-induced glutamate toxicity. J Neurochem. 1999;72(3):943–53. doi: 10.1046/j.1471-4159.1999.0720943.x. [DOI] [PubMed] [Google Scholar]
- Butcher DT, Alliston T, Weaver VM. A tense situation: forcing tumour progression. Nat Rev Cancer. 2009;9(2):108–122. doi: 10.1038/nrc2544. [DOI] [PMC free article] [PubMed] [Google Scholar]
- Casciari JJ, Sotirchos SV, Sutherland RM. Mathematical modelling of microenvironment and growth in EMT6/Ro multicellular tumour spheroids. Cell Prolif. 1992a;25(1):1–22. doi: 10.1111/j.1365-2184.1992.tb01433.x. [DOI] [PubMed] [Google Scholar]
- Casciari JJ, Sotirchos SV, Sutherland RM. Variations in tumor Cell growth rates and metabolism with oxygen concentration, glucose concentration, and extraCellular pH. Journal of Cellular Physiology. 1992b;151:386–394. doi: 10.1002/jcp.1041510220. [DOI] [PubMed] [Google Scholar]
- Chen CS, Tan J, Tien J. Mechanotransduction at cell-matrix and cell-cell contacts. Annu Rev Biomed Eng. 2004;6:275–302. doi: 10.1146/annurev.bioeng.6.040803.140040. [DOI] [PubMed] [Google Scholar]
- Chen CY, Byrne HM, King JR. The influence of growth-induced stress from the surrounding medium on the development of multicell spheroids. J Math Biol. 2001;43:191–220. doi: 10.1007/s002850100091. [DOI] [PubMed] [Google Scholar]
- Chen ST, Pan TL, Juan HF, Chen TY, Lin YS, Huang CM. Breast tumor microenvironment: proteomics highlights the treatments targeting secretome. J Proteome Res. 2008;7:13791387. doi: 10.1021/pr700745n. [DOI] [PMC free article] [PubMed] [Google Scholar]
- Cheng G, Tse J, Jain RK, Munn LL. Micro-environmental mechanical stress controls tumor spheroid size and morphology by suppressing proliferation and inducing apoptosis in cancer cells. PLoS One. 2009;4(2) doi: 10.1371/journal.pone.0004632. [DOI] [PMC free article] [PubMed] [Google Scholar]
- Cheng JD, Weiner LM. Tumors and their microenvironments: tilling the soil Commentary re: A. M. Scott et al. A Phase I dose-escalation study of sibrotuzumab in patients with advanced or metastatic fibroblast activation protein-positive cancer. Clin Cancer Res. 2003;9(5):1590–1595. [PubMed] [Google Scholar]
- Chung SW, Miles FL, Sikes RA, Cooper CR, Farach-Carson MC, Ogunnaike BA. Quantitative modeling and analysis of the transforming growth factor beta signaling pathway. Biophys J. 2009;96(5):1733–50. doi: 10.1016/j.bpj.2008.11.050. [DOI] [PMC free article] [PubMed] [Google Scholar]
- Cotran RS, Kumar V, Robbins SL. Pathological basis of cancer. Philadelphia: WB Saunders Company; 1994. [Google Scholar]
- Dallon JC, Othmer HG. How cellular movement determines the collective force generated by the Dictyostelium discoideum slug. J Theor Biol. 2004;231:203–222. doi: 10.1016/j.jtbi.2004.06.015. [DOI] [PMC free article] [PubMed] [Google Scholar]
- Dallon John C, Othmer Hans G. A Discrete Cell Model with Adaptive Signaling for Aggregation of Dictyostelium discoideum. Philosophical Transactions: Biological Sciences. 1997;352:391–417. doi: 10.1098/rstb.1997.0029. [DOI] [PMC free article] [PubMed] [Google Scholar]
- Danielsen T, Rofstad EK. VEGF, bFGF and EGF in the angiogenesis of human melanoma xenografts. Int J Cancer. 1998;76(6):836–41. doi: 10.1002/(sici)1097-0215(19980610)76:6<836::aid-ijc12>3.0.co;2-0. [DOI] [PubMed] [Google Scholar]
- Derynck R, Zhang YE. Smad-dependent and Smad-independent pathways in TGF-β family signalling. Nature. 2003;425(6958):577–584. doi: 10.1038/nature02006. [DOI] [PubMed] [Google Scholar]
- Dhillon AS, Hagan S, Rath O, Kolch W. MAP kinase signalling pathways in cancer. Oncogene. 2007;26(22):3279–3290. doi: 10.1038/sj.onc.1210421. [DOI] [PubMed] [Google Scholar]
- DiMilla PA, Barbee K, Lauffenburger DA. Mathematical model for the effects of adhesion and mechanics on cell migration speed. Biophys J. 1991;60(1):15–37. doi: 10.1016/S0006-3495(91)82027-6. [DOI] [PMC free article] [PubMed] [Google Scholar]
- Folkman J. Therapeutic Implications. N Engl J Med. 1971;285:1182–1186. doi: 10.1056/NEJM197111182852108. [DOI] [PubMed] [Google Scholar]
- Folkman J, Greenspan HP. Influence of geometry on control of cell growth. Biochimica et Biophysica Acta. 1975;417(3–4):211. doi: 10.1016/0304-419x(75)90011-6. [DOI] [PubMed] [Google Scholar]
- Folkman J, Moscona A. Role of cell shape in growth control. Nature. 1978;273:345–349. doi: 10.1038/273345a0. [DOI] [PubMed] [Google Scholar]
- Franks SJ, Byrne HM, King JR, Underwood JCE, Lewis CE. Modelling the early growth of ductal carcinoma it situ of the breast. J Math Biol. 2003;47:424–452. doi: 10.1007/s00285-003-0214-x. [DOI] [PubMed] [Google Scholar]
- Franks SJ, Byrne HM, Underwood JCE, Lewis CE. Biological inferences from a mathematical model of comedo ductal carcinoma in situ of the breast. Journal of Theoretical Biology. 2005;232:523–543. doi: 10.1016/j.jtbi.2004.08.032. [DOI] [PubMed] [Google Scholar]
- Freyer JP, Sutherland RM. A reduction in the in situ rates of oxygen and glucose consumption of cells in EMT6/Ro spheroids during growth. J Cell Physiol. 1985;124(3):516–24. doi: 10.1002/jcp.1041240323. [DOI] [PubMed] [Google Scholar]
- Friedl P. To adhere or not to adhere? Nat Rev Molecular Cell Biology. 2010;11(1):3. doi: 10.1038/nrm2825. [DOI] [PubMed] [Google Scholar]
- Friedl P, Wolf K. Tumour-cell invasion and migration: diversity and escape mechanisms. Nat Rev Cancer. 2003;3(5):362–74. doi: 10.1038/nrc1075. [DOI] [PubMed] [Google Scholar]
- Frisch SM, Vuori K, Ruoslahti E, Chan-Hui PY. Control of adhesion-dependent cell survival by focal adhesion kinase. J Cell Biol. 1996;134:793. doi: 10.1083/jcb.134.3.793. [DOI] [PMC free article] [PubMed] [Google Scholar]
- Fung YC. Biomechanics: Mechanical Properties of Living Tissues. 2. Springer-Verlag; 1993. [Google Scholar]
- Gatenby RA, Gillies RJ. A microenvironmental model of carcinogenesis. Nat Rev Cancer. 2008;8(1):56–61. doi: 10.1038/nrc2255. [DOI] [PubMed] [Google Scholar]
- Gotte M, Yip GW. Heparanase, hyaluronan, and CD44 in cancers: a breast carcinoma perspective. Cancer Research. 2006;66:10233–7. doi: 10.1158/0008-5472.CAN-06-1464. [DOI] [PubMed] [Google Scholar]
- Gracheva ME, Othmer HG. A Continuum Model of Motility in Ameboid Cells. Bull Math Biol. 2004;66:167–194. doi: 10.1016/j.bulm.2003.08.007. [DOI] [PubMed] [Google Scholar]
- Green CE, Liu T, Montel V, Hsiao G, Lester RD, Subramaniam S, Gonias SL, Klemke RL. Chemoattractant signaling between tumor cells and macrophages regulates cancer cell migration, metastasis and neovascularization. Plos ONE. 2009;4 doi: 10.1371/journal.pone.0006713. [DOI] [PMC free article] [PubMed] [Google Scholar]
- Guo X, Wang XF. Signaling cross-talk between TGF-beta/BMP and other pathways. Cell Res. 2009;19(1):71–88. doi: 10.1038/cr.2008.302. [DOI] [PMC free article] [PubMed] [Google Scholar]
- Hanahan D, Weinberg RA. The hallmarks of cancer. Cell. 2000;100(1):57–70. doi: 10.1016/s0092-8674(00)81683-9. [DOI] [PubMed] [Google Scholar]
- Hebner C, Weaver VM, Debnath J. Modeling morphogenesis and oncogenesis in three-dimensional breast epithelial cultures. Ann Rev Pathology: Mechanisms of Disease. 2008;xx doi: 10.1146/annurev.pathmechdis.3.121806.151526. [DOI] [PubMed] [Google Scholar]
- Helfman DM, Levy ET, Berthier C, Shtutman M, Riveline D, Grosheva I, Elbaum A, Lachish-Zalaitand M, Bershadsky AD. Caldesmon inhibits nonmuscle cell contractility and interferes with the formation of focal adhesions. Mol Biol Cell. 1999;10:30973112. doi: 10.1091/mbc.10.10.3097. [DOI] [PMC free article] [PubMed] [Google Scholar]
- Helmke BP, Davies PF. The cytoskeleton under external fluid mechanical forces: hemodynamic forces acting on the endothelium. Ann Biomed Eng. 2002;30(3):284–96. doi: 10.1114/1.1467926. [DOI] [PubMed] [Google Scholar]
- Helmlinger G, Netti PA, Lichtenbeld HC, Melder RJ, Jain RK. Solid stress inhibits the growth of multispheroid tumors. Nature Biotechnology. 1997;15:778–783. doi: 10.1038/nbt0897-778. [DOI] [PubMed] [Google Scholar]
- Hendriks BS, Orr G, Wells A, Wiley HS, Lauffenburger DA. Parsing ERK activation reveals quantitatively equivalent contributions from epidermal growth factor receptor and HER2 in human mammary epithelial cells. J Biol Chem. 2005;280(7):6157–69. doi: 10.1074/jbc.M410491200. [DOI] [PubMed] [Google Scholar]
- Hinshelwood RA, Huschtscha LI, Melki J, Stirzaker C, Abdipranoto A, Vissel B, Ravasi T, Wells CA, Hume DA, Reddel RR, Clark SJ. Concordant epigenetic silencing of transforming growth factor-signaling pathway genes occurs early in breast carcinogenesis. Cancer research. 2007;67(24):11517. doi: 10.1158/0008-5472.CAN-07-1284. [DOI] [PubMed] [Google Scholar]
- Hudlicka O, Brown MD. Adaptation of skeletal muscle microvasculature to increased or decreased blood flow: role of shear stress, nitric oxide and vascular endothelial growth factor. Journal of Vascular Research. 2009;46:504–512. doi: 10.1159/000226127. [DOI] [PubMed] [Google Scholar]
- Hynes RO. Integrins Bidirectional, Allosteric Signaling Machines. Cell. 2002;110(6):673–687. doi: 10.1016/s0092-8674(02)00971-6. [DOI] [PubMed] [Google Scholar]
- Jones RG, Thompson CB. Tumor suppressors and cell metabolism: a recipe for cancer growth. Genes & development. 2009;23(5):537. doi: 10.1101/gad.1756509. [DOI] [PMC free article] [PubMed] [Google Scholar]
- Kim J, Dang CV. Cancer’s molecular sweet tooth and the Warburg effect. Cancer research. 2006;66(18):8927. doi: 10.1158/0008-5472.CAN-06-1501. [DOI] [PubMed] [Google Scholar]
- Kim Y, Friedman A. Interaction of Tumor with Its Micro-environment: A Mathematical Model. Bull Math Biol. 2010;72(5):1029–1068. doi: 10.1007/s11538–009–9481–z. [DOI] [PubMed] [Google Scholar]
- Kim Y, Stolarska MA, Othmer HG. A Hybrid Model for tumor spheroid growth in vitro I: Theoretical development and early results. Mathematical Models and Methods in Applied Sciences. 2007;17(Suppl):1773–1798. [Google Scholar]
- Kim Y, Wallace J, Li F, Ostrowski M, Friedman A. Transformed epithelial cells and fibroblasts/myofibroblasts interaction in breast tumor: a mathematical model and experiments. J Math Biol. 2010;61(3):1–21. doi: 10.1007/s00285-009-0307-2. [DOI] [PubMed] [Google Scholar]
- Koike C, McKee TD, Pluen A, Ramanujan S, Burton K, Munn LL, Boucher Y, Jain RK. Solid stress facilitates spheroid formation: potential involvement of hyaluronan. British Journal of Cancer. 2002;86:947–953. doi: 10.1038/sj.bjc.6600158. [DOI] [PMC free article] [PubMed] [Google Scholar]
- Koka S, Vance JB, Maze GI. Bone growth factors: potential for use as an osseointegration enhancement technique (OET) J West Soc Periodontol Periodontal Abstr. 1995;43(3):97–104. [PubMed] [Google Scholar]
- Kretzschmar M, Doody J, Timokhina I, Massague J. A mechanism of repression of TGFbeta/Smad signaling by oncogenic Ras. Genes Dev. 1999;13(7):804–16. doi: 10.1101/gad.13.7.804. [DOI] [PMC free article] [PubMed] [Google Scholar]
- Krouskop TA, Wheeler TM, Kallel F, Garra BS, Hall T. Elastic moduli of breast and prostate tissues under compression. Ultrason Imaging. 1998;20(4):260–74. doi: 10.1177/016173469802000403. [DOI] [PubMed] [Google Scholar]
- Kudlow JE, Cheung CY, Bjorge JD. Epidermal growth factor stimulates the synthesis of its own receptor in a human breast cancer cell line. J Biol Chem. 1986;261(9):4134–8. [PubMed] [Google Scholar]
- Kunz-Schughart LA, Wenninger S, Neumeier T, Seidl P, Knuechel R. Three-dimensional tissue structure affects sensitivity of fibroblasts to TGF-beta 1. Am J Physiol Cell Physiol. 2003;284(1):C209–19. doi: 10.1152/ajpcell.00557.2001. [DOI] [PubMed] [Google Scholar]
- Lämmermann T, Bader BL, Monkley SJ, Worbs T, Wedlich-Söldner R, Hirsch K, Keller M, Förster R, Critchley DR, Fässler R, et al. Rapid leukocyte migration by integrin-independent flowing and squeezing. Nature. 2008;453:51–55. doi: 10.1038/nature06887. [DOI] [PubMed] [Google Scholar]
- Little MP. Cancer models, genomic instability and somatic cellular Darwinian evolution. DNA. 2010;27:28. doi: 10.1186/1745-6150-5-19. [DOI] [PMC free article] [PubMed] [Google Scholar]
- Lotz MM, Burdsal CA, Erickson HP, McClay DR. Cell Adhesion to Fibronectin and Tenascin: Quantitative Measurements of Initial Binding and Subsequent Strengthening Response. J Cell Biology. 1989;109:1795–1805. doi: 10.1083/jcb.109.4.1795. [DOI] [PMC free article] [PubMed] [Google Scholar]
- Lowengrub JS, Frieboes HB, Jin F, Chuang YL, Li X, Macklin P, Wise SM, Cristini V. Nonlinear modelling of cancer: bridging the gap between cells and tumours. Nonlinearity. 2010;23:R1. doi: 10.1088/0951-7715/23/1/r01. [DOI] [PMC free article] [PubMed] [Google Scholar]
- Luo BH, Carman CV, Springer TA. Structural basis of integrin regulation and signaling. Annu Rev Immunol. 2007;25:619–47. doi: 10.1146/annurev.immunol.25.022106.141618. [DOI] [PMC free article] [PubMed] [Google Scholar]
- Ma XJ, Salunga R, Tuggle JT, Gaudet J, Enright E, McQuary P, Payette T, Pistone M, Stecker K, Zhang BM, Zhou YX, Varnholt H, Smith B, Gadd M, Chatfield E. Gene expression profiles of human breast cancer progression. Proc Natl Acad Sci U S A. 2003;100(10):5974–9. doi: 10.1073/pnas.0931261100. [DOI] [PMC free article] [PubMed] [Google Scholar]
- Macklin P, McDougall S, Anderson ARA, Chaplain MAJ, Cristini V, Lowengrub J. Multiscale modelling and nonlinear simulation of vascular tumour growth. J Math Biol. 2009;58(4):765–798. doi: 10.1007/s00285-008-0216-9. [DOI] [PMC free article] [PubMed] [Google Scholar]
- Mammoto A, Connor KM, Mammoto T, Yung CW, Huh D, Aderman CM, Mostoslavsky G, Smith LEH, Ingber DE. A mechanosensitive transcriptional mechanism that controls angiogenesis. Nature. 2009;457(7233):1103–1108. doi: 10.1038/nature07765. [DOI] [PMC free article] [PubMed] [Google Scholar]
- Man YG, Tai L, Barner R, Vang R, Saenger JS, Shekitka KM, Bratthauer GL, Wheeler DT, Liang CY, Vinh TN, et al. Cell clusters overlying focally disrupted mammary myoepithelial cell layers and adjacent cells within the same duct display different immunohistochemical and genetic features: implications for tumor progression and invasion. Breast Cancer Res. 2003;5(6):R231–R241. doi: 10.1186/bcr653. [DOI] [PMC free article] [PubMed] [Google Scholar]
- Mantzaris N, Webb S, Othmer HG. Mathematical modeling of tumor-induced angiogenesis. J Math Biol. 2004;49:111–187. doi: 10.1007/s00285-003-0262-2. [DOI] [PubMed] [Google Scholar]
- Massague J. TGF-beta SIGNAL TRANSDUCTION. Annual Review of Biochemistry. 1998;67(1):753. doi: 10.1146/annurev.biochem.67.1.753. [DOI] [PubMed] [Google Scholar]
- Massague J, Gomis RR. The logic of TGFβ signaling. FEBS Letters. 2006;580(12):2811–20. doi: 10.1016/j.febslet.2006.04.033. [DOI] [PubMed] [Google Scholar]
- Matrisian LM. Cancer biology: extracellular proteinases in malignancy. Curr Biol. 1999;9(20):R776–8. doi: 10.1016/S0960-9822(00)80011-1. [DOI] [PubMed] [Google Scholar]
- McCabe M, Laurent TC. Diffusion of oxygen, nitrogen and water in hyaluronate solutions. Biochimica et Biophysica Acta. 1975;399:131–138. doi: 10.1016/0304-4165(75)90219-6. [DOI] [PubMed] [Google Scholar]
- Mihailescu-Suliciu M, Suliciu I. Energy for hypoelastic constitutive equations. Arch Rat Mech Anal. 1979;71:327–344. [Google Scholar]
- Mitchison TJ, Cramer LP. Actin-based cell motility and cell locomotion. Cell. 1996;84:371–379. doi: 10.1016/s0092-8674(00)81281-7. [DOI] [PubMed] [Google Scholar]
- Mueller-Klieser W, Freyer JP, Sutherland RM. Influence of glucose and oxygen supply conditions on the oxygenation of multicellular spheroids. British Journal of Cancer. 1986;53:345–353. doi: 10.1038/bjc.1986.58. [DOI] [PMC free article] [PubMed] [Google Scholar]
- Mueller-Klieser Wolfgang F, Sutherland Robert M. Oxygen consumption and oxygen diffusion properties of multicellular spheroids from two different cell lines. Advances in Experimental Medicine and Biology. 1984;180:311–321. doi: 10.1007/978-1-4684-4895-5_30. [DOI] [PubMed] [Google Scholar]
- Normand Valéry, Lootens Didier L, Amici Eleonora, Plucknett Kevin P, Aymard Pierre. New Insights into Agarose Gel Mechanical Properties. Biomacromolecules. 2000;1:730–738. doi: 10.1021/bm005583j. [DOI] [PubMed] [Google Scholar]
- Olsen ET, Bernstein B. A class of hypo-elastic non-elastic materials and their thermodynamics. Archive for Rational Mechanics and Analysis. 1984;86:291–303. [Google Scholar]
- Painter KJ. Continuous Models for Cell Migration in Tissues and Applications to Cell Sorting via Differential Chemotaxis. Bulletin of Mathematical Biology. 2009;71(5):1117–1147. doi: 10.1007/s11538-009-9396-8. [DOI] [PubMed] [Google Scholar]
- Palsson E. A 3-D model used to explore how cell adhesion and stiffness affect cell sorting and movement in multicellular systems. J Theor Biol. 2008;254(1):1–13. doi: 10.1016/j.jtbi.2008.05.004. [DOI] [PubMed] [Google Scholar]
- Palsson Eirikur, Othmer Hans G. A Model for Individual and Collective Cell Movement in Dictyostelium discoideum. Proceedings of the National Academy of Science. 2000;97:11448–11453. doi: 10.1073/pnas.97.19.10448. [DOI] [PMC free article] [PubMed] [Google Scholar]
- Park JB, Kwak HJ, Lee SH. Role of hyaluronan in glioma invasion. Cell Adhesion and Migration. 2008;2:202–207. doi: 10.4161/cam.2.3.6320. [DOI] [PMC free article] [PubMed] [Google Scholar]
- Paszek MJ, Weaver VM. The tension mounts: mechanics meets morphogenesis and malignancy. J Mammary Gland Biol Neoplasia. 2004;9(4):325–42. doi: 10.1007/s10911-004-1404-x. Review. [DOI] [PubMed] [Google Scholar]
- Pauwels F. A new theory on the influence of mechanical stimuli on the differentiation of supporting tissue. The tenth contribution to the functional anatomy and causal morphology of the supporting structure. Zeitschrift für Anatomie und Entwicklungsgeschichte. 1960;121:478. Translated as ‘A new theory concerning the influence of mechanical stimuli on the differentiation of the supporting tissues’. In: Maquet, P., Furlong, R. (eds.) Biomechanics of the Locomotor Apparatus, Springer, Berlin, 1980, pp. 375–407. [PubMed] [Google Scholar]
- Pittet MJ, Mempel TR. Regulation of T-cell migration and effector functions: insights from in vivo imaging studies. Immunological reviews. 2008;221(1):107–129. doi: 10.1111/j.1600-065X.2008.00584.x. [DOI] [PubMed] [Google Scholar]
- Pollard TD, Blanchoin L, Mullins RD. Molecular mechanisms controlling actin filament dynamics in nonmuscle cells. Annu Rev Biophys Biomol Struct. 2000;29(1):545–576. doi: 10.1146/annurev.biophys.29.1.545. [DOI] [PubMed] [Google Scholar]
- Preziosi L, Tosin A. Multiphase modelling of tumour growth and extracellular matrix interaction: mathematical tools and applications. J Math Biol. 2009;58(4):625–656. doi: 10.1007/s00285-008-0218-7. [DOI] [PubMed] [Google Scholar]
- Rejniak KA, Dillon RH. A single cell-based model of the ductal tumour microarchitecture. Computational and Mathematical Methods in Medicine. 2007;8(1):51–69. [Google Scholar]
- Rejniak KA, McCawley CJ. Current trends in mathematical modeling of tumor microenvironment interaction: a survey of tools and applications. Experimental Biology and Medicine (Maywood) 2010;235:411–423. doi: 10.1258/ebm.2009.009230. [DOI] [PubMed] [Google Scholar]
- Rodriguez EK, Hoger A, McCulloch AD. Stress-dependent finite growth of soft tissues. Journal of Biomechanics. 1998;27:455–467. doi: 10.1016/0021-9290(94)90021-3. [DOI] [PubMed] [Google Scholar]
- Roose T, Netti PA, Munn LL, Boucher Y, Jain RK. Solid stress generated by spheroid growth estimated using a linear prorelasticity model. Microvascular Research. 2003;66:204–212. doi: 10.1016/s0026-2862(03)00057-8. [DOI] [PubMed] [Google Scholar]
- Roose T, Chapman SJ, Maini PK. Mathematical models of avascular tumor growth. SIAM Review. 2007;49(2):179–208. [Google Scholar]
- Sachdeva M, Zhu S, Wu F, Wu H, Walia V, Kumar S, Elble R, Watabe K, Mo YY. p53 represses c-Myc through induction of the tumor suppressor miR-145. PNAS. 2009;106(9):3207. doi: 10.1073/pnas.0808042106. [DOI] [PMC free article] [PubMed] [Google Scholar]
- Samoszuk M, Tan J, Chorn G. Clonogenic growth of human breast cancer cells co-cultured in direct contact with serum-activated fibroblasts. Breast Cancer Res. 2005;7:R274–R283. doi: 10.1186/bcr995. [DOI] [PMC free article] [PubMed] [Google Scholar]
- Schmierer B, Tournier AL, Bates PA, Hill CS. Mathematical modeling identifies Smad nucleocytoplasmic shuttling as a dynamic signal-interpreting system. Proc Natl Acad Sci U S A. 2008;105(18):6608–13. doi: 10.1073/pnas.0710134105. [DOI] [PMC free article] [PubMed] [Google Scholar]
- Sheetz MP, Felsenfeld D, Galbraith CG, Choquet D. Cell migration as a five-step cycle. Biochemical Society Symposia. 1999;65:233–43. [PubMed] [Google Scholar]
- Shin SY, Rath O, Choo SM, Fee F, McFerran B, Kolch W, Cho KH. Positive- and negative-feedback regulations coordinate the dynamic behavior of the Ras-Raf-MEK-ERK signal transduction pathway. Journal of Cell Science. 2009;122(3):425. doi: 10.1242/jcs.036319. [DOI] [PubMed] [Google Scholar]
- Shyu KG. Cellular and molecular effects of mechanical stretch on vascular cells and cardiac myocytes. Clinical Science (London) 2009;116:377–389. doi: 10.1042/CS20080163. [DOI] [PubMed] [Google Scholar]
- Silvera D, Formenti SC, Schneider RJ. Translational control in cancer. Nat Rev Cancer. 2010;10(4):254–266. doi: 10.1038/nrc2824. [DOI] [PubMed] [Google Scholar]
- Sinkus Ralph, Tanter Mickael, Xudeas Tanja, Catheline Stefan, Bercoff Jeremy, Fink Mathias. Viscoelastic shear properties of in vivo breast lesions measured by MR elastography. Magnetic Resonance Imaging. 2005;23:159–165. doi: 10.1016/j.mri.2004.11.060. [DOI] [PubMed] [Google Scholar]
- Skalak R. Growth as a finite displacement field. In: Carlson DE, Shield RT, editors. Proceedings of the IUTAM Symposium on Finite Elasticity. Martin Nijhoff Publishers; 1981. [Google Scholar]
- Small JV. Microfilament-based motility in non-muscle cells. Curr Opin Cell Biol. 1989;1:75–79. doi: 10.1016/s0955-0674(89)80040-7. [DOI] [PubMed] [Google Scholar]
- Small JV, Stradal T, Vignal E, Rottner K. The lamellipodium: where motility begins. Trends in Cell Biology. 2002;12:112–120. doi: 10.1016/s0962-8924(01)02237-1. [DOI] [PubMed] [Google Scholar]
- Smilenov LB, Mikhailov A, Pelham RJ, Marcantonio EE, Gundersen GG. Focal adhesion motility revealed in stationary fibroblasts. Science. 1999;286(5442):1172–1174. doi: 10.1126/science.286.5442.1172. [DOI] [PubMed] [Google Scholar]
- Soll DR. The use of computers in understanding how animal cells crawl. In: Jeon KW, Jarvik J, editors. International Review of Cytology. Vol. 163. Acdemic Press; 1995. pp. 43–104 . [PubMed] [Google Scholar]
- Stolarska MA, Kim Y, Othmer HG. Multi-scale models of cell and tissue dynamics. Phil Trans Roy Soc A. 2009;367(1902):3525. doi: 10.1098/rsta.2009.0095. [DOI] [PMC free article] [PubMed] [Google Scholar]
- Taber LA, Perucchio R. Modeling Heart Development. Jounal of Elasticity. 2000;61:165–197. [Google Scholar]
- Takai Y, Miyoshi J, Ikeda W, Ogita H. Nectins and nectin-like molecules: roles in contact inhibition of cell movement and proliferation. Nat Rev Molecular Cell Biology. 2008;9(8):603–615. doi: 10.1038/nrm2457. [DOI] [PubMed] [Google Scholar]
- Thorne RG, Hrabetov S, Nicholson C. Diffusion of epidermal growth factor in rat brain extracellular space measured by integrative optical imaging. J Neurophysiol. 2004;92(6):3471–81. doi: 10.1152/jn.00352.2004. [DOI] [PubMed] [Google Scholar]
- van den Hooff A. Stromal involvement in malignant growth. Adv Cancer Res. 1988;50:159–96. doi: 10.1016/s0065-230x(08)60437-6. [DOI] [PubMed] [Google Scholar]
- Wakefield LM, Smith DM, Masui T, Harris CC, Sporn MB. Distribution and modulation of the cellular receptor for transforming growth factor-beta. J Cell Biol. 1987;105(2):965–75. doi: 10.1083/jcb.105.2.965. [DOI] [PMC free article] [PubMed] [Google Scholar]
- Wang D, Cardelli L, Phillips A, Piterman N, Fisher J. Computational modeling of the EGFR network elucidates control mechanisms regulating signal dynamics. BMC Systems Biology. 2009a;3(118) doi: 10.1186/1752-0509-3-118. [DOI] [PMC free article] [PubMed] [Google Scholar]
- Wang N, Tytell JD, Ingber DE. Mechanotransduction at a distance: mechanically coupling the extracellular matrix with the nucleus. Nat Rev Mol Cell Biol. 2009b;10(1):75–82. doi: 10.1038/nrm2594. [DOI] [PubMed] [Google Scholar]
- Warburg O. On the origin of cancer cells. Science. 1956;123(3191):309–314. doi: 10.1126/science.123.3191.309. [DOI] [PubMed] [Google Scholar]
- Winchester DP, Jeske JM, Goldschmidt RA. The diagnosis and managment of ductal carcinoma in-situ of the breast. Cancer Journal for Clinicians. 2000;50:184–200. doi: 10.3322/canjclin.50.3.184. [DOI] [PubMed] [Google Scholar]
- Woodcock EA, Land SL, Andrews RK. A low affinity, low molecular weight endothelin-A receptor present in neonatal rat heart. Clin Exp Pharmacol Physiol. 1993;20(5):331–4. doi: 10.1111/j.1440-1681.1993.tb01697.x. [DOI] [PubMed] [Google Scholar]
- Yashiro M, Ikeda K, Tendo M, Ishikawa T, Hirakawa K. Effect of organ-specific fibroblasts on proliferation and differentiation of breast cancer cells. Breast Cancer Res Treat. 2005;90(3):307–13. doi: 10.1007/s10549-004-5364-z. [DOI] [PubMed] [Google Scholar]