The absolute values and reproducibility of CT perfusion parameters when imaging liver tumors can be influenced by motion and data acquisition time.
Abstract
Purpose:
To assess the reproducibility of computed tomographic (CT) perfusion measurements in liver tumors and normal liver and effects of motion and data acquisition time on parameters.
Materials and Methods:
Institutional review board approval and written informed consent were obtained for this prospective study. The study complied with HIPAA regulations. Two CT perfusion scans were obtained 2–7 days apart in seven patients with liver tumors with two scanning phases (phase 1: 30-second breath-hold cine; phase 2: six intermittent free-breathing cines) spanning 135 seconds. Blood flow (BF), blood volume (BV), mean transit time (MTT), and permeability–surface area product (PS) for tumors and normal liver were calculated from phase 1 with and without rigid registration and, for combined phases 1 and 2, with manually and rigid-registered phase 2 images, by using deconvolution modeling. Variability was assessed with within-patient coefficients of variation (CVs) and Bland-Altman analyses.
Results:
For tumors, BF, BV, MTT, and PS values and reproducibility varied by analytical method, the former by up to 11%, 23%, 21%, and 138%, respectively. Median PS values doubled with the addition of phase 2 data to phase 1 data. The best overall reproducibility was obtained with rigidly registered phase 1 and phase 2 images, with within-patient CVs for BF, BV, MTT, and PS of 11.2%, 14.4%, 5.5% and 12.1%, respectively. Normal liver evaluations were similar, except with marginally lower variability.
Conclusion:
Absolute values and reproducibility of CT perfusion parameters were markedly influenced by motion and data acquisition time. PS, in particular, probably requires data acquisition beyond a single breath hold, for which motion-correction techniques are likely necessary.
© RSNA, 2011
Supplemental material: http://radiology.rsna.org/lookup/suppl/doi:10.1148/radiol.11110331/-/DC1
Introduction
Computed tomographic (CT) perfusion imaging is a developing technique for quantitatively evaluating tissue blood perfusion (1,2). CT perfusion imaging is well suited to integration into standard CT evaluations of anatomy and morphology. Interest is increasing in the potential of CT perfusion imaging for use in oncologic imaging, in which the limitations of morphologic assessments of treatment response (eg, Response Evaluation Criteria in Solid Tumors and World Health Organization tumor size criteria) are increasingly being recognized. These limitations are particularly seen with currently available targeted antiangiogenic drugs, which are typically cytostatic rather than cytotoxic (3–5) but may have a marked antivascular effect. An important component in the development of CT perfusion imaging for use in making quantitative assessments and treatment decisions is an evaluation and understanding of the variability associated with its measurements.
The liver is an extremely common site for primary and metastatic malignant disease (6). Primary malignancy in the form of hepatocellular carcinoma is one of the most common malignancies worldwide and is increasingly prevalent. The use and development of targeted antivascular therapies is gaining attention for these tumors (7). The liver is, therefore, an important site in which to develop and evaluate appropriate techniques that have the potential to be used for diagnosis and for assessing therapies; however, imaging of the liver is particularly susceptible to motion. Relatively few clinical studies have assessed the reproducibility of CT perfusion imaging in human subjects (8,9) or, indeed, in anatomic locations that are susceptible to tissue motion, such as the liver (10,11). Studies such as the latter have mitigated the effects of motion by acquiring data during a single breath hold, which is necessarily limited in duration. More prolonged data acquisitions have been used in the setting of liver tumors in a few preclinical animal studies (12,13). To the best of our knowledge, the effects of data acquisition beyond a single breath hold in liver tumors on CT perfusion imaging reproducibility and parameters have not been explored in clinical settings with patients.
Although the main interest in liver-related perfusion studies is directed toward the evaluation of focal lesions (ie, tumors), a parallel evaluation of normal liver allows complementary assessment of the effect of data acquisition techniques and processing on CT perfusion parameters with mitigation of the confounding effects of tissue delineation and motion.
Our objectives were to assess the reproducibility of CT perfusion measurements in liver tumors and normal liver and the effects of motion and data acquisition time on parameters.
Materials and Methods
Patients and Target Lesions
Our prospective study was approved by the institutional review board, written informed consent was obtained from all patients, and the study complied with Health Insurance Portability and Accountability Act regulations. A.G.C. is employed by GE (Waukesha, Wis); however, the other authors had full control of inclusion of data and information.
Patients with solid liver lesions were eligible for participation. Further details of the patient inclusion and exclusion criteria are presented in Appendix E1 (online). In each patient, a single target lesion was identified at a review of previous imaging studies by a radiologist (C.S.N., with more than 10 years experience interpreting CT studies). Target lesions were required to be well demarcated contrast-enhancing solid masses that were larger than 2.5 cm in the longest diameter.
CT Perfusion Scanning Technique
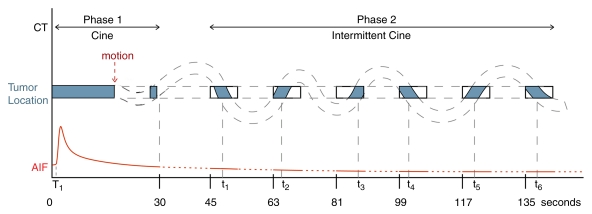
Patients underwent CT perfusion scanning during two visits that were 2–7 days apart. Images were obtained by using a 16-row multidetector CT scanner (LightSpeed; GE Healthcare). The studies were obtained into two phases: phase 1 (cine acquisition during a breath hold) and phase 2 (six further cine scans acquired during free breathing) (Fig 1). Cine scans were performed by using a single level of 2-cm thickness (0.5-cm contiguous section thickness for four sections, 4i mode) at the midpoint of the target lesion, and the images were reconstructed every half second. Further details of the CT perfusion scanning technique are presented in Appendix E1 (online).
Figure 1:
Schematic of CT perfusion protocol and imaging time points. Dashed lines = a patient’s breathing, blue areas = portions matched and/or registered in anatomic location, red line = arterial input function (AIF), rectangles = cine scanning during free breathing, T1 = start of aortic density rise (preenhancement time), t1–t6 = times associated with matching images in each cine data set.
For visit 2 repeat scans, we used reference images from the baseline (visit 1) scans to image the same location and used identical technical parameters for the pairs of scans.
CT Perfusion Analysis
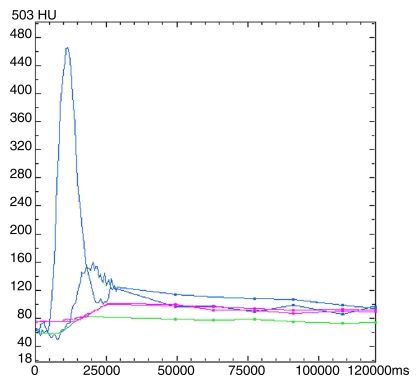
Liver tumors.—The images were analyzed by using commercially available CT perfusion software on a workstation (CT Perfusion 4, version 4.3.1, Advantage Windows 4.4; GE Healthcare) to generate mean blood flow (BF), mean blood volume (BV), mean transit time (MTT), and permeability–surface area product (PS). We used the liver protocol of the vendor software, which uses a dual vascular input algorithm. Regions of interest (ROIs) were placed in the aorta and in the portal vein on the source images to provide these vascular inputs (C.S.N.) (Fig 2a). Mean ROI sizes for aortic and portal vein inputs were 25 mm2 (range, 10–75 mm2) and 24 mm2 (range, 11–46 mm2), respectively.
Figure 2a:
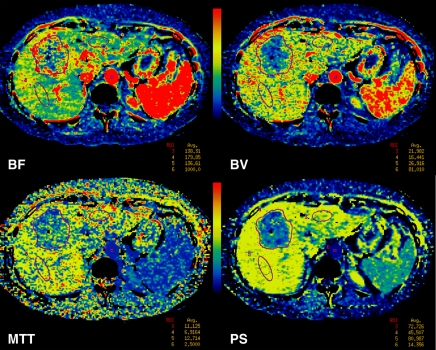
Images and data from a 55-year-old woman with metastatic neuroendocrine carcinoma of the liver. (a) Time-intensity curves for aortic (upper blue line), portal vein (lower blue line), liver tumor (green line), and normal liver (purple lines) profiles. ms = milliseconds. (b) BF, BV, MTT, and PS parametric maps for combined phases 1reg and 2reg. Purple lines = outlines of ROIs.
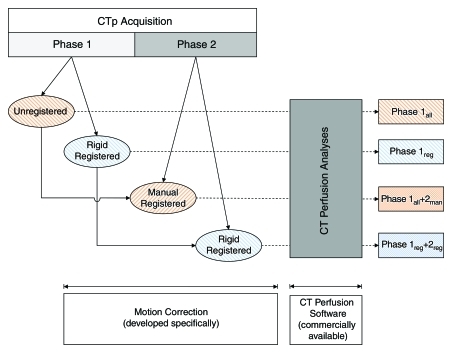
We initially analyzed the phase 1 data alone and then the combined phase 1 and phase 2 data. Phase 1 data alone were analyzed in two ways: phase 1all, in which all the cine data were used, and phase 1reg, in which rigidly registered images were used. For analysis of the combined phase 1 and 2 data, we selected images from phase 2 that anatomically matched images in the phase 1 data set. Matching of phase 2 images was undertaken by manual (phase 2man) or rigid (phase 2reg) registration. The best-matched set of six phase 2 images from each phase 2 group were added to the phase 1 data sets, and perfusion analysis was repeated for the resulting combined phase 1 and 2 data sets (combined phase 1all and 2man or combined phase 1reg and 2reg) (Fig 2b). The analyses performed are summarized in the flowchart in Figure 3. Details of the registration techniques used, which we developed based on previously described techniques, and the CT perfusion analyses undertaken are presented in Appendix E1 (online).
Figure 2b:
Images and data from a 55-year-old woman with metastatic neuroendocrine carcinoma of the liver. (a) Time-intensity curves for aortic (upper blue line), portal vein (lower blue line), liver tumor (green line), and normal liver (purple lines) profiles. ms = milliseconds. (b) BF, BV, MTT, and PS parametric maps for combined phases 1reg and 2reg. Purple lines = outlines of ROIs.
Figure 3:
Flowchart of analytical procedures. CTp = CT perfusion.
The median longitudinal diameter of the tumors was 4.7 cm (range, 2.8–5.6 cm), and the median size of the tumor ROIs was 1468 mm2 (range, 575–2520 mm2).
Normal liver.—Parallel analyses were undertaken for normal liver parenchyma on associated CT sections. Circular or oval ROIs were delineated in normal liver regions; these ROIs were as large as possible and placed to avoid vessels and artifacts. We delineated two normal liver ROIs on each of the four sections where possible (C.S.N.). The sizes and locations of ROIs used for visits 1 and 2 were compared on a section-by-section basis to ensure similarity. The mean size of the normal liver ROIs was 450 mm2 (range, 153–595 mm2). CT perfusion analyses were undertaken by using the four methods described above (Fig 3) with the same set of ROIs across the methods. CT perfusion values for each method were taken as the average of the four levels and the ROIs on each section.
Statistical Analysis
A variance component analysis was performed to estimate the between- and within-patient variations for each parameter in each method of analysis. CT perfusion parameters were assumed to follow log-normal distributions, as is typical of biologic systems, and were transformed to the logarithmic scale prior to analyses. After each variance component analysis, the within-patient coefficient of variation (CV) was calculated by using the following equation: within-patient CV =  , where SDw is the within-patient standard deviation (SD), which is the square root of the within-patient variation. The 95% confidence interval of the within-patient CV was calculated on the basis of the confidence interval of the within-patient SD.
The following Bland-Altman summary statistics of the differences between visits 1 and 2 were also calculated: means and SDs of the differences, limits of agreement, within-patient SD, repeatability coefficient, and the significant change for an individual patient (14). Statistical analysis was performed with SAS version 9 software (SAS Institute, Cary, NC); and data plotting, with S-Plus 7 software (Insightful, Seattle, Wash).
Results
Patients and Target Lesions
In total, 10 patients were enrolled. Two patients were excluded because of technical errors in CT perfusion acquisition at one of their visits. One patient was excluded because a portal vein input could not be delineated. Two of the seven remaining patients had two lesions each, resulting in nine lesions with evaluable imaging data.
The mean age of the seven patients was 58.1 years (range, 47.9–72.2 years). There were four men (mean age, 54.8 years; range, 47.9–64.1 years) and three women (mean age, 62.5 years; range, 55.0–72.2 years). The primary tumors were melanoma (n = 2), neuroendocrine (n = 2), lung (n = 2), and sarcoma (n = 1). The median interval between visits 1 and 2 was 2 days (range, 2–7 days).
Liver Tumors
For liver tumors, the reproducibility (variability) in CT perfusion parameters was affected by the methods of analyses. When using the phase 1 breath-hold CT perfusion data as originally acquired (ie, phase 1all), the mean within-patient CVs for BF, BV, MTT, and PS were 19.1%, 24.2%, 5.0%, and 45.5%, respectively. This represents the variability that one might expect when using single breath-hold data and the currently available vendor software. The addition of phase 2 data (whether rigidly or manually registered) to phase 1 data reduced within-patient CVs for PS to the range of 11.2%–12.1%, compared with 31.3%–45.5% for data sets based on phase 1 data only (Table 1). Comparing the two methods for incorporating the phase 2 data, the use of rigidly registered phase 2 data noticeably improved the reproducibility of BF and BV (within-patient CVs of 11.2% and 14.4%, respectively) compared with manually registered data (within-patient CVs of 22.2% and 27.0%, respectively). Reproducibilities for MTT and PS for these two phase 2 registration methods were comparable, with within-patient CVs for MTT of 5.2%–5.5% and for PS of 11.2%–12.1%. Overall, the best reproducibility (lowest variability) was obtained with rigidly registered phases 1 and 2 data (ie, combined phases 1reg and 2reg), with within-patient CVs for BF, BV, MTT, and PS of 11.2%, 14.4%, 5.5%, and 12.1%, respectively.
Table 1.
Perfusion Parameters and Variability for the Nine Liver Tumors Analyzed

Data in parentheses are interquartile ranges.
Data in parentheses are 95% confidence intervals.
The absolute values of CT perfusion parameters were also affected by the method of analysis. The addition of phase 2 data to phase 1 data more than doubled the absolute PS values, with medians of 63.3–65.1 mL/min/100 g compared with 27.3–29.1 mL/min/100 g for analyses based on phase 1 data only (a difference of up to 138%) (Table 1). Absolute BF, BV, and MTT values also varied with the method of analysis: BF varied from 177.8 to 197.9 mL/min/100 g (a difference of up to 11%), BV varied from 16.8 to 20.7 mL/100 g (a difference of up to 23%), and MTT varied from 7.6 to 9.2 seconds (a difference of up to 21%). Absolute values for BF and BV for methods which included both phase 1 and phase 2 data were generally marginally smaller than those for methods using phase 1 data only (Table 1).
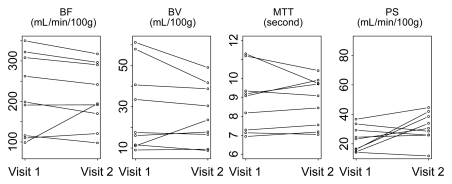
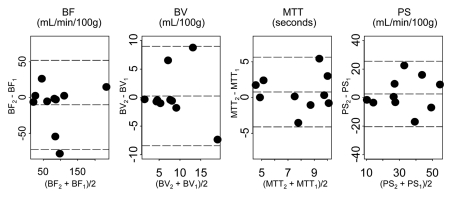
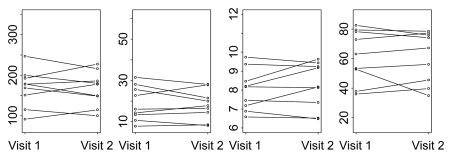
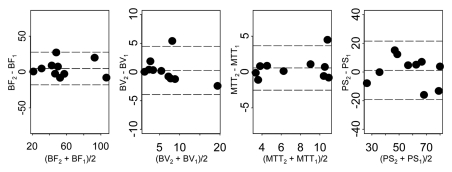
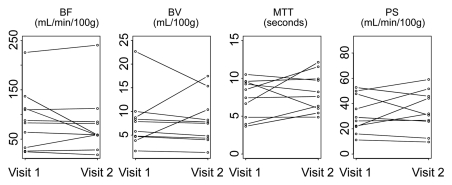
Parameters for liver tumors for visit 1 versus visit 2 for two representative analytical methods (phase 1all; combined phases 1reg and 2reg) are presented in Figure 4. The 95% limits of agreement, repeatability coefficients, and significant change for an individual patient by parameter for these two methods are presented in Table 2. Bland-Altman plots for these corresponding methods are presented in Figure 5, which shows no systematic trend in the data and smaller parameter differences for registered data.
Figure 4a:
Graphs show changes in CT perfusion parameters in liver tumors between visits 1 and 2 for (a) phase 1all and (b) combined phase 1reg and 2reg analytical methods.
Table 2.
95% Limits of Agreement and Repeatability of Tumor BF, BV, MTT, and PS Measurements for Nine Liver Tumors for Two Analytical Methods

Mean difference plus or minus 1.96 times the SD of difference for upper or lower limit, respectively.
1.96 ×  × within-patient SD.
Significant change at the 5% level for an individual patient = the upper limit of the 95% confidence interval of the within-patient CV (ie, if the second measurement differs from the first measurement beyond this limit, then the difference between the two measurements is significant) (15).
Figure 5a:
Bland-Altman plots of CT perfusion data from analyses of (a) phase 1all and (b) combined phase 1reg and 2reg. Dashed lines = mean ± (1.96 · SD); subscripts 1 and 2 = visits 1 and 2, respectively.
Figure 4b:
Graphs show changes in CT perfusion parameters in liver tumors between visits 1 and 2 for (a) phase 1all and (b) combined phase 1reg and 2reg analytical methods.
Figure 5b:
Bland-Altman plots of CT perfusion data from analyses of (a) phase 1all and (b) combined phase 1reg and 2reg. Dashed lines = mean ± (1.96 · SD); subscripts 1 and 2 = visits 1 and 2, respectively.
Normal Liver
For normal liver, the reproducibility (variability) in CT perfusion parameters was affected by the method of analysis. When using phase 1all, the mean within-patient CVs for BF, BV, MTT, and PS were 13.0%, 15.0%, 6.9%, and 39.3%, respectively. The addition of phase 2 data (whether rigidly or manually registered) to phase 1 data reduced within-patient CVs for PS to the range of 7.3%–8.1%, compared with 39.3%–40.0% for data sets based on phase 1 data only (Table 3). Comparing the analytical methods, including the two methods for incorporating the phase 2 data, the lowest overall variability was with combined phases 1reg and 2reg, with within-patient CVs for BF, BV, MTT, and PS of 7.5%, 10.1%, 4.2%, and 7.3%, respectively. These within-patient CVs were slightly smaller than corresponding values for tumors using the analytical method with the lowest overall variability, which was also combined phases 1reg and 2reg.
Table 3.
Perfusion Parameters and Variability for Normal Liver

Data in parentheses are interquartile ranges.
Data in parentheses are 95% confidence interval.
The absolute values of CT perfusion parameters were also affected by the methods of analysis. The addition of phase 2 data to phase 1 data resulted in an approximate doubling of PSs (Table 3). BF, BV, and MTT also varied by the method of analysis, with differences in absolute values for BF of up to 6%, for BV of up to 19%, and for MTT of up to 10%. Of note, differences across the analytical methods were smaller for normal liver than for tumors (Tables 1, 3).
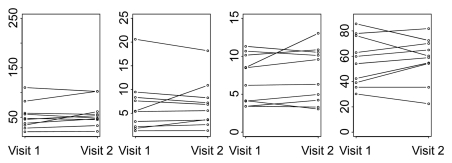
Parameters for normal liver for visit 1 versus visit 2 for two representative analytical methods (ie, phase 1all; combined phases 1reg and 2reg) are presented in Figure 6, which shows more horizontal pairing of data for the latter and the global differences in absolute values between these analytical methods.
Figure 6a:
Graphs show changes in CT perfusion parameters in normal liver between visits 1 and 2 for (a) phase 1all and (b) combined phase 1reg and 2reg analytical methods.
Figure 6b:
Graphs show changes in CT perfusion parameters in normal liver between visits 1 and 2 for (a) phase 1all and (b) combined phase 1reg and 2reg analytical methods.
Discussion
We have sought in this work to assess the effects of motion correction and data collection beyond a single breath hold on CT perfusion reproducibility in the liver. As part of our evaluation, we included analyses of single breath-hold data with and without more-prolonged data and with and without formal motion correction to allow comparison not only across our own findings, but also with other data that might be acquired and analyzed in these ways. Specifically, phase 1all data can be compared with acquired data limited to a single breath hold; phase 1all and 2man data can be compared with acquired data beyond a single breath hold, but in which motion-correction capabilities are not available (which is the situation in the currently available perfusion software used in our study); phase 1reg data can be compared with acquired data limited to a single breath hold, but in which motion correction is available; and phase 1reg and 2reg data can be compared with motion-corrected data beyond a single breath hold.
For the analysis of tumors, the addition of phase 2 data to phase 1 data, whether manually or rigidly registered, markedly reduced within-patient CVs for PS to 11.2%–12.1% (from 31.3%–45.5%). This suggests that estimates of PS are more reliable with inclusion of data beyond a single breath hold. This is in concordance with theoretical considerations and previous work (16,17). Of the two registration methods used for phase 2 data, rigid registration yielded lower within-patient CVs by approximately one-half compared with manual registration for BF and BV (with relatively little effect on the reproducibility for MTT and PS). The superior anatomic alignment achieved with rigid rather than manual registration is probably a major contributing factor. In comparison, the addition of phase 2 data, whether manually or rigidly registered, yielded essentially the same effects on PS values, suggesting that, for this parameter, the need for prolonged data acquisition outweighs the need for good registration.
Our results for tumor evaluation indicated that the analytical method used affected not just the reproducibility of the parameter measurements but also the absolute values of the parameters. For example, combined phase 1reg and 2reg data yielded PSs that were more than double those of phase 1 only methods (63.3–65.1 mL/min/100 g vs 27.3–29.1 mL/min/100 g); while BF and BV values were marginally lower. Absolute BF and BV values were higher for combined phase 1all and 2man data than for combined phase 1reg and 2reg data, probably because delineation of lesion boundaries is compromised in the presence of motion. This is exacerbated by the relative hyperperfusion in the periphery of tumors that is typically seen.
For the corresponding analysis of normal liver, the addition of phase 2 data to phase 1 data reduced within-patient CVs for PS to 7.3%–8.1% (from 39.3%–40.0%), as it did for tumors. Of the two registration methods used for phase 2 data, rigid registration yielded marginally lower overall within-patient CVs than did manual registration, but this was not as pronounced as for the corresponding analyses for tumors. This suggests that anatomic alignment is not as critical in analysis of normal liver as for tumors; this might be expected since, unlike for tumors, ROI delineation of normal liver, which would be expected to be a relatively homogenous tissue, does not depend on precisely delineating lesion borders and margins. As with the analysis of tumors, absolute CT perfusion values were affected by the method of analysis. Specifically, the addition of phase 2 data to phase 1 data approximately doubled PSs (78.9–84.8 mL/min/100 g vs 34.8–41.6 mL/min/100 g), as it did for tumors.
Comparison of the overall variability for well-registered data sets (ie, combined phases 1reg and 2reg) between tumors and normal liver indicate that within-patient CVs for all CT perfusion parameters were marginally lower for normal liver than for tumors, with within-patient CVs for BF, BV, MTT, and PS of 7.5%, 10.1%, 4.2%, and 7.3%, respectively, for normal liver, compared with 11.2%, 14.4%, 5.5%, and 12.1%, respectively, for tumor. This suggests, as above, that delineation of ROIs for normal liver has less of an effect on CT perfusion values than for tumors, as might be expected because of the relative homogeneity of normal liver parenchyma. Evaluation of normal liver effectively removed the confounding effect of motion and tissue ROI delineation; the variability observed for normal liver may represent the lower limits of what might be achievable with our current techniques.
Comparatively few studies, preclinical or clinical, have assessed the reproducibility of CT perfusion measurements (13,14,18,19). Our results with our well-registered data are comparable with those of these studies, most of which have been undertaken for lesions in relatively motion-free locations. It should be noted that a high degree of correlation between repeat measures, as reported in one study (10), does not necessarily indicate good reproducibility of the parameter measurements (20).
We acknowledge several limitations of our study. First, the number of patients in our study was relatively small. We also made a general assumption that the patients’ tumors did not change substantially within the scan-rescan interval of 2–7 days. It could be considered that it may have been better to obtain immediately sequential scans during the same visit, as undertaken in the animal studies cited (13,18,21), but there is then the possible confounding factor of residual intravenous contrast medium. Also, the imposition of a delay of a few days between scan and rescan visits more closely simulates the clinical pre- and posttreatment scenario in which these evaluations would typically be used.
Additionally, our study had some subjective aspects, such as the drawing of tumor ROIs. Some investigators have used identical ROIs between paired data sets (19), but this requires anatomically identical data sets, which may not be reliably achieved on different visits, particularly in lesions susceptible to motion. Our determination of cutoff points for motion in phase 1 images and manual selection of visually matching phase 2 images also carried a degree of subjectivity. We made an assumption that our data were log-normally distributed but, given the small number of patients, were not able to fully substantiate this; however, similar previous analyses, as above, have made the same general assumption.
Finally, newer CT scanners have the capability for more extensive cine coverage than our 20 mm, which would allow integration of a larger volume of tissue, which may help reduce overall noise associated with section-to-section variations in parameter estimates. They may also help to increase the number of evaluable patients by enabling better recovery of images affected by motion and better opportunity to capture adequate portal vein input functions. We assessed scans from a single CT vendor. Other vendors have implemented image registration algorithms in their CT perfusion products that use different perfusion models, and thus, our results might not be the same on other machines.
In summary, the absolute values and reproducibility of CT perfusion parameters when imaging liver tumors can be influenced by motion and data acquisition time; motion has a smaller effect on normal liver assessments than those of liver tumor. Reliable estimation of PS, in particular, probably requires data acquisition beyond a single breath hold. The least variability, or best reproducibility, in estimations of BF, BV, MTT, and PS is obtained by applying formal motion correction (ie, image registration) to combined phase 1 and phase 2 image data. The absolute perfusion values obtained from CT perfusion data need to be interpreted with careful attention to acquisition protocols and analytical methods. Further work is required to develop optimum acquisition and motion-correction protocols for CT perfusion imaging.
Advance in Knowledge.
The scan-rescan variability using image registration techniques in the estimation of the CT perfusion parameters blood flow, blood volume, mean transit time, and permeability–surface area product in liver tumors obtained in conjunction with registration techniques are approximately 11.2%, 14.4%, 5.5%, and 12.1%, respectively.
Implications for Patient Care.
The results of CT perfusion analysis may be influenced by details of the acquisition technique.
Appropriate image-registration techniques will aid in evaluation of lesions with motion.
Disclosures of Potential Conflicts of Interest: C.S.N. Financial activities related to the present article: institution has a grant from GE Medical Systems. Financial activities not related to the present article: is a consultant for GE Medical Systems, is on the speakers bureau of Novartis. Other relationships: none to disclose. A.G.C. Financial activities related to the present article: none to disclose. Financial activities not related to the present article: is an employee of GE Healthcare. Other relationships: none to disclose. W.W. No potential conflicts of interest to disclose. D.H.H. No potential conflicts of interest to disclose. E.F.A. No potential conflicts of interest to disclose. R.K. No potential conflicts of interest to disclose. C.C. Financial activities related to the present article: institution has a grant from GE Medical Systems. Financial activities not related to the present article: is a consultant for Novartis Pharmaceuticals. Other relationships: none to disclose.
Received February 13, 2011; revision requested March 29; revision received April 25; accepted May 4; final version accepted May 17.
Funding: This research was supported by the National Institutes of Health (grant CA016672).
Supported by GE Healthcare.
Abbreviations:
- BF
- blood flow
- BV
- blood volume
- CV
- coefficient of variation
- MTT
- mean transit time
- PS
- permeability–surface area product
- ROI
- region of interest
- SD
- standard deviation
References
- 1.Miles KA, Griffiths MR. Perfusion CT: a worthwhile enhancement? Br J Radiol 2003;76(904):220–231 [DOI] [PubMed] [Google Scholar]
- 2.Kambadakone AR, Sahani DV. Body perfusion CT: technique, clinical applications, and advances. Radiol Clin North Am 2009;47(1):161–178 [DOI] [PubMed] [Google Scholar]
- 3.Choi H, Charnsangavej C, de Castro Faria S, et al. CT evaluation of the response of gastrointestinal stromal tumors after imatinib mesylate treatment: a quantitative analysis correlated with FDG PET findings. AJR Am J Roentgenol 2004;183(6):1619–1628 [DOI] [PubMed] [Google Scholar]
- 4.Stevenson JP, Rosen M, Sun W, et al. Phase I trial of the antivascular agent combretastatin A4 phosphate on a 5-day schedule to patients with cancer: magnetic resonance imaging evidence for altered tumor blood flow. J Clin Oncol 2003;21(23):4428–4438 [DOI] [PubMed] [Google Scholar]
- 5.Morgan B, Thomas AL, Drevs J, et al. Dynamic contrast-enhanced magnetic resonance imaging as a biomarker for the pharmacological response of PTK787/ZK 222584, an inhibitor of the vascular endothelial growth factor receptor tyrosine kinases, in patients with advanced colorectal cancer and liver metastases: results from two phase I studies. J Clin Oncol 2003;21(21):3955–3964 [DOI] [PubMed] [Google Scholar]
- 6.Husband JE, Reznek RH. Husband & Reznek’s imaging in oncology. 3rd ed. London, England: Informa Healthcare, 2010 [Google Scholar]
- 7.El-Serag HB, Mason AC. Rising incidence of hepatocellular carcinoma in the United States. N Engl J Med 1999;340(10):745–750 [DOI] [PubMed] [Google Scholar]
- 8.Gillard JH, Antoun NM, Burnet NG, Pickard JD. Reproducibility of quantitative CT perfusion imaging. Br J Radiol 2001;74(882):552–555 [DOI] [PubMed] [Google Scholar]
- 9.Gandhi D, Chepeha DB, Miller T, et al. Correlation between initial and early follow-up CT perfusion parameters with endoscopic tumor response in patients with advanced squamous cell carcinomas of the oropharynx treated with organ-preservation therapy. AJNR Am J Neuroradiol 2006;27(1):101–106 [PMC free article] [PubMed] [Google Scholar]
- 10.Sahani DV, Holalkere N-S, Mueller PR, Zhu AX. Advanced hepatocellular carcinoma: CT perfusion of liver and tumor tissue—initial experience. Radiology 2007;243(3):736–743 [DOI] [PubMed] [Google Scholar]
- 11.Ng QS, Goh V, Fichte H, et al. Lung cancer perfusion at multi-detector row CT: reproducibility of whole tumor quantitative measurements. Radiology 2006;239(2):547–553 [DOI] [PubMed] [Google Scholar]
- 12.Stewart EE, Chen X, Hadway J, Lee TY. Correlation between hepatic tumor blood flow and glucose utilization in a rabbit liver tumor model. Radiology 2006;239(3):740–750 [DOI] [PubMed] [Google Scholar]
- 13.Stewart EE, Chen X, Hadway J, Lee TY. Hepatic perfusion in a tumor model using DCE-CT: an accuracy and precision study. Phys Med Biol 2008;53(16):4249–4267 [DOI] [PubMed] [Google Scholar]
- 14.Galbraith SM, Lodge MA, Taylor NJ, et al. Reproducibility of dynamic contrast-enhanced MRI in human muscle and tumours: comparison of quantitative and semi-quantitative analysis. NMR Biomed 2002;15(2):132–142 [DOI] [PubMed] [Google Scholar]
- 15.Bland JM, Altman DG. Measurement error proportional to the mean. BMJ 1996;313(7049):106. [DOI] [PMC free article] [PubMed] [Google Scholar]
- 16.Lee TY. Functional CT: physiological models. Trends Biotechnol 2002;20(8 Suppl):S3–S1012570152 [Google Scholar]
- 17.Goh V, Halligan S, Hugill JA, Gartner L, Bartram CI. Quantitative colorectal cancer perfusion measurement using dynamic contrast-enhanced multidetector-row computed tomography: effect of acquisition time and implications for protocols. J Comput Assist Tomogr 2005;29(1):59–63 [DOI] [PubMed] [Google Scholar]
- 18.Purdie TG, Henderson E, Lee TY. Functional CT imaging of angiogenesis in rabbit VX2 soft-tissue tumour. Phys Med Biol 2001;46(12):3161–3175 [DOI] [PubMed] [Google Scholar]
- 19.Goh V, Halligan S, Hugill JA, Bartram CI. Quantitative assessment of tissue perfusion using MDCT: comparison of colorectal cancer and skeletal muscle measurement reproducibility. AJR Am J Roentgenol 2006;187(1):164–169 [DOI] [PubMed] [Google Scholar]
- 20.Bland JM, Altman DG. Statistical methods for assessing agreement between two methods of clinical measurement. Lancet 1986;1(8476):307–310 [PubMed] [Google Scholar]
- 21.Cenic A, Nabavi DG, Craen RA, Gelb AW, Lee TYA. A CT method to measure hemodynamics in brain tumors: validation and application of cerebral blood flow maps. AJNR Am J Neuroradiol 2000;21(3):462–470 [PMC free article] [PubMed] [Google Scholar]


