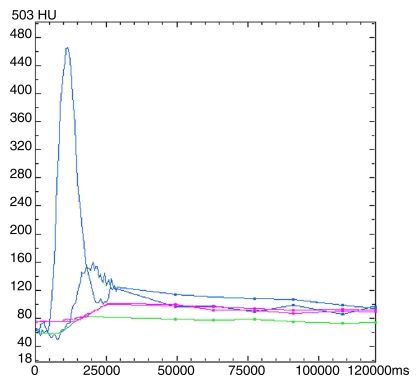
Figure 2a:
Images and data from a 55-year-old woman with metastatic neuroendocrine carcinoma of the liver. (a) Time-intensity curves for aortic (upper blue line), portal vein (lower blue line), liver tumor (green line), and normal liver (purple lines) profiles. ms = milliseconds. (b) BF, BV, MTT, and PS parametric maps for combined phases 1reg and 2reg. Purple lines = outlines of ROIs.

