

Our new quantitative analysis method of MR renography, which includes our multicompartmental tracer kinetic renal model, may help to diagnose noninvasively acute rejection or acute tubular necrosis after kidney transplantation.
Abstract
Purpose:
To assess prospectively the ability of quantitative low-dose three-dimensional magnetic resonance (MR) renography to help identify the cause of acute graft dysfunction.
Materials and Methods:
This HIPAA-compliant study was approved by the institutional review board, and written informed consent was obtained. Between December 2001 and May 2009, sixty patients with transplanted kidneys (41 men and 19 women; mean age, 49 years; age range, 22–71 years) were included. Thirty-one patients had normal function and 29 had acute dysfunction due to acute rejection (n = 12), acute tubular necrosis (ATN) (n = 8), chronic rejection (n = 6), or drug toxicity (n = 3). MR renography was performed at 1.5 T with three-dimensional gradient-echo imaging. With use of a multicompartment renal model, the glomerular filtration rate (GFR) and the mean transit time (MTT) of the tracer for the vascular compartment (MTTA), the tubular compartment (MTTT), and the collecting system compartment (MTTC) were calculated. Also derived was MTT for the whole kidney (MTTK = MTTA + MTTT + MTTC) and fractional MTT of each compartment (MTTA/K = MTTA/MTTK, MTTT/K = MTTT/MTTK, MTTC/K = MTTC/MTTK). These parameters were compared in patients in the different study groups. Statistical analysis was performed by using analysis of covariance.
Results:
There were significant differences in GFR and MTTK between the acute dysfunction group (36.4 mL/min ± 20.8 [standard deviation] and 177.1 seconds ± 46.8, respectively) and the normal function group (65.9 mL/min ± 27.6 and 140.5 seconds ± 51.8, respectively) (P < .001 and P = .004). The MTTA/K was significantly higher in the acute rejection group (mean, 12.7% ± 2.9) than in the normal function group (mean, 8.3% ± 2.2; P < .001) or in the ATN group (mean, 7.1% ± 1.4; P < .001). The MTTT/K was significantly higher in the ATN group (mean, 83.2% ± 9.2) than in the normal function group (mean, 72.4% ± 10.2; P = .031) or in the acute rejection group (mean, 69.2% ± 6.1; P = .003).
Conclusion:
Low-dose MR renography analyzed by using a multicompartmental tracer kinetic renal model may help to differentiate noninvasively between acute rejection and ATN after kidney transplantation.
© RSNA, 2011
Introduction
Renal transplantation is the treatment of choice in patients with chronic renal failure, sparing them from life-long dialysis and improving their quality of life. After transplantation, about 30%–40% of patients have at least one episode of acute graft dysfunction, and half of those experience repeated episodes (1). Major causes of acute graft dysfunction are either anatomic or intrinsic parenchymal causes (2). Anatomic conditions (arterial stenosis, ureteral obstruction, etc) can usually be diagnosed accurately with ultrasonography (US), computed tomography (CT), angiography, or magnetic resonance (MR) imaging. On the other hand, intrinsic conditions leading to renal parenchymal injury, such as acute rejection, acute tubular necrosis (ATN), and drug toxicity, are more difficult to diagnose because the clinical symptoms, laboratory data, and image findings of these diseases often overlap despite differences at histopathologic examination, such as arteritis and glomerulitis in acute rejection and tubulitis and tubular necrosis in ATN (3), and therapeutic strategies are radically different depending on the diagnosis. Early characterization of the underlying cause of graft dysfunction is important, because delayed treatment can lead to irreversible loss of nephrons and hasten graft loss over time (4–6). Percutaneous renal transplant biopsy is currently the established method of differentiating between causes of acute graft dysfunction (7). Unfortunately, biopsies are invasive and painful and can result in complications such as bleeding, infection, and, rarely, graft loss. Additionally, in some patients different etiologies may coexist and have been inconsistently represented at biopsy, depending on the location of the sampling (8,9).
MR imaging is a powerful tool for examining the kidney. MR imaging provides an accurate assessment of the anatomic causes of transplant dysfunction, such as renal artery stenosis or ureteral obstruction (10). The value of qualitative MR renography in the diagnosis of diseased renal transplants has been demonstrated in various published studies (11–15). On the other hand, comparison of the mean transit time (MTT) for the cortex and medulla at nuclear medicine imaging by using technetium 99m (99mTc) pentetic acid demonstrated to be useful in differentiating acute rejection and ATN in transplanted kidney (16–19). Recently, quantitative dynamic contrast material–enhanced T1-weighted MR imaging of the kidneys, or MR renography, has emerged as a promising radiologic measure of renal function (20–23). When applied to renal transplants, quantitative criteria for the diagnosis of acute graft dysfunction with MR renography or nuclear medicine have not been adequately studied.
Multicompartmental kinetic modeling is highly relevant for analyzing dynamic contrast-enhanced MR results (21). Our group has proposed techniques for measuring renal function on the basis of a multicompartmental model that reflects the transit of the gadolinium-based tracer through the intrarenal compartments of the kidney such as the arteries and glomerulus, loops of Henle, and collecting ducts. We have demonstrated that low doses of gadolinium-based contrast agent (<5 mL) are sufficient to visualize tracer transit through the kidneys and to quantify physiologic parameters such as glomerular filtration rate (GFR) and the MTT of the tracer for the vascular compartment (MTTA), the tubular compartment (MTTT), and the collecting system compartment (MTTC) at MR imaging (21,24–26). We also developed algorithms using a temporal Markov model and graph cuts to semiautomatically segment all data sets into cortex, medulla, and the collecting system following coregistration with mutual information maximization (27).
In this article, we describe a method for evaluating renal transplant function using a parametric representation of renal enhancement curve data derived from our multicompartmental model. The purpose of this study was to assess prospectively the ability of quantitative low-dose three-dimensional (3D) MR renography to help identify the cause of acute graft dysfunction.
Materials and Methods
Study Patients
This Health Insurance Portability and Accountability Act-compliant study was approved by the institutional review board, and written informed consent was obtained from all patients. Between December 2001 and May 2009, all patients who received transplants were invited to undergo low-dose 3D MR renography at transplant outpatient clinics for their routine clinical visit. After December 2006, all subjects with GFR of less than 30 mL/min based on modification of diet in renal disease, or MDRD, equation were excluded from participation because of the risk of nephrogenic systemic fibrosis. Patient selection, inclusion and exclusion criteria, and number of excluded patients are shown in Figure 1. The study included 60 patients (41 men, 19 women; mean age, 49 years; age range, 22–71 years) who underwent MR renography within 12 months after the transplantation. Patient demographics are summarized in the Table.
Figure 1:

Flow diagram of patient selection and exclusion criteria for the study. U.S.F.D.A. = U.S. Food and Drug Administration.
Patient Demographic Data
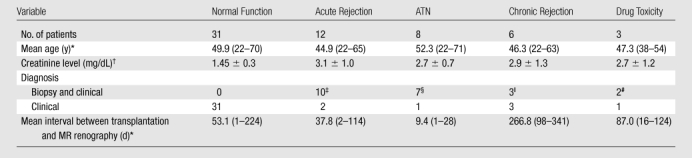
Numbers in parentheses are ranges.
Data are means ± standard deviation.
Biopsy diagnosis of acute rejection in seven and acute rejection plus ATN in three patients.
Biopsy diagnosis of ATN in six and acute rejection plus ATN in one patient.
Biopsy diagnosis of chronic rejection in two patients, and one patient had diagnosis of both acute and chronic rejection.
Both diagnosed at biopsy.
All patients received standard induction therapy. Thirty-one patients had clinically normal functioning transplants, as determined with clinical data and consensus assessment of two transplant surgeons and one nephrologist. Twenty-nine patients had acute dysfunction, as diagnosed according to biopsy and clinical information (n = 22) or clinical information without biopsy (n = 7). Clinical information included laboratory data, imaging findings, and clinical course more than 1 month after treatment and was assessed by an experienced team of two transplant surgeons and one nephrologist. The biopsy data did often contain findings that included more than one diagnosis. The final diagnosis was determined primarily by using biopsy data, but clinical information about the patient was also used. The distribution of diagnoses is shown in the Table. The mean interval between transplantation and MR renography was 67.3 days (range, 1–341 days). The mean interval between MR renography and biopsy was 3.5 days (range, 0–21 days).
MR Imaging Technique
According to an institutional review board-approved protocol, all MR examinations were performed at 1.5 T (Avanto or Symphony; Siemens Medical Solutions, Erlangen, Germany) by using a body phased-array coil. Three-dimensional spoiled gradient-echo (fast low-angle shot) oblique coronal images that included the distal aorta and iliac arteries and the entire allograft were acquired by using the following parameters: repetition time (msec)/echo time (msec), 2.84/1.05; flip angle, 12°; matrix, 161 × 256; field of view, 425 × 425 mm; voxel size, 1.7 × 1.7 × 2.5 mm3; section thickness, 2.5 mm; acquisition time, 3 seconds each. Before contrast agent administration, five 3D data sets were acquired during one 15-second breath hold to establish a reliable precontrast signal intensity baseline for measurement of tracer concentration. A bolus injection of 4 mL gadoteridol (ProHance; Bracco, Milano, Italy) was intravenously administered, followed by a 20-mL saline flush at 2 mL/sec. Eight seconds after the start of gadoteridol injection, 10 3D acquisitions every 3 seconds were repeated continuously for 30 seconds, followed by additional 3D images acquired during separate 3-second breath holds for approximately 10 minutes thereafter. In addition to MR renography, all subjects underwent routine T1-weighted gradient-echo and T2-weighted half-Fourier single-shot fast spin-echo imaging and conventional 3D contrast-enhanced MR angiography, venography, and urography for routine anatomic assessment.
Data Analysis
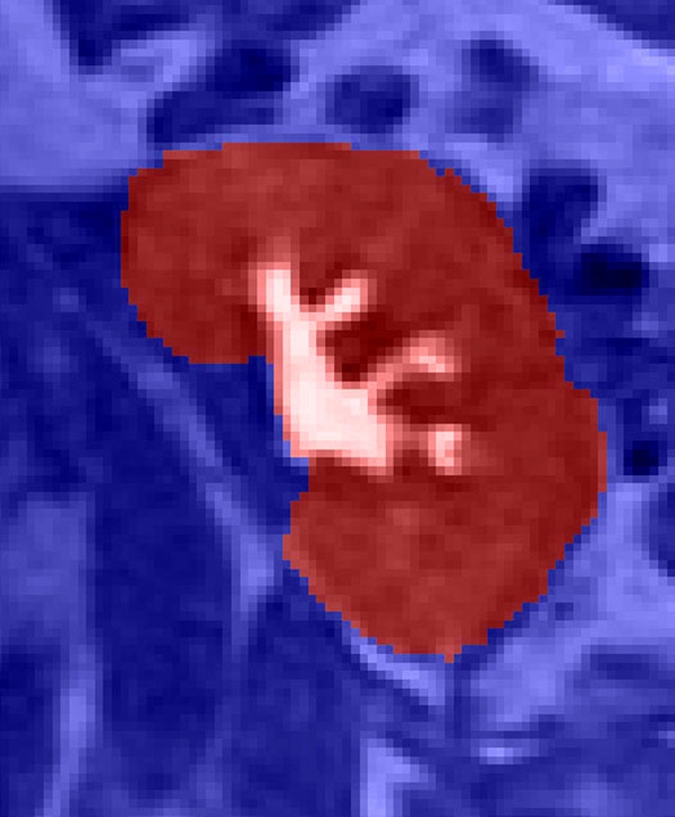
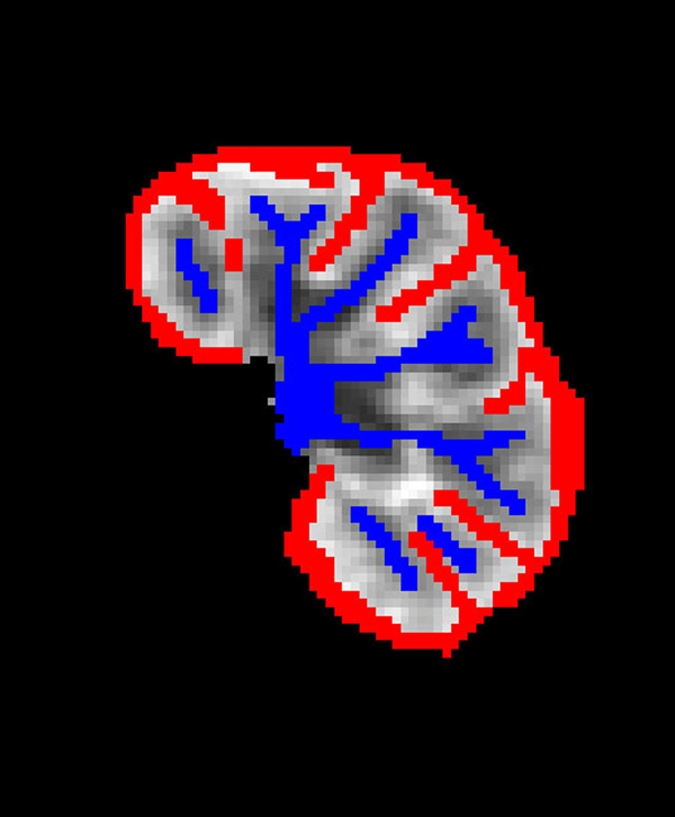
Semiautomated image registration and segmentation of the 3D MR renography data sets were performed to produce iliac artery, renal cortical, and renal medullary signal intensity versus time curves (27) (Fig 2) and measures of the whole kidney, cortical, and medullary renal volumes. The signal intensity versus time curves were converted to concentration versus time curves (28).
Figure 2a:
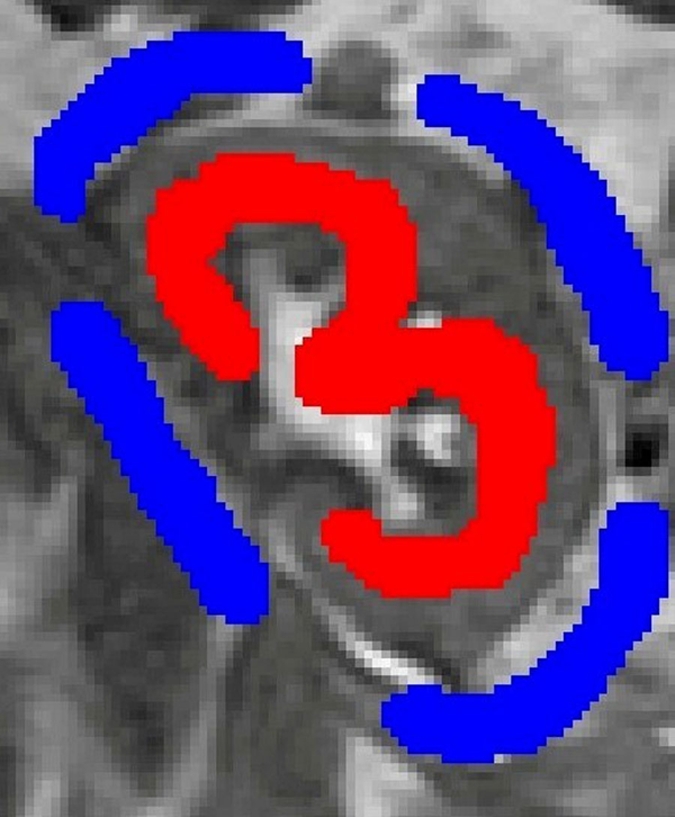
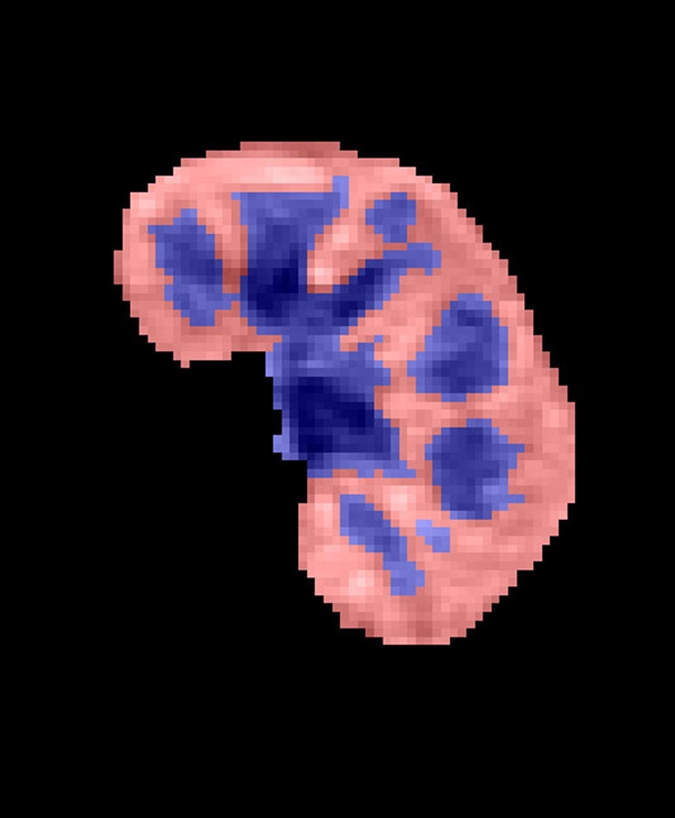
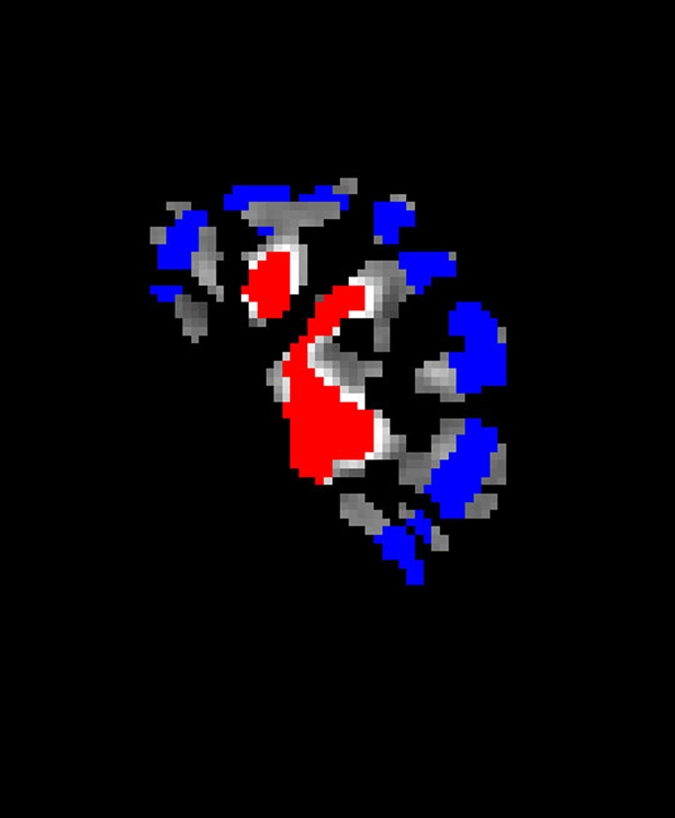
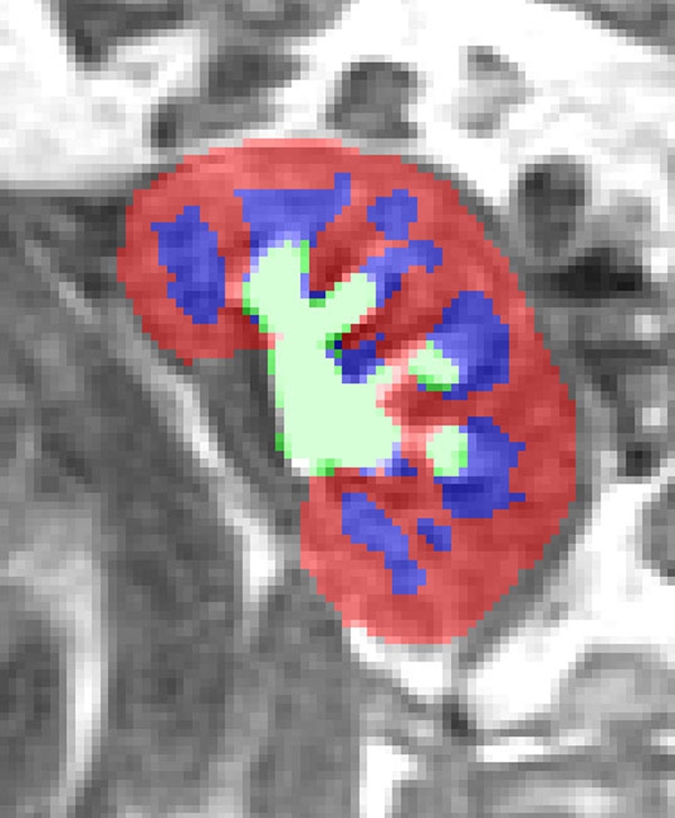
Semiautomated segmentation process using coregistered 3D MR data sets. The method is based on (a) user-defined seeds to initially separate the kidney (red) from the background (blue) with the (b) segmented data. In the second step, after the background has been removed and by using (c) images in the cortical enhancement phase, user-defined seeds are placed to separate the renal cortex (red) from the medulla and the collecting system (blue). (d) Resulting segmented data. In the final step, by using only the medulla and collecting system data from the (e) excretory phase, user-defined seeds are placed to identify the collecting system (red) and medulla (blue). (f) Final segmentation shows the cortex (red), medulla (blue), and the collecting system (green).
Figure 2b:
Semiautomated segmentation process using coregistered 3D MR data sets. The method is based on (a) user-defined seeds to initially separate the kidney (red) from the background (blue) with the (b) segmented data. In the second step, after the background has been removed and by using (c) images in the cortical enhancement phase, user-defined seeds are placed to separate the renal cortex (red) from the medulla and the collecting system (blue). (d) Resulting segmented data. In the final step, by using only the medulla and collecting system data from the (e) excretory phase, user-defined seeds are placed to identify the collecting system (red) and medulla (blue). (f) Final segmentation shows the cortex (red), medulla (blue), and the collecting system (green).
Figure 2c:
Semiautomated segmentation process using coregistered 3D MR data sets. The method is based on (a) user-defined seeds to initially separate the kidney (red) from the background (blue) with the (b) segmented data. In the second step, after the background has been removed and by using (c) images in the cortical enhancement phase, user-defined seeds are placed to separate the renal cortex (red) from the medulla and the collecting system (blue). (d) Resulting segmented data. In the final step, by using only the medulla and collecting system data from the (e) excretory phase, user-defined seeds are placed to identify the collecting system (red) and medulla (blue). (f) Final segmentation shows the cortex (red), medulla (blue), and the collecting system (green).
Figure 2d:
Semiautomated segmentation process using coregistered 3D MR data sets. The method is based on (a) user-defined seeds to initially separate the kidney (red) from the background (blue) with the (b) segmented data. In the second step, after the background has been removed and by using (c) images in the cortical enhancement phase, user-defined seeds are placed to separate the renal cortex (red) from the medulla and the collecting system (blue). (d) Resulting segmented data. In the final step, by using only the medulla and collecting system data from the (e) excretory phase, user-defined seeds are placed to identify the collecting system (red) and medulla (blue). (f) Final segmentation shows the cortex (red), medulla (blue), and the collecting system (green).
Figure 2e:
Semiautomated segmentation process using coregistered 3D MR data sets. The method is based on (a) user-defined seeds to initially separate the kidney (red) from the background (blue) with the (b) segmented data. In the second step, after the background has been removed and by using (c) images in the cortical enhancement phase, user-defined seeds are placed to separate the renal cortex (red) from the medulla and the collecting system (blue). (d) Resulting segmented data. In the final step, by using only the medulla and collecting system data from the (e) excretory phase, user-defined seeds are placed to identify the collecting system (red) and medulla (blue). (f) Final segmentation shows the cortex (red), medulla (blue), and the collecting system (green).
Figure 2f:
Semiautomated segmentation process using coregistered 3D MR data sets. The method is based on (a) user-defined seeds to initially separate the kidney (red) from the background (blue) with the (b) segmented data. In the second step, after the background has been removed and by using (c) images in the cortical enhancement phase, user-defined seeds are placed to separate the renal cortex (red) from the medulla and the collecting system (blue). (d) Resulting segmented data. In the final step, by using only the medulla and collecting system data from the (e) excretory phase, user-defined seeds are placed to identify the collecting system (red) and medulla (blue). (f) Final segmentation shows the cortex (red), medulla (blue), and the collecting system (green).
For estimating renal functional parameters, we used a modified version of a previous three-compartment model (25). This modified model includes three serially-connected compartments: vascular, tubular, and collecting ducts. Renal cortex is assumed to contain a fraction of vascular and tubular compartment, whereas medulla contains the remainder of vascular and tubular compartment and all of collecting ducts. The rationale for this modification lies in the fact that the flow of the filtered tracer in tubules is relatively fast (due to large amount of water) and thus enters collecting ducts at an early time, an assumption that has been used in other published models (29). The modified model involves multiple parameters, including renal plasma flow (RPF), GFR, cortical vascular volume fraction, MTTA, MTTT, and MTTC. In fitting data, the model parameters were adjusted by using Levenberg-Marquardt algorithm (Matlab; MathWorks, Natick, Mass) to minimize the residual difference between the model-constructed and the measured cortical and medullary tissue concentration curves (24–26).
From the fitted model parameters, we also derived MTT for the whole kidney (MTTK = MTTA + MTTT + MTTC) and fractional MTT of each compartment (MTTA/K = MTTA/MTTK, MTTT/K = MTTT/MTTK and MTTC/K = MTTC/MTTK). The fractional MTT of the two zones of the kidney, the outer zone (assumed cortical nephrons) and the middle zone (assumed medullary nephrons), has been shown to be promising in diagnosing renal transplants at dynamic scintigraphy (16).
Statistical Analysis
Analysis of covariance was used to compare subject groups in terms of GFR and MTT measures adjusted for the potential confounding effects of age and sex. A separate analysis of covariance was conducted for each parameter. In each case, pairwise comparisons among subject groups were conducted only if the initial composite F test for overall group differences was significant (P < .05). When conducted, the pairwise comparisons were subjected to a Tukey multiple comparison correction. A binary logistic regression was used to assess the diagnostic utility of MTT measures for helping predict ATN versus normal function, after adjusting for patient age and sex. Separate binary logistic regression models, adjusting for patient age and sex, were fit to predict acute rejection versus normal and dysfunction versus normal. Receiver operating characteristic (ROC) analyses were used to characterize the diagnostic performance of the MTT measures. P values reported for group comparisons are Tukey corrected. All reported P values are two sided and considered to indicate a statistically significant difference when P < .05. SAS version 9.0 (SAS Institute, Cary, NC) was used for all computations.
Results
As expected, the GFR of the transplanted kidney was significantly lower in the acute dysfunction group (mean, 36.4 mL/min ± 20.8 [standard deviation]) than in the normal function group (mean, 65.9 mL/min ± 27.6) (P < .001) (Fig 3a), although there was a good deal of overlap between the groups. MTTK was significantly higher in the acute dysfunction group (mean, 177.1 seconds ± 46.8) than in the normal function group (mean, 140.5 seconds ± 51.8) (P = .004) (Fig 3b), with considerable overlap between the groups, suggesting the delayed transit of contrast material through the kidney in dysfunctional grafts. However, there was no significant difference in the MTTK across the different etiologies of dysfunction.
Figure 3a:

(a) Scatterplot shows the mean GFR to be significantly lower in acute dysfunction group than in normal function group (P < .001). (b) Scatterplot shows the mean MTTK to be significantly higher in acute dysfunction group than in normal function group (P = .004). (c) Scatterplot shows the mean MTTA/K to be significantly higher in acute rejection group than in normal function group (P < .001) or the ATN group (P < .001). (d) Scatterplot shows the mean MTTT/K to be significantly higher in ATN than in normal function group (P = .031) or acute rejection group (P = .003).
Figure 3b:

(a) Scatterplot shows the mean GFR to be significantly lower in acute dysfunction group than in normal function group (P < .001). (b) Scatterplot shows the mean MTTK to be significantly higher in acute dysfunction group than in normal function group (P = .004). (c) Scatterplot shows the mean MTTA/K to be significantly higher in acute rejection group than in normal function group (P < .001) or the ATN group (P < .001). (d) Scatterplot shows the mean MTTT/K to be significantly higher in ATN than in normal function group (P = .031) or acute rejection group (P = .003).
As for fractional MTT, MTTA/K was significantly higher in the acute rejection group (mean, 12.7% ± 2.9; range, 9.2%–18.6%) than in the normal function group (mean, 8.3% ± 2.2; range, 4.9%–12.7%) (P < .001) or in the ATN group (mean, 7.1% ± 1.4; range, 5.3%–8.8%) (P < .001) (Fig 3c). MTTT/K was significantly higher in the ATN group (mean, 83.2% ± 9.2; range, 66.7%–92.9%) than in the normal function group (mean, 72.4% ± 10.2; range, 58.2%–92.1%) (P = .031). MTTT/K was also significantly higher in the ATN group than in the acute rejection group (mean, 69.2% ± 6.1%; range, 60.7%–80.6%) (P = .003) (Fig 3d). MTTC/K was significantly lower in the ATN group (mean, 9.7% ± 8.4; range, 1.8%–18.7%) than in the normal function group (mean, 19.3% ± 10.0; range, 2.2%–35.0%) (P = .036).
Figure 3c:

(a) Scatterplot shows the mean GFR to be significantly lower in acute dysfunction group than in normal function group (P < .001). (b) Scatterplot shows the mean MTTK to be significantly higher in acute dysfunction group than in normal function group (P = .004). (c) Scatterplot shows the mean MTTA/K to be significantly higher in acute rejection group than in normal function group (P < .001) or the ATN group (P < .001). (d) Scatterplot shows the mean MTTT/K to be significantly higher in ATN than in normal function group (P = .031) or acute rejection group (P = .003).
Figure 3d:

(a) Scatterplot shows the mean GFR to be significantly lower in acute dysfunction group than in normal function group (P < .001). (b) Scatterplot shows the mean MTTK to be significantly higher in acute dysfunction group than in normal function group (P = .004). (c) Scatterplot shows the mean MTTA/K to be significantly higher in acute rejection group than in normal function group (P < .001) or the ATN group (P < .001). (d) Scatterplot shows the mean MTTT/K to be significantly higher in ATN than in normal function group (P = .031) or acute rejection group (P = .003).
Despite some overlap in cases, these differences signify the delayed vascular transit in acute rejection compared with the delayed tubular transit in ATN. Logistic regression results showed that MTTA/K was the best significant predictor of acute rejection. ROC curves with MTTA/K as predictor of acute rejection are shown in Figure 4a. The area under the ROC curve was 0.82. MTTT/K was the best significant predictor of ATN, with the area under the ROC curve of 0.81 (Fig 4b). For comparison, a scatter plot of MTTA/K and MTTT/K for acute rejection and ATN is shown in Figure 5. We observed that an MTTA/K threshold of 9.0% (Fig 5) completely separated acute rejection from ATN. None of the parameters could help distinguish chronic rejection from the other groups and drug toxicity from the other groups.
Figure 4a:

(a) ROC curve with MTTA/K as predictor of acute rejection. The area under the curve was 0.82. (b) ROC curve with MTTT/K as predictor of ATN. The area under the ROC curve was 0.81.
Figure 4b:

(a) ROC curve with MTTA/K as predictor of acute rejection. The area under the curve was 0.82. (b) ROC curve with MTTT/K as predictor of ATN. The area under the ROC curve was 0.81.
Figure 5:

Scatterplot of MTTA/K and MTTT/K distribution in acute rejection and ATN. Acute rejection tends to position higher MTTA/K and lower MTTT/K. ATN tends to position lower MTTA/K and higher MTTT/K. In our subjects, MTTA/K of 9.0% (dotted line) allows 100% reliable distinction between acute rejection and ATN.
Discussion
There have been several prior reports about the use of MR renography to diagnose the cause of acute dysfunction after kidney transplantation (11–15). Almost all of these reports have evaluated qualitatively the shape of the renal enhancement curve to diagnose acute dysfunction, noting delayed and diminished medullary enhancement in ATN and finding that both cortical and medullary enhancement curves had decreased in acute rejection. Authors of some reports distinguished dysfunctional kidney from normal-functioning kidney after transplantation using some parameters, but they cannot determine the cause of dysfunction. This report presents a new quantitative analysis method for analyzing MR renography data from renal transplants using our multicompartmental tracer kinetic renal model, which shows promising results for differentiating ATN from acute rejection with an MTTA/K threshold of 9.0%.
Our quantitative findings are in agreement with the qualitative observations reported in the literature (25,27). We observed that MTTK is prolonged in acute dysfunction, which is consistent with previous publications (16–19). However, we found no significant differences in MTTK across different etiologies of dysfunction. These results indicate that MTTK, like GFR, may be useful for assessing renal function, but is not specific enough for diagnosing dysfunction etiology because both parameters mainly depend on the severity of each disease.
The degree to which the vascular, tubular, and collecting ducts are selectively affected in different diseases can be reflected in the three fractional MTTs (MTTA/K, MTTT/K, and MTTC/K) we examined. To our knowledge, there have been no reports comparing these MTT ratios to diagnose acute renal transplant dysfunction. Arteritis and glomerulitis are defining features for acute rejection diagnosis in the transplanted kidney (3), and both worsen nephron function and prolong vascular transit time (30,31). In our study, we found MTTA/K to be significantly longer in the acute rejection group than in the normal function group or in the ATN group. These results are consistent with pathology data.
On the other hand, ATN after kidney transplantation is caused by renal ischemia and is characterized primarily by tubular damage such as tubulitis or tubular necrosis. Tubular damage worsens tubular function and prolongs tubular transit time (32). In ATN, nephron function tends to be maintained better than tubular function (33,34). In our study, MTTT/K was significantly more prolonged in the ATN group than in the normal function group and the acute rejection group. These results are also consistent with those expected on the basis of pathologic findings.
We found that a high MTTA/K tends to be more sensitive and specific for acute rejection, with the area under the ROC curve of 0.82. In contrast, a high MTTT/K tends to be more sensitive and specific for ATN, with the area under the ROC curve of 0.81. However, we found no parameters that could help predict diagnoses of chronic rejection and drug toxicity, although our results are limited by small sample size.
Our study had a number of limitations. There were only a small number of subjects in each pathology group. Despite the small sample sizes, we found some differences in the means of the fractional MTT patterns between normal function, acute rejection, and ATN that were significant; however, there was also substantial overlap in the groups with those of the normal population. Biopsy was not performed in all patients; seven patients received diagnosis on the basis of clinical information without biopsy. However, clinical diagnosis was determined by consensus assessment of two transplant surgeons and one nephrologist. On the basis of the responsiveness to subsequent therapeutic interventions, we consider these clinical diagnoses to be reliable. Another limitation was that there were some overlap cases in comparison among acute rejection and ATN. Both acute rejection and ATN can cause vascular and tubular injury that may be difficult to resolve with our contrast-enhanced MR renography approach. This kind of pathologic overlap may also explain our inability to find significant differences in our parameters for diagnosis of chronic rejection and drug toxicity. However, a threshold of MTTA/K of 9.0% could be used to distinguish acute rejection from ATN in our small series. In addition, we did not compare the use of these measures with the more qualitative assessment of MR renography or other conventional imaging modalities currently in use and, therefore, cannot comment on the incremental benefit of the technique we describe.
Recently, diffusion-weighted and blood oxygen level–dependent MR imaging has emerged as a promising radiologic measure of renal function (15,35–37). Given that these other imaging methods show different tissue properties, it is worth exploring whether a combination of imaging modalities may provide complementary information and enhance accuracy of diagnosis. One challenge for diagnostic tests in determining causes of acute graft dysfunction is that different causes of dysfunction, such as acute rejection and ATN, can coexist in the same kidney. One potential advantage of 3D whole kidney MR renography is the ability to diagnose regional disease and avoid the sampling errors inherent with renal biopsy. Further large-scale studies are necessary to explore this possibility. There is a minor risk of nephrogenic systemic fibrosis associated with contrast agent administration. In our study none of the patients experienced nephrogenic systemic fibrosis. Our protocol utilizes low-dose (4 mL) gadoteridol administration to minimize further the risks. The relative risks of low-dose gadolinium-based MR renography compared with renal biopsy for differentiating ATN from acute rejection need further consideration.
In conclusion, our new quantitative analysis method of MR renography, which includes our multicompartmental tracer kinetic renal model, may help to diagnose noninvasively acute rejection or ATN after kidney transplantation. A high MTTA/K suggests acute rejection over ATN. A high MTTT/K suggests ATN over acute rejection or any other diagnosis. Our MR renography method, which adds no more than 10 minutes of scanning time and about 4 mL of gadolinium-based contrast material, can be performed in conjunction with routine anatomic imaging of transplants to exclude anatomic causes of dysfunction. Additionally, when there are questions about the accuracy of serum creatinine levels in estimating renal function, this MR method also provides an independent estimate of GFR and MTTK. Our noninvasive technique for differentiating the causes of graft dysfunction holds the possibility of decreasing the need for percutaneous biopsy in some cases.
Advances in Knowledge.
The vascular fractional component of mean transit time (MTT), MTTA/K (MTTA = vascular MTT, MTTK = whole kidney MTT), was significantly higher in the acute rejection group (mean, 12.7% ± 2.9) than in the normal function group (mean, 8.3% ± 2.2; P < .001) or the acute tubular necrosis (ATN) group (mean, 7.1% ± 1.4; P < .001).
The tubular fractional component of MTT, MTTT/K (MTTT = tubular MTT), was significantly higher in the ATN group (mean, 83.2% ± 9.2) than in the normal function group (mean, 72.4% ± 10.2; P = .031) or the acute rejection group (mean, 69.2% ± 6.1; P = .003).
Implication for Patient Care.
Low-dose MR renography analyzed by using a multicompartmental tracer kinetic renal model may help to differentiate noninvasively between acute rejection and ATN after kidney transplantation.
Disclosures of Potential Conflicts of Interest: A.Y. No potential conflicts of interest to disclose. J.L.Z. No potential conflicts of interest to disclose. H.R. No potential conflicts of interest to disclose. H.C. Financial activities related to the present article: none to disclose. Financial activities not related to the present article: author and the institution received research grants from RSNA. Other relationships: author and the institution received money from Siemens Healthcare for visiting fellowship (February to July 2010). P.H.V. Financial activities related to the present article: none to disclose. Financial activities not related to the present article: author received Fulbright grant and grant from Médaille d’Or des Hôpitaux de Rouen. Other relationships: none to disclose. J.S.B. No potential conflicts of interest to disclose. T.D. No potential conflicts of interest to disclose. D.G.J. No potential conflicts of interest to disclose. J.A.B. No potential conflicts of interest to disclose. L.B. No potential conflicts of interest to disclose. D.R.S. No potential conflicts of interest to disclose. V.S.L. No potential conflicts of interest to disclose.
Received August 18, 2010; revision requested September 22; revision received March 29, 2011; accepted April 21; final version accepted May 17.
Funding: This study was supported by the National Institute of Diabetes and Digestive and Kidney Diseases (grant DK067523).
Abbreviations:
- ATN
- acute tubular necrosis
- GFR
- glomerular filtration rate
- MTT
- mean transit time
- MTTA
- MTT for vascular compartment
- MTTC
- MTT for collecting system compartment
- MTTK
- MTT for whole kidney
- MTTT
- MTT for tubular compartment
- ROC
- receiver operating characteristic
- RPF
- renal plasma flow
- 3D
- three-dimensional
References
- 1.Chandraker A. Diagnostic techniques in the work-up of renal allograft dysfunction: an update. Curr Opin Nephrol Hypertens 1999;8(6):723–728 [DOI] [PubMed] [Google Scholar]
- 2.2009 Annual Report of the U.S Organ Procurement and Transplantation Network and the Scientific Registry of Transplant Recipients: Transplant Data 1999-2008. U.S. Department of Health and Human Services Web site. http://www.ustransplant.org/annual_reports/current/. Accessed September 30, 2009
- 3.Racusen LC, Solez K, Colvin RB, et al. The Banff 97 working classification of renal allograft pathology. Kidney Int 1999;55(2):713–723 [DOI] [PubMed] [Google Scholar]
- 4.Breza J, Navrátil P. Renal transplantation in adults. BJU Int 1999;84(2):216–223 [DOI] [PubMed] [Google Scholar]
- 5.Ojo AO, Wolfe RA, Held PJ, Port FK, Schmouder RL. Delayed graft function: risk factors and implications for renal allograft survival. Transplantation 1997;63(7):968–974 [DOI] [PubMed] [Google Scholar]
- 6.Cosio FG, Pelletier RP, Falkenhain ME, et al. Impact of acute rejection and early allograft function on renal allograft survival. Transplantation 1997;63(11):1611–1615 [DOI] [PubMed] [Google Scholar]
- 7.Matas AJ, Tellis VA, Sablay L, Quinn T, Soberman R, Veith FJ. The value of needle renal allograft biopsy. III. A prospective study. Surgery 1985;98(5):922–926 [PubMed] [Google Scholar]
- 8.Allen RD, Chapman JR. A manual of renal transplantation. Boston, Mass: Little, Brown, 1994 [Google Scholar]
- 9.Bach D, Wirth C, Schott G, Hollenbeck M, Grabensee B. Percutaneous renal biopsy: three years of experience with the biopty gun in 761 cases—a survey of results and complications. Int Urol Nephrol 1999;31(1):15–22 [DOI] [PubMed] [Google Scholar]
- 10.Gufler H, Weimer W, Neu K, Wagner S, Rau WS. Contrast enhanced MR angiography with parallel imaging in the early period after renal transplantation. J Magn Reson Imaging 2009;29(4):909–916 [DOI] [PubMed] [Google Scholar]
- 11.de Priester JA, den Boer JA, Christiaans MHL, et al. Automated quantitative evaluation of diseased and nondiseased renal transplants with MR renography. J Magn Reson Imaging 2003;17(1):95–103 [DOI] [PubMed] [Google Scholar]
- 12.Wentland AL, Sadowski EA, Djamali A, Grist TM, Becker BN, Fain SB. Quantitative MR measures of intrarenal perfusion in the assessment of transplanted kidneys: initial experience. Acad Radiol 2009;16(9):1077–1085 [DOI] [PMC free article] [PubMed] [Google Scholar]
- 13.Agildere AM, Tarhan NC, Bozdagi G, Demirag A, Niron EA, Haberal M. Correlation of quantitative dynamic magnetic resonance imaging findings with pathology results in renal transplants: a preliminary report. Transplant Proc 1999;31(8):3312–3316 [DOI] [PubMed] [Google Scholar]
- 14.Szolar DH, Preidler K, Ebner F, et al. Functional magnetic resonance imaging of human renal allografts during the post-transplant period: preliminary observations. Magn Reson Imaging 1997;15(7):727–735 [DOI] [PubMed] [Google Scholar]
- 15.Sadowski EA, Djamali A, Wentland AL, et al. Blood oxygen level-dependent and perfusion magnetic resonance imaging: detecting differences in oxygen bioavailability and blood flow in transplanted kidneys. Magn Reson Imaging 2010;28(1):56–64 [DOI] [PMC free article] [PubMed] [Google Scholar]
- 16.Mizuiri S, Hayashi I, Takano M, et al. Fractional mean transit time in transplanted kidneys studied by technetium-99m-DTPA: comparison of clinical and biopsy findings. J Nucl Med 1994;35(1):84–89 [PubMed] [Google Scholar]
- 17.González A, Vigués F, Puchal R, Franco E, Bartrons R, Ambrosio S. Evaluation of renographic and metabolic parameters in human kidney transplantation. Q J Nucl Med 1997;41(1):42–45 [PubMed] [Google Scholar]
- 18.el Maghraby TA, van Eck-Smit BL, de Fijter JW, Pauwels EK. Quantitative scintigraphic parameters for the assessment of renal transplant patients. Eur J Radiol 1998;28(3):256–269 [DOI] [PubMed] [Google Scholar]
- 19.Hayashi I. Usefulness of radioisotope (RI) deconvolution analysis with Tc-99m-DTPA in transplanted kidney. [in Japanese] Kaku Igaku 1989;26(9):1193–1197 [PubMed] [Google Scholar]
- 20.Prasad PV. Functional MRI of the kidney: tools for translational studies of pathophysiology of renal disease. Am J Physiol Renal Physiol 2006;290(5):F958–F974 [DOI] [PMC free article] [PubMed] [Google Scholar]
- 21.Bokacheva L, Rusinek H, Zhang JL, Chen Q, Lee VS. Estimates of glomerular filtration rate from MR renography and tracer kinetic models. J Magn Reson Imaging 2009;29(2):371–382 [DOI] [PMC free article] [PubMed] [Google Scholar]
- 22.von Schulthess GK, Kuoni W, Gerig G, Wüthrich R, Duewell S, Krestin G. Semiautomated ROI analysis in dynamic MR studies. II. Application to renal function examination. J Comput Assist Tomogr 1991;15(5):733–741 [DOI] [PubMed] [Google Scholar]
- 23.Kikinis R, von Schulthess GK, Jäger P, et al. Normal and hydronephrotic kidney: evaluation of renal function with contrast-enhanced MR imaging. Radiology 1987;165(3):837–842 [DOI] [PubMed] [Google Scholar]
- 24.Lee VS, Rusinek H, Bokacheva L, et al. Renal function measurements from MR renography and a simplified multicompartmental model. Am J Physiol Renal Physiol 2007;292(5):F1548–F1559 [DOI] [PubMed] [Google Scholar]
- 25.Zhang JL, Rusinek H, Bokacheva L, et al. Functional assessment of the kidney from magnetic resonance and computed tomography renography: impulse retention approach to a multicompartment model. Magn Reson Med 2008;59(2):278–288 [DOI] [PMC free article] [PubMed] [Google Scholar]
- 26.Bokacheva L, Rusinek H, Zhang JL, Lee VS. Assessment of renal function with dynamic contrast-enhanced MR imaging. Magn Reson Imaging Clin N Am 2008;16(4):597–611, viii [DOI] [PMC free article] [PubMed] [Google Scholar]
- 27.Rusinek H, Boykov Y, Kaur M, et al. Performance of an automated segmentation algorithm for 3D MR renography. Magn Reson Med 2007;57(6):1159–1167 [DOI] [PubMed] [Google Scholar]
- 28.Bokacheva L, Rusinek H, Chen Q, et al. Quantitative determination of Gd-DTPA concentration in T1-weighted MR renography studies. Magn Reson Med 2007;57(6):1012–1018 [DOI] [PubMed] [Google Scholar]
- 29.Zhang JL, Rusinek H, Chen Q, et al. Assessment of renal function using MR renography without aortic input information. Presented at the joint annual meeting of the ISMRM-ESMRMB, Toronto, Canada, 2008 [Google Scholar]
- 30.Tourville DR, Kim DU, Viscuso R, Jacobs M, Schoen S, Fillipone D. Anticipation of renal transplant failure by postanastomosis biopsy and immunofluorescence. Transplant Proc 1977;9(1):91–95 [PubMed] [Google Scholar]
- 31.Anaise D, Oster ZH, Atkins HL, et al. Cortex perfusion index: a sensitive detector of acute rejection crisis in transplanted kidneys. J Nucl Med 1986;27(11):1697–1701 [PubMed] [Google Scholar]
- 32.Rosen S, Stillman IE. Acute tubular necrosis is a syndrome of physiologic and pathologic dissociation. J Am Soc Nephrol 2008;19(5):871–875 [DOI] [PubMed] [Google Scholar]
- 33.Mason J, Welsch J, Takabatake T. Disparity between surface and deep nephron function early after renal ischemia. Kidney Int 1983;24(1):27–36 [DOI] [PubMed] [Google Scholar]
- 34.Brazis M, Rosen S, Epstein FH. Acute renal failure. In: Brenner BM, Rector FC, eds. The kidney. 4th ed. Philadelphia: Saunders, 1991; 1008–1009 [Google Scholar]
- 35.Eisenberger U, Thoeny HC, Binser T, et al. Evaluation of renal allograft function early after transplantation with diffusion-weighted MR imaging. Eur Radiol 2010;20(6):1374–1383 [DOI] [PubMed] [Google Scholar]
- 36.Thoeny HC, Zumstein D, Simon-Zoula S, et al. Functional evaluation of transplanted kidneys with diffusion-weighted and BOLD MR imaging: initial experience. Radiology 2006;241(3):812–821 [DOI] [PubMed] [Google Scholar]
- 37.Djamali A, Sadowski EA, Samaniego-Picota M, et al. Noninvasive assessment of early kidney allograft dysfunction by blood oxygen level-dependent magnetic resonance imaging. Transplantation 2006;82(5):621–628 [DOI] [PubMed] [Google Scholar]