

Summary
Polycomb Repressive Complexes (PRC1 and PRC2) mediated epigenetic regulation is critical for maintaining cellular homeostasis. Members of Polycomb Group (PcG) proteins including EZH2, a PRC2 component, are up-regulated in various cancer types, implicating their role in tumorigenesis. Here, we have identified several microRNAs (miRNAs) that are repressed by EZH2. These miRNAs in turn regulate the expression of PRC1 proteins, BMI1 and RING2. We found that ectopic overexpression of EZH2-regulated miRNAs attenuated cancer cell growth and invasiveness, and abrogated cancer stem cell properties. Importantly, expression analysis revealed an inverse correlation between miRNA and PRC protein levels in cell culture and prostate cancer tissues. Taken together, our data has uncovered a coordinate regulation of PRC1 and PRC2 activities that is mediated by miRNAs.
Introduction
Polycomb group (PcG) proteins are evolutionarily conserved regulators of gene silencing important in metazoan development (Surface et al.), stem cell pluripotency (Pereira et al.), and X chromosome inactivation (Cao et al., 2002; Margueron and Reinberg, 2011). PcG proteins form multiprotein repressive complexes called PRCs. Both PRC1 and PRC2 play a critical role in the maintenance of normal and cancer stem cell populations (Ezhkova et al., 2009; Lukacs et al., 2010; Pietersen et al., 2008). Dysregulation of PcG proteins can contribute to a number of human diseases, most notably, cancer (Bracken and Helin, 2009; Margueron and Reinberg, 2011).
Key components of the human PRC2 include the histone methyltransferase Enhancer of Zeste Homolog 2 (EZH2), and its binding partners, Embryonic Ectoderm Development (EED) and Suppressor of Zeste 12 (SUZ12), which function as a multi-subunit complex that trimethylates histone H3K27. PRC2 is thought to be recruited to target genomic loci by long non-coding RNAs (ncRNAs) such as HOTAIR (Gupta et al., 2010; Kaneko et al.; Rinn et al., 2007). EZH2, which is the enzymatic component of PRC2, is elevated in aggressive forms of prostate and breast cancer (Kleer et al., 2003; Varambally et al., 2002), as well as multiple other solid tumors (Matsukawa et al., 2006; Sudo et al., 2005). Loss of microRNA (miRNA)-101, has been shown to be one mechanism that leads to elevated EZH2 and PRC2 activity in tumors (Cao et al.; Chiang et al.; Friedman et al., 2009; Varambally et al., 2008; Wang et al.). Also, miR-26a was reported to target EZH2 in cancer and myogenesis (Lu et al.; Wong and Tellam, 2008). Accumulating evidence suggests that increased activity of PRC2 is oncogenic as measured by cell proliferation (Bracken et al., 2003; Varambally et al., 2002), cell invasion (Cao et al., 2008; Kleer et al., 2003), anchorage-independent growth (Bracken et al., 2003; Kleer et al., 2003), maintenance of tumor-initiating cells, tumor xenograft growth (Yu et al., 2007b) and metastasis in vivo (Min et al.).
A key collaborator of PRC2 in epigenetic silencing is human PRC1, which is comprised of B lymphoma Mo-MLV insertion region 1 (BMI1), RING1 (also known as RING1A or RNF1) and RING2 (also known as RING1B or RNF2), and functions as a multi-protein complex to ubiquitinate histone H2A at lysine 119 (uH2A) (Cao et al., 2005; Wang et al., 2004). The prevailing hypothesis is that PRC2 mediated trimethylation of H3K27 recruits PRC1 to gene loci, which enacts chromatin condensation and epigenetic silencing of target genes (Bracken and Helin, 2009). Like PRC2 component EZH2, BMI1 and RING2 have been shown to be elevated in a number of tumor types (Glinsky et al., 2005; Sanchez-Beato et al., 2006) and regulate self-renewal of embryonic stem cells and cancer stem cells (Galmozzi et al., 2006; Valk-Lingbeek et al., 2004). The mechanism of how PRC2 and PRC1 coordinate their functions is still unclear. In this study, we sought to explore the regulatory axis between PRCs and whether miRNAs mediate the synergy between the two complexes.
Results
PcG proteins Are Regulated by miRNAs
Previously, it has been reported that EZH2, the methyltransferase subunit of the PRC2 complex, is repressed by miR-101 (Friedman et al., 2009; Varambally et al., 2008) and miR-26a (Lu et al., 2011; Wong and Tellam, 2008). We hypothesized that PcG proteins (comprising the mammalian PRC complexes) may in general be regulated by miRNAs. To test this hypothesis, we knocked down Dicer, a key protein required for miRNA processing, by employing Dicer-specific siRNA duplexes. By immunoblot analysis, we found that PRC2 proteins EZH2, EED, and SUZ12, and PRC1 proteins BMI1 and RING2 were increased significantly by 3 different Dicer siRNA duplexes (Fig. 1A and Fig. S1A). These experiments support the general notion that miRNAs function to repress PcG expression.
Figure 1. PcG proteins are regulated by miRNAs.
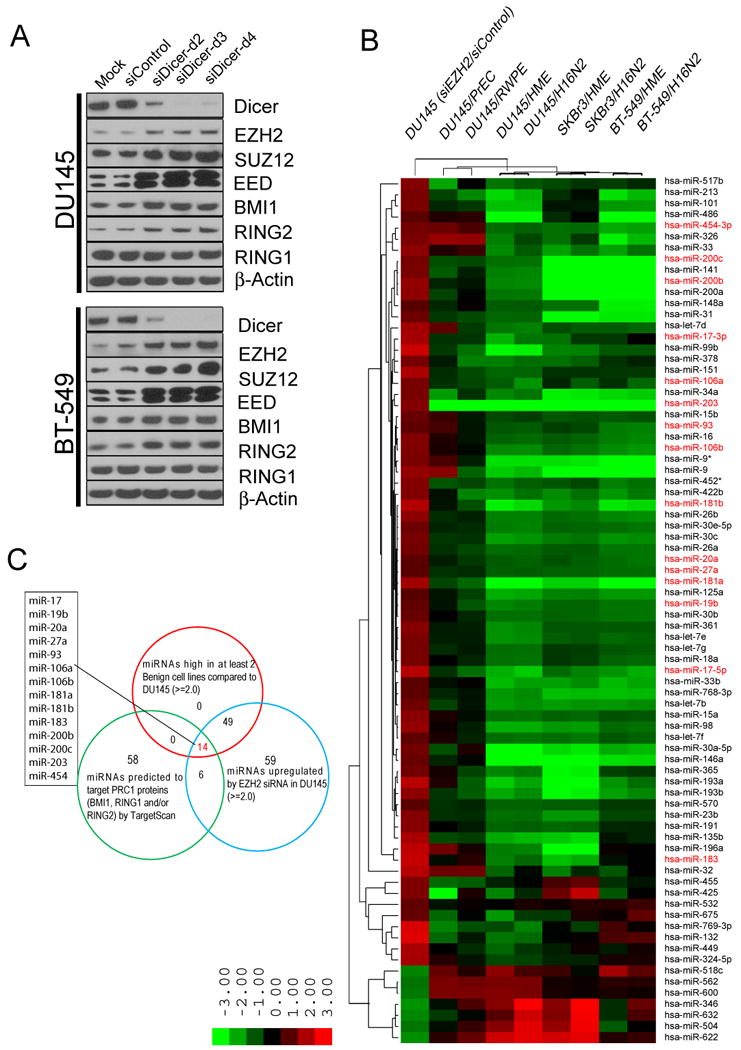
(A) Knockdown of Dicer in DU145 and BT-549 cells by 3 different Dicer-specific duplexes and PcG protein expression was assessed. (B) miRNA profiling of DU145 prostate cancer cells in which EZH2 was knocked-down compared to DU145 cancer cells relative to benign cells HME, PrEC, RWPE and H16N2. Shades of red represent increased gene expression while shades of green represent decreased expression. (C) A Venn diagram depicting 14 miRNAs that were upregulated by EZH2 knockdown, had high endogenous levels in normal cells, and were predicted to target PRC1 proteins. See also Figure S1 and Table S1.
Identification of EZH2-regulated miRNAs
To explore miRNAs regulated by PRC2 globally, we knocked-down EZH2 in DU145 prostate cancer cells with a validated siRNA targeting EZH2 and monitored miRNA expression with Illumina BeadChips. In parallel, we compared these miRNA profiles with DU145 cells relative to four benign epithelial cell lines of either prostate (PrEC and RWPE) or breast (H16N2 and HME) origin. We primarily observed miRNAs that were decreased in cancer cells relative to benign that are targets of repression by EZH2, and thus PRC2. We found 63 miRNAs that were downregulated in DU145 cells compared to the normal cell lines, and inhibition of EZH2 by knockdown restored expression of these miRNAs (Fig. 1B and Table S1). Similarly, the expression levels of these 63 miRNAs were downregulated in breast cancer cells BT-549 and SKBr3 compared to breast benign epithelial cells H16N2 and HME (Fig. 1B and Table S1) Using miRNA target analysis (www.targetscan.org), we identified 14 miRNAs as top candidates with the following properties: 1, upregulated by EZH2 knock-down in DU145 cancer cells which express high levels of PRC2; 2, higher in benign cell lines compared to DU145 cells and 3, predicted to bind to the 3′UTR of target PRC1 components based on TargetScan (Fig. 1C). Thirteen of the 14 miRNAs meeting these criterion fell into several known miRNAs clusters and families, including miR-200b and miR-200c in the miR-200 family, which has previously been reported to repress BMI1 (Shimono et al., 2009; Wellner et al., 2009). Of the 14 miRNAs, only miR-203, which is also known to target BMI1 (Wellner et al., 2009), does not belong to any known cluster or family (Fig. S1B).
EZH2-regulated microRNAs Inhibit Expression of PRC1 Proteins, BMI1 and RING2
To pinpoint the specific miRNAs that target PRC1 (out of the 14 that were nominated by computational approaches) (Fig. 1C), we over-expressed each of them in BT-549 and DU145 cancer cell lines and monitored EZH2, BMI1 and RING2 protein expression (Fig. 2A and Fig. S2A). Of these, miR-181a, b decreased RING2 protein levels, miR-203 decreased BMI1 protein levels while miR-200b, c decreased both BMI1 and RING2 (Fig. 2A). Attenuation of these PRC1 members resulted in decreased global ubiquityl-H2A, a known PRC1 substrate and mark of gene repression. Furthermore, PRC1 targets including p16INK4A (Jacobs et al., 1999a) and p21 (Waf1/Cip) (Fasano et al., 2007) were de-repressed (Fig. 2A). Several of the miRNAs computationally predicted to inhibit PRC1 failed to do so by over-expression including miR-17, miR-19b, and others (Fig.S2A). Similar to protein levels, real time qPCR showed miR-181a, b and miR-200b, c decreased RING2 transcript levels and miR-200b, c and miR-203 decreased BMI1 transcript levels in BT-549 cells (Fig. 2B). As expected, overexpressing miR-200b or miR-203 decreased BMI1 occupancy on known PRC1 target gene p16, p19 (Jacobs et al., 1999b), p21 and HoxC13 (Cao et al., 2005) regions (Fig. S2B).
Figure 2. PRC2-regulated miRNAs repress PRC1 proteins BMI1 and RING2.
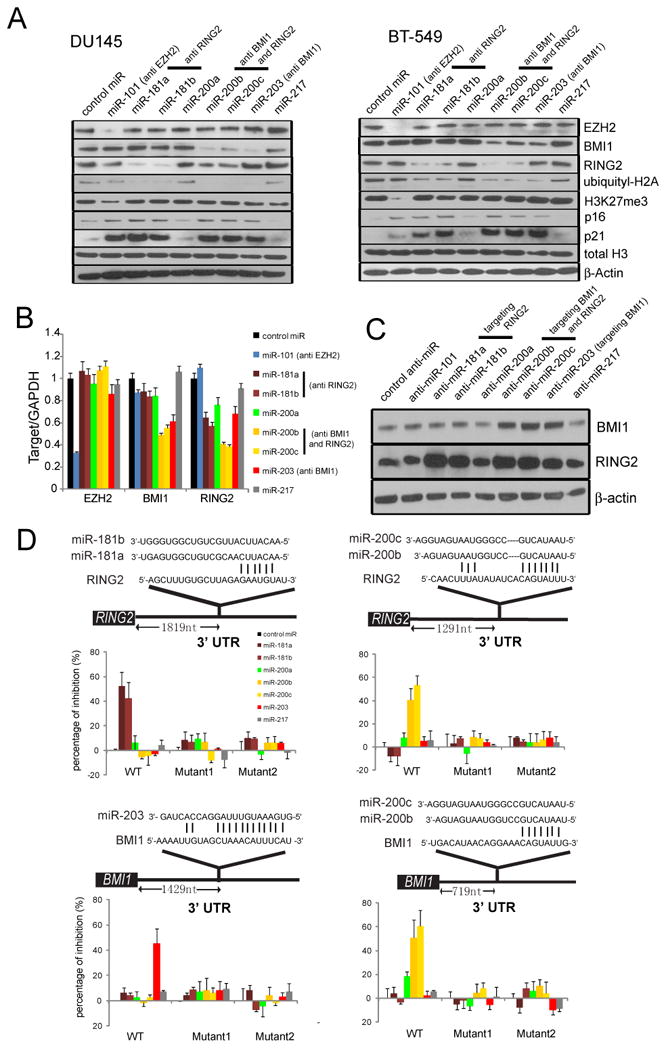
(A) Overexpression of indicated miRs in DU145 and BT-549 cells and expression of PRC components, PRC2 histone mark H3K27me3, PRC1 target histone mark ubiquityl-H2A and indicated genes by immunoblot analysis. β-Actin and total H3 were used as loading controls. (B) As in (A), except transcript level was assessed in BT-549 by qPCR. (C) Transfection of indicated antagomiRs (anti-miR) in H16N2 cells and immunoblot analysis for BMI1 and RING2. β-Actin was used as a loading control. (D) TargetScan analysis depicting potential binding sites for EZH2-regulated miRNAs in the 3′UTR of BMI1 and RING2. Luciferase reporter assays with wild-type or mutant 3′UTR constructs of BMI1 or RING2 demonstrate that miR-181a, miR-181b, miR-200b, miR-200c, and miR-203 repress BMI1 and/or RING2 activity. All bar graphs are shown with ±SEM. See also Figure S2.
To further corroborate our miRNA over-expression studies, we also extinguished expression of miRNAs using antagomiRs (Krutzfeldt et al., 2005). Consistent with our predictions, antagomiR-200b, antagomiR-200c and antagomiR-203 increased BMI1 protein levels, while antagomiR-181a, antagomiR-181b, antagomiR-200b and antagomiR-200c increased RING2 protein levels in H16N2 cells (Fig. 2C).
To evaluate whether these miRNAs directly bind to the 3′UTR of BMI1 or RING2, we cloned the predicted binding sites of the wild-type or mutant 3′UTR into a luciferase reporter system and co-transfected them with miRNA expression vectors into BT-549 cells (Fig. 2D and Fig. S2C-F). As expected, inhibition of luciferase activity was observed in cells transfected with constructs containing wild-type binding sites but not the mutant constructs. The RING2 3′UTR reporters were down-regulated by miR-181a, miR-181b, miR-200b and miR-200c while the BMI1 3′UTR reporters were down-regulated by miR-200b, miR-200c and miR-203 (Fig. 2D).
We next determined whether the miRNAs that regulate PRC1 were directly regulated by PRC2 in BT-549 and DU145 cells. Cells were transfected with either a validated EZH2 siRNA or miR-101 (both of which target and down-regulate the PRC2), and expression levels of target miRNAs were measured by real time PCR. miR-181a, miR-181b, miR-200a, miR-200b, miR-200c and miR-203 expression levels were increased in EZH2 siRNA or miR-101 transfected cells. Expression of miRNAs miR-217 and miR-219, two control microRNAs not predicted to be regulated by EZH2, were not altered (Fig. 3A). Further, we observed similar expression changes in these microRNAs upon stable overexpression of miR-101 or EZH2 shRNA in DU145 and SKBr3 cells (Fig. S3A). Also we observed that miR-101 was increased in DU145 cells in which EZH2 was stably knocked down, suggesting the existence of feedback regulation between EZH2 and miR-101. In contrast, overexpression of EZH2, but not EZH2ΔSET (which is missing its catalytic SET domain), decreased miR-181a, miR-181b, miR-200a, miR-200b, miR-200c and miR-203 levels in H16N2 cells (Fig. S3B).
Figure 3. PRC2 silences multiple miRNAs by epigenetic mechanisms.

(A) Taqman miRNA qPCR analysis of indicated miRs in BT-549 and DU145 cells in which EZH2 was knocked down using siRNA or miR-101 (a microRNA which targets EZH2). Quantitative microRNA levels were normalized against U6. (B) As in (A), except DZNep at two different doses and time points was incubated with DU145 cells. (C), As in (A), except SAHA and/or 5-aza-dC was used in BT-549 and DU145 cells. (D) ChIP-qPCR analysis of H3K27me3 at indicated genes and microRNAs in BT-549 cells treated with SAHA and/or 5-aza-dC. All bar graphs are shown with ±SEM. See also Figure S3.
Next, we treated DU145 cells with the global histone methylation inhibitor, deazaneplanocin A (DZNep), that depletes PRC2 and thus attenuates H3K27me3 (Tan et al., 2007). Interestingly, DZNep treatment led to de-repression of the putative PRC2-targeted miRNAs including miR -181a,b, miR-200a,b,c, and miR-203 (Fig. 3B). This effect was both concentration and incubation time dependent. Control microRNAs, miR-217, miR-219 and miR-21 were not affected by DZNep treatment.
In addition to DZNep, we evaluated other chemical inhibitors of epigenetic pathways. As HDAC activity is essential for EZH2 function (Cao et al., 2008; Kleer et al., 2003), and EZH2 directly or indirectly facilitates DNA methylation (Vire et al., 2006), we predicted that treatment with the HDAC inhibitor suberoylanilide hydroxamic acid (SAHA) and/or the DNA methylation inhibitor 5-aza-2′-deoxycytidine (5-aza-dC) would inhibit EZH2-mediated epigenetic modifications, leading to an increase in miRNA expression. Treatment of BT-549 and DU145 cells with 5-aza-dC or SAHA alone or in combination, resulted in a marked increase in miR-181ab, miR-200a,b,c, and miR-203 expression, suggesting epigenetic regulation of these microRNAs (Fig. 3C).
Importantly, when we overexpressed EZH2 by adenovirus in DZNep or SAHA and 5-aza-dC treated DU145 cells, EZH2 could completely abolish DZNep mediated miRNA upregulation (Fig. S3C), and partially decreased SAHA and 5-aza-dC mediated miRNA upregulation (Fig. S3D) presumably because SAHA and 5-aza-dC also inhibited HDAC and DNMT activities.
To confirm that EZH2 regulates these microRNAs by epigenetic repression, we performed chromatin immunoprecipitation (ChIP) assays with anti-H3K27me3, EZH2 and BMI1 antibodies in BT-549 cells. Interestingly, H3K27me3 and EZH2 occupied the PRC2-regulated miRNAs regions as expected. In addition, BMI1 also occupied these regions (Fig. S3E), suggesting that a negative feedback system between PRC2-regulated miRNAs and PRC1 may exist. Furthermore, an EZH2-specific siRNA (Fig. S3F) or treatment with 5-aza-dC and SAHA, either alone or in combination (Fig. 3D), markedly decreased the H3K27me3 occupancy in these regions.
EZH2-regulated miRNAs Attenuate Growth, Invasiveness and Self-renewal of Cancer Cells
Because EZH2 has been shown to repress several tumor suppressor genes (Cao et al., 2008; Chen et al., 2005; Fujii et al., 2008; Min et al.; Yu et al., 2007b; Yu et al.), we postulated that the EZH2-regulated microRNAs also functioned as tumor suppressors. Consistent with this hypothesis, overexpression of either miR-181a, miR-181b, miR-200a, miR-200b, miR-200c or miR-203 markedly attenuated BT-549 and DU145 cell proliferation to levels similar to that of cells transfected with EZH2 siRNA, or cells overexpressing miR-101 (Fig. 4A and Fig. S4A. *p<0.001, **p<0.01). Likewise, overexpression of either miR-181a, miR-181b, miR-200a, miR-200b, miR-200c, or miR-203 inhibited the in vitro invasive potential of BT-549 and DU145 cells through modified Boyden chambers coated with Matrigel (Fig. 4B, *p<0.005, **p<0.02). However overexpressing EZH2-repressed miRNAs had no effect on the invasiveness of RWPE-UBE2L3-KRAS and RWPE-SLC45A3-BRAF stable cells, in which fusion proteins UBE2L3-KRAS (Wang et al., 2011) and SLC45A3-BRAF (Bonci et al., 2008; Palanisamy et al., 2010) confer neoplastic properties to RWPE cells (Fig. S4B), suggesting that EZH2-repressed miRNAs miR-181a,b, miR-200b,c and miR-203 may inhibit cell invasion through acting on PRC1 proteins. However, EZH2 repressed miRNAs still decreased RWPE-UBE2L3-KRAS and RWPE-SLC45A3-BRAF proliferation (Fig. S4C), consistent with a critical role of PcG proteins in cell growth.
Figure 4. PRC2-mediated regulation of microRNAs potentiates the cancer cell phenotype.

(A) Overexpression of PRC2-regulated miRNAs, but not control miR-217 or miR-219, inhibited BT-549 cell proliferation. EZH2 siRNA and miR-101 overexpression were positive controls and miR-217 and miR-219 overexpression were negative controls. *p<0.001, **p<0.01. (Student's t test). (B) Overexpression of PRC2-regulated miRNAs decreased BT-549 and DU145 cell invasion in vitro. *p<0.01. (Student's t test). (C) Overexpression of PRC2-regulated miRNAs suppressed DU145 anchorage-independent growth in soft agar. *p<0.01. (Student's t test). (D) Overexpression of EZH2-regulated miRNAs decreased prostatosphere formation by DU145 cells. *p<0.01. (Student's t test). Representative images of prostatospheres (scale bar: 100 μm) were shown in the inset. (E) qPCR analysis demonstrating EZH2, BMI1 and RING2 transcript levels were higher in spheres compared to monolayer culture, while miR-101, miR-181a, b, miR-200a, b, c and miR-203, but not miR-217 or miR-219, were lower in spheres compared to monolayers. Expression level of each gene was normalized to GAPDH or U6 and normalized to corresponding monolayer cultured cell line. (F) qPCR analysis showing EZH2, BMI1 and RING2 levels were higher in sorted CD24-/CD44+ DU145 and RWPE cells compared to the unsorted population, while miR-101, miR-181a, b, miR-200s, and miR-203, but not miR-217 or miR-219, were lower in CD24-/CD44+ DU145 and RWPE cells compared to an unsorted population. (G) Genes regulated by EZH2-repressed miRNAs cluster into multiple functional concepts. BT-549 and DU145 cells were transfected with EZH2-repressed miRNAs followed by gene expression profiling and Molecular Concepts analysis. Each node represents a molecular concept or set of biologically related genes. miR-101, miR-181a, miR-181b, miR-200a, miR-200b, miR-200c and miR-203 (miRNA signatures, purple for BT-549, orange for DU145) were enriched for concepts related to cancer (yellow), cancer survival (red), stem cell likeness (blue), and function of polycomb group (green). All bar graphs are shown with ±SEM. See also Figure S4, and Table S2, S3 and S4.
To investigate whether miR-181a, miR-181b, miR-200a, miR-200b, miR-200c or miR-203 inhibit anchorage-independent growth, we performed soft agar colony formation assays. Similar to miR-101 and EZH2 knock down controls, overexpression of miR-181a, miR-181b, miR-200a, miR-200b, miR-200c and miR-203 markedly suppressed DU145 colony formation (Fig. 4C, *p<0.001, **p<0.01). Next, we evaluated the ability of DU145 to form prostatospheres in sphere-promoting cell media. This assay serves as a surrogate measure of stem-cell-like phenotypes, and cells that are able to form spheres have enhanced stem cell characteristics (Lawson et al., 2007). We found that miR-181a, miR-181b, miR-200a, miR-200b, miR-200c and miR-203 overexpression, as well as miR-101 overexpression and EZH2 siRNA controls, significantly inhibited the ability of DU145 cells to form spheres in this assay (Fig. 4D, *p<0.001, **p<0.01). Intriguingly, several genes implicated in pluripotency and cellular reprogramming by induced pluripotency, such as Klf4, Sox2 and c-Myc, were markedly downregulated by miR-200b, miR-200c and miR-203, and marginally decreased by miR-101, miR-181a, miR-181b and miR-200a expression, but not by miR-217 or miR-219 controls (Fig. S4D). Relative to the human embryonic stem cell H7, BT-549 and DU145 cancer cells have comparable expression levels of iPS factors and PcG proteins (Fig. S4E).
Next, we measured expression levels of EZH2, BMI1, RING2 and key microRNAs relevant to this study in spheres and mono-layers. In BT-549, SKBr3, DU145 and PC3 cells, we observed that EZH2, BMI1 and RING2 levels were higher in spheres than in mono-layers; conversely miR-101, miR-181a, miR-181b, miR-200a, miR-200b, miR-200c and miR-203 levels were lower in spheres than in mono-layers (Fig. 4E). Using DU145 and RWPE parental cell lines, we employed flow cytometry to isolate cells with high expression of the CD44 surface antigen and low expression of the CD24 surface antigen (CD24-/CD44+), a cell population enriched for stem-cell-like phenotypes (Hurt et al., 2008). We measured EZH2, BMI1, RING2 and miRNA levels in CD24-/CD44+ cells compared to total, unsorted cells. We observed that EZH2, BMI1 and RING2 levels were increased in CD24-/CD44+ cells, but miR-101, miR-181a, miR-181b, miR-200a, miR-200b, miR-200c and miR-203 expression were decreased in this cell population (Fig. 4F). Taken together, the data provide compelling evidence for the coordinated regulation of PRC2, PRC1 and miRNAs in the maintenance of a differentiated cellular state and inhibition of stem cell-like phenotypes.
In order to understand the functional biology of the miRNAs identified in this study, we sought to identify global gene expression patterns and molecular pathways to which they might contribute. We conducted gene expression microarray analyses of DU145 and BT-549 cells transfected with control miRNA, miR-101, miR-181a, miR-181b, miR-200a, miR-200b, miR-200c or miR-203. As shown in Table S2 and S3, EZH2-repressed miRNAs targeted many predicted genes. When we analyzed the miRNA-regulated genes using Molecular Concepts Maps (MCM) (Tomlins et al., 2007b), as expected, molecular concepts associated with these miRNAs were highly overlapping, showing a high correlation to gene sets representing multiple cancers, metastatic cancer processes, cancer survival, Polycomb Group targets, and stem cell-related genes (Fig. 4G, and Table S4).
In order to further examine the molecular link between PRC1 and PRC2 activities, we generated DU145 cells stably overexpressing miR-200b and miR-203 (Fig. S5A), and monitored levels of BMI1 and RING2. BMI1 and RING2 were decreased in miR-200b stable cells while only BMI1 was decreased in miR-203 stable cells. In addition, uH2A, the histone modification mediated by PRC1, was similarly decreased in both miR-200b and miR-203 expressing cells. Interestingly, BMI1, RING2 and uH2A, as well as EZH2 and H3K27me3, were decreased in miR-101 stable expressing DU145 cells (Fig.5A) suggesting that prolonged knock-down of PRC2 components leads to suppression of PRC1. Using cell count and Boyden chamber invasion assays, we found that similar to miR-101, miR-200b and miR-203 stably expressing cells grew more slowly and were less invasive than vector-transfected cells (Fig. 5B and 5C). Intriguingly, co-expression of BMI1 or EZH2 (control) without the 3′UTR both restored the proliferation and invasion properties of DU145 cells despite the presence of miR-101, miR-200b or miR-203 (Fig. 5B and 5C). Importantly, murine xenograft experiments demonstrated that DU145 cells with stable knockdown of PRC1 proteins BMI1 or RING2 (Fig. S5B), or expressing miR-181b (Fig. S5C), miR-200b or miR-203 grew more slowly than the vector control in vivo (p= 0.0001, Fig. 5D and 5E).
Figure 5. PRC2-repressed miRNAs inhibit tumor growth.
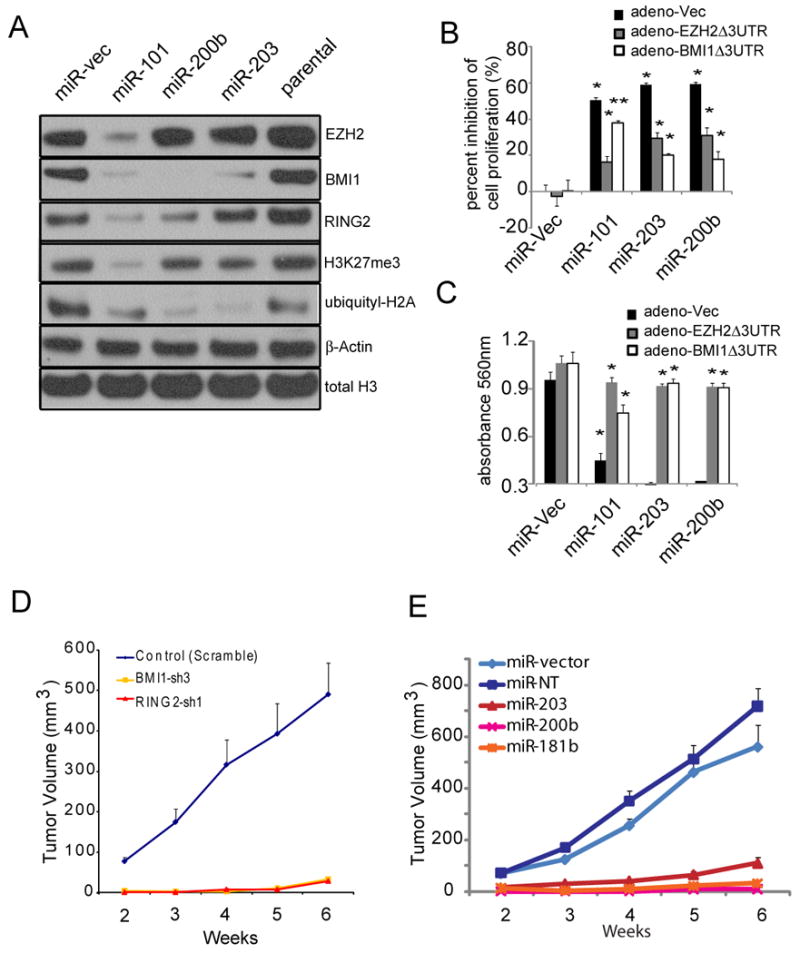
(A) DU145 cells stably overexpressing miR-101, miR-200b and miR-203 demonstrated repression of EZH2, BMI1 or RING2, as well as decreased H3K27me3 and ubiquityl-H2A (uH2A) levels. (B and C), Co-expression of EZH2Δ3′UTR or BMI1Δ3′UTR rescued cell proliferation (B), and invasiveness (C) of DU145 cells stably overexpressing miR-101, miR-203 or miR-200b. (D) Stably knocking down BMI1 or RING2 by BMI1 specific shRNA (BMI1-sh3) or RING2 specific shRNA (RING2-sh1) decreased DU145 tumor growth in mice. N=8 for DU145 control (scramble), BMI1-sh3 and RING2-sh1 respectively were used for the xenograft. (E) Stable overexpression of miR-181b, miR-200b or miR-203 decreased DU145 tumor growth in mice. DU145 miR-vector (N=9), miR-NT (Non-Targeting) (N=8), miR-181b (N=8), miR-200b (N=8) or miR-203 (N=7) were used for the xenograft experiment. DU145 stable pools were injected subcutaneously. All bar graphs are shown with ±SEM. See also Figure S5.
EZH2-regulated miRNAs Inversely Correlate with PRC Protein Levels in Prostate Cancer
Since miR-101, miR-181a, miR-181b, miR-200a, miR-200b, miR-200c and miR-203 appear to play an important role in cancer progression, we next measured the endogenous expression levels of these miRNAs by qPCR analysis of a cohort of benign prostate, localized and metastatic prostate cancers in which we had measured miR-101, miR-217 and EZH2 levels previously (Varambally et al., 2008). As expected, miR-181a, miR-181b, miR-200a, miR-200b, miR-200c and miR-203 levels were lowest in metastatic prostate cancer tissues, and highest in benign prostate tissues (Fig. 6A). In addition, immunoblot analyses showed that BMI1, RING2 and uH2A, as well as EZH2, but not RING1, were increased in metastatic prostate cancer compared to benign tissues and localized cancer samples (Fig. 6B and Fig. S6A). EZH2 levels were highly correlated with BMI1, RING2 and H2A protein levels (Fig. S6B), further supporting a molecular link between PRC1 and PRC2 expression and activities during cancer progression. As expected, ChIP assays showed that H3K27me3-marked chromatin occupied the miR-203 upstream region in metastatic prostate cancer, but not in localized prostate cancer (PCA) (Fig. S6C). Similarly, DNA methylation of the miR-203 genomic region was observed in localized and metastatic prostate cancer but not benign prostate tissue (Fig. 6C). Taken together, these data suggest that EZH2-mediated epigenetic repression of miR-181a, miR-181b, miR-200b, miR-200c and miR-203 results in an upregulation of PRC1 proteins, BMI1 and RING2, and histone code ubiquityl-H2A in advanced prostate cancer.
Figure 6. Coordinated expression of PcG proteins and PRC regulatory miRNAs in prostate cancer progression.
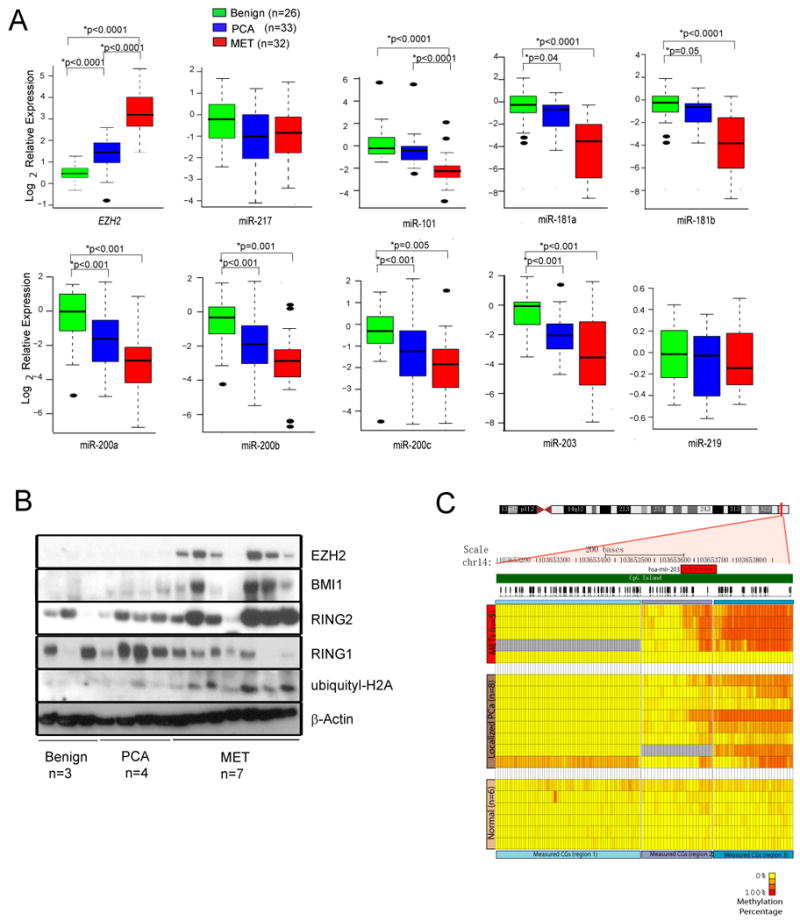
(A) Expression of indicated miRs as assessed by q-PCR in benign prostate, clinically localized prostate cancer and metastatic prostate cancer tissues. Data for EZH2, miR-217 and miR-101 was reported previously (Varambally et al., 2008) and displayed here for comparison (Student's t test). (B) Immunoblot analysis of EZH2, BMI-1, RING2, RING1 and ubiquityl-H2A in benign prostate, clinically localized prostate cancer and metastatic prostate cancer. (C) Bisulfite sequencing analysis of the miR-203 genomic region revealed cancer-specific DNA methylation in a region proximal to miR-203 in prostate cancer tissues. All bar graphs are shown with ±SEM. See also Figure S6.
Discussion
This study unravels the intricacies in the regulation of the polycomb protein complexes mediated by various miRNAs, and substantiates the essential role played by PRC in cancer. We demonstrated that increased PRC2 activity results in repression of numerous miRNAs that are known to be important in the maintenance of stem-cell-like phenotypes in cancer cells. We show that PRC2 epigenetically represses miR-181a, miR-181b, miR-200b, miR-200c and miR-203 expression by facilitating H3K27me3 trimethylation at these loci, and that exogenous overexpression of miR-181a, miR-181b, miR-200b, miR-200c and miR-203 inhibits a cancer phenotype in vitro. Furthermore, miR-181b, miR-200b and miR-203 overexpression suppressed prostate tumor formation and growth in mouse xenografts. Recently, several groups have also reported roles for miR-200b, miR-200c and miR-203 in controlling stem-cell differentiation (Yi et al., 2008), epithelial-to-mesenchymal transition (EMT) (Park et al., 2008; Wellner et al., 2009) and cancer progression (Faber et al., 2008; Shimono et al., 2009).
Here we demonstrated that PRC1 proteins BMI1 and RING2 are direct targets of miR-181a, miR-181b, miR-200b, miR-200c, and miR-203 in breast and prostate cancer. Furthermore, we observed a significant negative correlation between PRC2 expression and miR-181a, miR-181b, miR-200b, miR-200c and miR-203, as well as a strong positive correlation between EZH2, BMI1 and RING2 protein levels. Intriguingly, earlier studies suggested a discrepancy between BMI1 protein and RNA levels in prostate tissues, as protein levels were increased while RNA levels were decreased during prostate cancer progression (Varambally et al., 2005). It is possible that regulation of PRC proteins occurs at both transcriptional and post-transcriptional levels by separate mechanisms. We provide evidence that EZH2-regulated microRNAs contribute to the maintenance of a differentiated cellular state, and that miR-181a, miR-181b, miR-200b, miR-200c and miR-203 function as tumor suppressors during prostate cancer progression.
Interestingly, several recent studies have reported similar microRNA-protein regulatory networks that play critical roles in cancer. In one study, the RAS proto-oncogene was shown to be coordinately regulated by the let-7 family of miRs (Johnson et al., 2005). Likewise, the miR-15a–miR-16-1 cluster, located on chr13q14, was proposed to serve as a tumor suppressor in prostate tissue by regulating levels of cancer-related genes such as BCL2, CCND1 and WNT3A (Bonci et al., 2008). Recently, Poliseno et al. reported (Poliseno et al., 2010) a proto-oncogenic miRNA-dependent network in prostate cancer progression in which the miR-106b∼25 cluster regulates PTEN expression and cooperates with MCM7 in cellular transformation. These studies, along with our present study, strongly suggest that dysregulation of miRNA and target protein networks may contribute to cancer development.
Here, we propose a model for a coordinated PRC2-PRC1 oncoprotein axis, and epigenetic link between H3K27me3 and ubiquityl-H2A, mediated by PRC2-regulated miRNAs (Fig.7). Recently, Ilopoulos et al. reported that miR-200b regulates PRC2 protein SUZ12 (Iliopoulos et al.) in a manner similar to that of miR-101, lending further support for microRNA-mediated PRC activity during cancer progression. These findings offer multiple targets for therapeutic interventions in the treatment of aggressive cancers (Garzon et al.).
Figure 7. A proposed model role for microRNAs in regulating PRCs.

Specifically, PRC2 is molecularly linked to PRC1 via a set of regulatory miRs.
Experimental Procedures
Cell Lines
Breast cancer cell line BT-549 was grown in RPMI 1640 (Invitrogen, Carlsbad, CA) with 0.023 IU/ml insulin and 10% FBS (Invitrogen) in 5% CO2 cell culture incubator; breast cancer cell line SKBr3 was grown in RPMI 1640 (Invitrogen) with 10% FBS (Invitrogen) in 5% CO2 cell culture incubator; and prostate cancer cell line DU145 was grown in MEM with 10% FBS in 5% CO2 cell culture incubator. Immortalized breast cell lines HME and H16N2 were grown in F-12 Nutrient Mixture with 5μg/ml Insulin (Sigma, St. Louis, MO), 1μg/ml Hydrocortisone (Sigma), 10ng/ml EGF (Invitrogen), 5mM Ethanolamine (Sigma), 5μg/ml Transferrin (Sigma), 10nM Triiodo Thyronine (Sigma), 50nM Sodium Selenite (Sigma), 10mM HEPES (Invitrogen) and 50 unit/ml Penstrep (Invitrogen), 10% CO2. The PrEC (Lonza, Conshohocken, PA, USA) and RWPE (ATCC, Manassas, VA, USA) cells were grown in their respective medium as specified by the suppliers. miR-181b, miR-200b and miR-203 overexpression constructs were obtained from Openbiosystems (Huntsville, AL). Lentiviruses were generated by the University of Michigan Vector Core. BMI1, RING2 and control shRNA lentivirus were obtain from Sigma. Prostate cancer cell line DU145 was infected with lentiviruses expressing BMI1 shRNA, RING2 shRNA, miR-181b, miR-200b and miR-203 or controls only, and stable cell lines were generated by selection with 300 μg/ml puromycin (Invitrogen, Carlsbad, CA).
Benign and Tumor Tissues
In this study we utilized tissues from clinically localized prostate cancer patients who underwent radical prostatectomy as a primary therapy between 2004-2006 at the University of Michigan Hospital. Samples were also used from androgen-independent metastatic prostate cancer patients from a rapid autopsy program described previously (Tomlins et al., 2007a; Tomlins et al., 2005). The detailed clinical and pathological data are maintained in a secure relational database. This study was approved by the Institutional Review Board at the University of Michigan Medical School. Informed consent was also obtained from all subjects through the Institutional Review Board at the University of Michigan Medical School. Both radical prostatectomy series and the rapid autopsy program are part of the University of Michigan Prostate Cancer Specialized Program of Research Excellence Tissue Core.
Illumina microRNA Profiling
500 ng of total RNA from each sample was labeled and hybridized on the Human v2 microRNA Expression BeadChips (Illumina, San Diego, CA, USA) according to the manufacturers recommendations. BeadChips were scanned with the Illumina iScan Reader. Data was then average median normalized before generating differential expression values between treated and control samples.
microRNA Transfection, AntagomiR Transfection, and Small RNA Interference
Knockdown of EZH2 or Dicer was accomplished by RNA interference using siRNA duplexes (Dharmacon, Lafayette, CO) as previously described (Varambally et al., 2002). Precursors of respective microRNAs, antagomiRs and negative controls were purchased from Ambion (Austin, TX). Transfections were performed with oligofectamine (Invitrogen). EZH2 siRNA duplexes sequences, (duplex 1: GAGGTTCAGACGAGCTGAT; duplex 2: AGACTCT GAATGCAGTTGC).
miR Reporter Luciferase Assays
The 3′UTR (untranslated region) or the antisense sequence of the 3′UTR of BMI1 and RING2 were cloned into the pMIR-REPORT™ miRNA Expression Reporter Vector (Ambion). BT-549 cells were transfected with miRNAs or controls and then co-transfected with wild-type 3′UTR-luc or mutant 3′UTR-luc, as well as pRL-TK vector as internal control for luciferase activity. Post 48 hours of transfection, the cells were lysed and luciferase assays were conducted using the dual luciferase assay system (Promega, Madison, WI). Each experiment was performed in triplicate.
Drug Treatment
BT-549 and DU145 cells were treated with 5μM 5-aza-2′-deoxycytidine (5-aza-dC) for 6 days (Fresh media change containing the drug was performed every other day.), and/or 1μM suberoylanilide hydroxamic acid (SAHA) for 2 days. DU145 cells were treated with 2.5μM or 5 μM deazaneplanocin A (DZNep) for 2 or 3 days followed by RNA extraction or chromatin immunoprecipitation.
Cell Proliferation Assay and Basement Membrane Matrix Invasion Assays
Invasive breast cancer cell BT-549 and prostate cancer cell DU145 were transfected with miRNAs or controls. The cell proliferation and invasion assays were performed as described (Cao et al., 2008; Kleer et al., 2003; Varambally et al., 2008; Yu et al., 2007b).
Soft Agar Colony Formation Assays
A 50μL base layer of agar (0.6% Agar in DMEM with 10% FBS) was allowed to solidify in a 96-well flat-bottom plate prior to the addition of a 75μL miRNAs or control-transfected or stable DU145 cell suspension containing 4,000 cells in 0.4% Agar in DMEM with 10% FBS. The cell containing layer was then solidified at 4C for 15 minutes prior to the addition of 100μL of MEM with 5% FBS. Colonies were allowed to grow for 21 days followed by counting and imaging under a light microscope.
Spheres Culture
Spheres culture was performed as described (Dontu et al., 2003; Yu et al., 2007a). Briefly, cells (1000 cells/mL) were cultured in suspension in serum-free DMEM-F12 (Invitrogen), supplemented with B27 (1:50, Invitrogen), 20 ng/mL EGF (BD Biosciences), 0.4% bovine serum albumin (Sigma), and 4 μg/mL insulin (Sigma). To propagate spheres in vitro, spheres were collected by gentle centrifugation, dissociated to single cells as described (Dontu et al., 2003; Yu et al., 2007a), and then cultured to generate prostatospheres of the next generation. Spheres larger than 50 μm were counted.
Gene Expression Profiling
Expression profiling was performed using the Agilent Whole Human Genome Oligo Microarray (Santa Clara, CA) according to the manufacturer's protocol. BT-549 and DU145 cells were transfected with miRNAs or negative control for precursor microRNA. Over- and under-expressed signatures were generated by filtering to include only features with significant differential expression (Log ratio, P < .01) in all hybridizations and two-fold average over- or under-expression (Log ratio). Gene expression data is deposited into GEO (GSE26996) (http://www.ncbi.nlm.nih.gov/geo/query/acc.cgi?token=jtkzxwocgkayqja&acc=GSE26996).
Gene Set Enrichment Analysis
Molecular Concept Map (MCM) analysis was performed using gene list of putative targets to search for all concepts available in the Oncomine database as previously described (Yu et al., 2007c). Representative concepts with significant enrichment (p < 0.001) were displayed as a network (Fig. 4G, and Table S4).
Prostate Tumor Xenograft Model
All procedures involving mice were approved by the University Committee on Use and Care of Animals (UCUCA) at the University of Michigan and conform to their relevant regulatory standards. Five-week-old male nude athymic BALB/c nu/nu mice (Charles River Laboratory, Wilmington, MA) were used for examining tumorigenicity. To evaluate the role of BMI1 and RING2 knockdown, or miR-181b, miR-200b and miR-203 overexpression in tumor formation, the DU145 stably overexpressing BMI1 shRNA, RING2 shRNA, scramble shRNA, miR-181b, miR-200b, miR-203, nontargeting miR or vector control cells were propagated and 5×10⁶ cells were inoculated subcutaneously into the dorsal flank of mice (n = 7 for miR-203, n= 9 for vector control and n=8 for Scramble, BMI1-sh3, RING2-sh1, miR-181b, miR-200b, and miR-NT respectively). Tumor size was measured every week, and tumor volumes were estimated using the formula (π/6) (L × W2), where L = length of tumor and W = width.
Bisulfite Modification and Methylation-Specific PCR of miR-203 in Prostate Tissues
Bisulfite conversion was carried out using EZ DNA methylation gold kit (Zymo Research Corporation, Orange, CA) according to manufacturer's instructions. Purified DNA (2μl) was used as template for PCR reactions with primers (Integrated DNA Technologies Inc. San Diego, CA) and synthesized according to bisulfite converted DNA sequences for the regions of interest using the Methprimer software (Li and Dahiya, 2002). The PCR product was gel purified and cloned into pCR4 TOPO TA sequencing vector (Invitrogen, Carlsbad, CA). Plasmid DNA isolated from 10 colonies from each sample was sequenced by conventional Sanger Sequencing (University of Michigan DNA Sequencing Core). The “BIQ Analyzer” (Bock et al., 2005) online tool was used to calculate the methylation percentage and to generate the bar graphs.
Supplementary Material
Significance.
Polycomb group (PcG) proteins are chromatin-modifying complexes that regulate epigenetic silencing and play an important role in determining cell fate. PcG proteins form two major complexes, Polycomb Repressive Complex 1 (PRC1) and Polycomb Repressive Complex 2 (PRC2). PRC2 methylates histone H3 on lysine27 (H3K27), a chromatin mark that stimulates PRC1 to enact gene silencing at target genes. Employing in vitro and in vivo cancer models and human tumor studies, we demonstrate that PRC2 and PRC1 coordinate their functions through regulation of specific microRNAs. Increased PRC2 activity in cancer leads to repression of these microRNAs, and subsequent increase of PRC1 components. Thus, we propose that key microRNAs link PRC2 to PRC1 forming an integral regulatory axis of the epigenetic silencing machinery.
Highlights.
We identified miRNAs that are negatively regulated by PRC2 protein, EZH2.
EZH2-regulated miRNAs in turn regulate PRC1 proteins, BMI1 and RING2.
miRNAs and PRC protein levels are inversely correlated in prostate cancer.
PRC1 and PRC2 activities are coordinately regulated via miRNAs.
Acknowledgments
We thank Xia Jiang, Javed Siddiqui, Wei Yan, Bo Han, Khalid Suleman, Rohit Mehra, Rupal Shastri, and Joy E. Tsai for technical assistance, Victor E. Marquez for providing DZNep, Michigan Center for hES Cell Research for H7 RNA and qPCR, the University of Michigan Vector Core for generating adenovirus and lentivirus, Kenneth J. Pienta, Xiaosong Wang and Shanker Kalyana-Sundaram for discussions, and Jyoti Athanikar and Karen Giles for critically reading the manuscript and submission documents. This work is supported in part by the Early Detection Research Network UO1 CA111275, Prostate SPORE P50CA69568 and P50CA090386, and National Institutes of Health (R01CA132874, R01CA157845). A.M.C. is supported by the Doris Duke Charitable Foundation Clinical Scientist Award, Burroughs Welcome Foundation Award in Clinical Translational Research, the Prostate Cancer Foundation (PCF) and the Howard Hughes Medical Institute. A.M.C. is an American Cancer Society Research Professor. Q.C., J.R.P and J.C.B. are supported by U.S. Department of Defense (PC094725 to Q.C; PC094290 to J.R.P.; BC083217 to J.C.B.); R-S.M., S.A.T., and C.A.M. are supported by Young Investigator Awards from the PCF; B.A is supported by the Genentech Foundation Postdoctoral Fellowship and Young Investigator Award from the Expedition Inspiration Fund for Breast Cancer Research. Z.Q. is supported by National Institutes of Health (7R01HG005119-02). J.Y. is supported by U.S. Department of Defense (PC080665) and National Institutes of Health (5R00CA129565); S.V. is supported by National Institutes of Health (R01CA157845) and Prostate Cancer SPORE Career Development award.
Footnotes
Author Contributions: Q.C. and A.M.C. designed the experiments. Q.C., R-S.M., B.A., S.M.D., I.A.A., J.R.P., J.H.K., J.C.B., X.J., X.C., R.W., Y.L., A.D., L.W., M.P., Y-M.W., S.A.T., N.P., J.Y. and S.V. performed the experimental work. R.J.L., Z.Q. and C.A.M. performed statistical analysis on miRNA and gene expression data. Q.C. and A.M.C. wrote the paper. All authors discussed the results and commented on the manuscript.
The authors declare no competing financial interests.
Publisher's Disclaimer: This is a PDF file of an unedited manuscript that has been accepted for publication. As a service to our customers we are providing this early version of the manuscript. The manuscript will undergo copyediting, typesetting, and review of the resulting proof before it is published in its final citable form. Please note that during the production process errors may be discovered which could affect the content, and all legal disclaimers that apply to the journal pertain.
References
- Bock C, Reither S, Mikeska T, Paulsen M, Walter J, Lengauer T. BiQ Analyzer: visualization and quality control for DNA methylation data from bisulfite sequencing. Bioinformatics (Oxford, England) 2005;21:4067–4068. doi: 10.1093/bioinformatics/bti652. [DOI] [PubMed] [Google Scholar]
- Bonci D, Coppola V, Musumeci M, Addario A, Giuffrida R, Memeo L, D'Urso L, Pagliuca A, Biffoni M, Labbaye C, et al. The miR-15a-miR-16-1 cluster controls prostate cancer by targeting multiple oncogenic activities. Nature medicine. 2008;14:1271–1277. doi: 10.1038/nm.1880. [DOI] [PubMed] [Google Scholar]
- Bracken AP, Helin K. Polycomb group proteins: navigators of lineage pathways led astray in cancer. Nature reviews. 2009;9:773–784. doi: 10.1038/nrc2736. [DOI] [PubMed] [Google Scholar]
- Bracken AP, Pasini D, Capra M, Prosperini E, Colli E, Helin K. EZH2 is downstream of the pRB-E2F pathway, essential for proliferation and amplified in cancer. The EMBO journal. 2003;22:5323–5335. doi: 10.1093/emboj/cdg542. [DOI] [PMC free article] [PubMed] [Google Scholar]
- Cao P, Deng Z, Wan M, Huang W, Cramer SD, Xu J, Lei M, Sui G. MicroRNA-101 negatively regulates Ezh2 and its expression is modulated by androgen receptor and HIF-1alpha/HIF-1beta. Molecular cancer. 2010;9:108. doi: 10.1186/1476-4598-9-108. [DOI] [PMC free article] [PubMed] [Google Scholar]
- Cao Q, Yu J, Dhanasekaran SM, Kim JH, Mani RS, Tomlins SA, Mehra R, Laxman B, Cao X, Yu J, et al. Repression of E-cadherin by the polycomb group protein EZH2 in cancer. Oncogene. 2008;27:7274–7284. doi: 10.1038/onc.2008.333. [DOI] [PMC free article] [PubMed] [Google Scholar]
- Cao R, Tsukada Y, Zhang Y. Role of Bmi-1 and Ring1A in H2A ubiquitylation and Hox gene silencing. Molecular cell. 2005;20:845–854. doi: 10.1016/j.molcel.2005.12.002. [DOI] [PubMed] [Google Scholar]
- Cao R, Wang L, Wang H, Xia L, Erdjument-Bromage H, Tempst P, Jones RS, Zhang Y. Role of histone H3 lysine 27 methylation in Polycomb-group silencing. Science (New York, NY. 2002;298:1039–1043. doi: 10.1126/science.1076997. [DOI] [PubMed] [Google Scholar]
- Chen H, Tu SW, Hsieh JT. Down-regulation of human DAB2IP gene expression mediated by polycomb Ezh2 complex and histone deacetylase in prostate cancer. The Journal of biological chemistry. 2005;280:22437–22444. doi: 10.1074/jbc.M501379200. [DOI] [PubMed] [Google Scholar]
- Chiang CW, Huang Y, Leong KW, Chen LC, Chen HC, Chen SJ, Chou CK. PKCalpha mediated induction of miR-101 in human hepatoma HepG2 cells. Journal of biomedical science. 2010;17:35. doi: 10.1186/1423-0127-17-35. [DOI] [PMC free article] [PubMed] [Google Scholar]
- Dontu G, Abdallah WM, Foley JM, Jackson KW, Clarke MF, Kawamura MJ, Wicha MS. In vitro propagation and transcriptional profiling of human mammary stem/progenitor cells. Genes & development. 2003;17:1253–1270. doi: 10.1101/gad.1061803. [DOI] [PMC free article] [PubMed] [Google Scholar]
- Ezhkova E, Pasolli HA, Parker JS, Stokes N, Su IH, Hannon G, Tarakhovsky A, Fuchs E. Ezh2 orchestrates gene expression for the stepwise differentiation of tissue-specific stem cells. Cell. 2009;136:1122–1135. doi: 10.1016/j.cell.2008.12.043. [DOI] [PMC free article] [PubMed] [Google Scholar]
- Faber J, Gregory RI, Armstrong SA. Linking miRNA regulation to BCR-ABL expression: the next dimension. Cancer cell. 2008;13:467–469. doi: 10.1016/j.ccr.2008.05.013. [DOI] [PubMed] [Google Scholar]
- Fasano CA, Dimos JT, Ivanova NB, Lowry N, Lemischka IR, Temple S. shRNA knockdown of Bmi-1 reveals a critical role for p21-Rb pathway in NSC self-renewal during development. Cell stem cell. 2007;1:87–99. doi: 10.1016/j.stem.2007.04.001. [DOI] [PubMed] [Google Scholar]
- Friedman JM, Liang G, Liu CC, Wolff EM, Tsai YC, Ye W, Zhou X, Jones PA. The putative tumor suppressor microRNA-101 modulates the cancer epigenome by repressing the polycomb group protein EZH2. Cancer research. 2009;69:2623–2629. doi: 10.1158/0008-5472.CAN-08-3114. [DOI] [PubMed] [Google Scholar]
- Fujii S, Ito K, Ito Y, Ochiai A. Enhancer of zeste homologue 2 (EZH2) down-regulates RUNX3 by increasing histone H3 methylation. The Journal of biological chemistry. 2008;283:17324–17332. doi: 10.1074/jbc.M800224200. [DOI] [PMC free article] [PubMed] [Google Scholar]
- Galmozzi E, Facchetti F, La Porta CA. Cancer stem cells and therapeutic perspectives. Current medicinal chemistry. 2006;13:603–607. doi: 10.2174/092986706776055661. [DOI] [PubMed] [Google Scholar]
- Garzon R, Marcucci G, Croce CM. Targeting microRNAs in cancer: rationale, strategies and challenges. Nat Rev Drug Discov. 2010;9:775–789. doi: 10.1038/nrd3179. [DOI] [PMC free article] [PubMed] [Google Scholar]
- Glinsky GV, Berezovska O, Glinskii AB. Microarray analysis identifies a death-from-cancer signature predicting therapy failure in patients with multiple types of cancer. The Journal of clinical investigation. 2005;115:1503–1521. doi: 10.1172/JCI23412. [DOI] [PMC free article] [PubMed] [Google Scholar]
- Gupta RA, Shah N, Wang KC, Kim J, Horlings HM, Wong DJ, Tsai MC, Hung T, Argani P, Rinn JL, et al. Long non-coding RNA HOTAIR reprograms chromatin state to promote cancer metastasis. Nature. 2010;464:1071–1076. doi: 10.1038/nature08975. [DOI] [PMC free article] [PubMed] [Google Scholar]
- Hurt EM, Kawasaki BT, Klarmann GJ, Thomas SB, Farrar WL. CD44+ CD24(-) prostate cells are early cancer progenitor/stem cells that provide a model for patients with poor prognosis. British journal of cancer. 2008;98:756–765. doi: 10.1038/sj.bjc.6604242. [DOI] [PMC free article] [PubMed] [Google Scholar]
- Iliopoulos D, Lindahl-Allen M, Polytarchou C, Hirsch HA, Tsichlis PN, Struhl K. Loss of miR-200 inhibition of Suz12 leads to polycomb-mediated repression required for the formation and maintenance of cancer stem cells. Molecular cell. 2010;39:761–772. doi: 10.1016/j.molcel.2010.08.013. [DOI] [PMC free article] [PubMed] [Google Scholar]
- Jacobs JJ, Kieboom K, Marino S, DePinho RA, van Lohuizen M. The oncogene and Polycomb-group gene bmi-1 regulates cell proliferation and senescence through the ink4a locus. Nature. 1999a;397:164–168. doi: 10.1038/16476. [DOI] [PubMed] [Google Scholar]
- Jacobs JJ, Scheijen B, Voncken JW, Kieboom K, Berns A, van Lohuizen M. Bmi-1 collaborates with c-Myc in tumorigenesis by inhibiting c-Myc-induced apoptosis via INK4a/ARF. Genes & development. 1999b;13:2678–2690. doi: 10.1101/gad.13.20.2678. [DOI] [PMC free article] [PubMed] [Google Scholar]
- Johnson SM, Grosshans H, Shingara J, Byrom M, Jarvis R, Cheng A, Labourier E, Reinert KL, Brown D, Slack FJ. RAS is regulated by the let-7 microRNA family. Cell. 2005;120:635–647. doi: 10.1016/j.cell.2005.01.014. [DOI] [PubMed] [Google Scholar]
- Kaneko S, Li G, Son J, Xu CF, Margueron R, Neubert TA, Reinberg D. Phosphorylation of the PRC2 component Ezh2 is cell cycle-regulated and up-regulates its binding to ncRNA. Genes & development. 2010;24:2615–2620. doi: 10.1101/gad.1983810. [DOI] [PMC free article] [PubMed] [Google Scholar]
- Kleer CG, Cao Q, Varambally S, Shen R, Ota I, Tomlins SA, Ghosh D, Sewalt RG, Otte AP, Hayes DF, et al. EZH2 is a marker of aggressive breast cancer and promotes neoplastic transformation of breast epithelial cells. Proceedings of the National Academy of Sciences of the United States of America. 2003;100:11606–11611. doi: 10.1073/pnas.1933744100. [DOI] [PMC free article] [PubMed] [Google Scholar]
- Krutzfeldt J, Rajewsky N, Braich R, Rajeev KG, Tuschl T, Manoharan M, Stoffel M. Silencing of microRNAs in vivo with ‘antagomirs’. Nature. 2005;438:685–689. doi: 10.1038/nature04303. [DOI] [PubMed] [Google Scholar]
- Lawson DA, Xin L, Lukacs RU, Cheng D, Witte ON. Isolation and functional characterization of murine prostate stem cells. Proceedings of the National Academy of Sciences of the United States of America. 2007;104:181–186. doi: 10.1073/pnas.0609684104. [DOI] [PMC free article] [PubMed] [Google Scholar]
- Li LC, Dahiya R. MethPrimer: designing primers for methylation PCRs. Bioinformatics (Oxford, England) 2002;18:1427–1431. doi: 10.1093/bioinformatics/18.11.1427. [DOI] [PubMed] [Google Scholar]
- Lu J, He ML, Wang L, Chen Y, Liu X, Dong Q, Chen YC, Peng Y, Yao KT, Kung HF, Li XP. MiR-26a Inhibits Cell Growth and Tumorigenesis of Nasopharyngeal Carcinoma through Repression of EZH2. Cancer research. 2011;71:225–233. doi: 10.1158/0008-5472.CAN-10-1850. [DOI] [PubMed] [Google Scholar]
- Lukacs RU, Memarzadeh S, Wu H, Witte ON. Bmi-1 Is a Crucial Regulator of Prostate Stem Cell Self-Renewal and Malignant Transformation. Cell stem cell. 2010;7:682–693. doi: 10.1016/j.stem.2010.11.013. [DOI] [PMC free article] [PubMed] [Google Scholar]
- Margueron R, Reinberg D. The Polycomb complex PRC2 and its mark in life. Nature. 2011;469:343–349. doi: 10.1038/nature09784. [DOI] [PMC free article] [PubMed] [Google Scholar]
- Matsukawa Y, Semba S, Kato H, Ito A, Yanagihara K, Yokozaki H. Expression of the enhancer of zeste homolog 2 is correlated with poor prognosis in human gastric cancer. Cancer science. 2006;97:484–491. doi: 10.1111/j.1349-7006.2006.00203.x. [DOI] [PMC free article] [PubMed] [Google Scholar]
- Min J, Zaslavsky A, Fedele G, McLaughlin SK, Reczek EE, De Raedt T, Guney I, Strochlic DE, Macconaill LE, Beroukhim R, et al. An oncogene-tumor suppressor cascade drives metastatic prostate cancer by coordinately activating Ras and nuclear factor-kappaB. Nature medicine. 2010;16:286–294. doi: 10.1038/nm.2100. [DOI] [PMC free article] [PubMed] [Google Scholar]
- Palanisamy N, Ateeq B, Kalyana-Sundaram S, Pflueger D, Ramnarayanan K, Shankar S, Han B, Cao Q, Cao X, Suleman K, et al. Rearrangements of the RAF kinase pathway in prostate cancer, gastric cancer and melanoma. Nature medicine. 2010;16:793–798. doi: 10.1038/nm.2166. [DOI] [PMC free article] [PubMed] [Google Scholar]
- Park SM, Gaur AB, Lengyel E, Peter ME. The miR-200 family determines the epithelial phenotype of cancer cells by targeting the E-cadherin repressors ZEB1 and ZEB2. Genes & development. 2008;22:894–907. doi: 10.1101/gad.1640608. [DOI] [PMC free article] [PubMed] [Google Scholar]
- Pereira CF, Piccolo FM, Tsubouchi T, Sauer S, Ryan NK, Bruno L, Landeira D, Santos J, Banito A, Gil J, et al. ESCs require PRC2 to direct the successful reprogramming of differentiated cells toward pluripotency. Cell stem cell. 2010;6:547–556. doi: 10.1016/j.stem.2010.04.013. [DOI] [PubMed] [Google Scholar]
- Pietersen AM, Evers B, Prasad AA, Tanger E, Cornelissen-Steijger P, Jonkers J, van Lohuizen M. Bmi1 regulates stem cells and proliferation and differentiation of committed cells in mammary epithelium. Curr Biol. 2008;18:1094–1099. doi: 10.1016/j.cub.2008.06.070. [DOI] [PubMed] [Google Scholar]
- Poliseno L, Salmena L, Riccardi L, Fornari A, Song MS, Hobbs RM, Sportoletti P, Varmeh S, Egia A, Fedele G, et al. Identification of the miR-106b∼25 microRNA cluster as a proto-oncogenic PTEN-targeting intron that cooperates with its host gene MCM7 in transformation. Science signaling. 2010;3:ra29. doi: 10.1126/scisignal.2000594. [DOI] [PMC free article] [PubMed] [Google Scholar]
- Rinn JL, Kertesz M, Wang JK, Squazzo SL, Xu X, Brugmann SA, Goodnough LH, Helms JA, Farnham PJ, Segal E, Chang HY. Functional demarcation of active and silent chromatin domains in human HOX loci by noncoding RNAs. Cell. 2007;129:1311–1323. doi: 10.1016/j.cell.2007.05.022. [DOI] [PMC free article] [PubMed] [Google Scholar]
- Sanchez-Beato M, Sanchez E, Gonzalez-Carrero J, Morente M, Diez A, Sanchez-Verde L, Martin MC, Cigudosa JC, Vidal M, Piris MA. Variability in the expression of polycomb proteins in different normal and tumoral tissues. A pilot study using tissue microarrays. Mod Pathol. 2006;19:684–694. doi: 10.1038/modpathol.3800577. [DOI] [PubMed] [Google Scholar]
- Shimono Y, Zabala M, Cho RW, Lobo N, Dalerba P, Qian D, Diehn M, Liu H, Panula SP, Chiao E, et al. Downregulation of miRNA-200c links breast cancer stem cells with normal stem cells. Cell. 2009;138:592–603. doi: 10.1016/j.cell.2009.07.011. [DOI] [PMC free article] [PubMed] [Google Scholar]
- Sudo T, Utsunomiya T, Mimori K, Nagahara H, Ogawa K, Inoue H, Wakiyama S, Fujita H, Shirouzu K, Mori M. Clinicopathological significance of EZH2 mRNA expression in patients with hepatocellular carcinoma. British journal of cancer. 2005;92:1754–1758. doi: 10.1038/sj.bjc.6602531. [DOI] [PMC free article] [PubMed] [Google Scholar]
- Surface LE, Thornton SR, Boyer LA. Polycomb group proteins set the stage for early lineage commitment. Cell stem cell. 2010;7:288–298. doi: 10.1016/j.stem.2010.08.004. [DOI] [PubMed] [Google Scholar]
- Tan J, Yang X, Zhuang L, Jiang X, Chen W, Lee PL, Karuturi RK, Tan PB, Liu ET, Yu Q. Pharmacologic disruption of Polycomb-repressive complex 2-mediated gene repression selectively induces apoptosis in cancer cells. Genes & development. 2007;21:1050–1063. doi: 10.1101/gad.1524107. [DOI] [PMC free article] [PubMed] [Google Scholar]
- Tomlins SA, Laxman B, Dhanasekaran SM, Helgeson BE, Cao X, Morris DS, Menon A, Jing X, Cao Q, Han B, et al. Distinct classes of chromosomal rearrangements create oncogenic ETS gene fusions in prostate cancer. Nature. 2007a;448:595–599. doi: 10.1038/nature06024. [DOI] [PubMed] [Google Scholar]
- Tomlins SA, Mehra R, Rhodes DR, Cao X, Wang L, Dhanasekaran SM, Kalyana-Sundaram S, Wei JT, Rubin MA, Pienta KJ, et al. Integrative molecular concept modeling of prostate cancer progression. Nature genetics. 2007b;39:41–51. doi: 10.1038/ng1935. [DOI] [PubMed] [Google Scholar]
- Tomlins SA, Rhodes DR, Perner S, Dhanasekaran SM, Mehra R, Sun XW, Varambally S, Cao X, Tchinda J, Kuefer R, et al. Recurrent fusion of TMPRSS2 and ETS transcription factor genes in prostate cancer. Science (New York, NY. 2005;310:644–648. doi: 10.1126/science.1117679. [DOI] [PubMed] [Google Scholar]
- Valk-Lingbeek ME, Bruggeman SW, van Lohuizen M. Stem cells and cancer; the polycomb connection. Cell. 2004;118:409–418. doi: 10.1016/j.cell.2004.08.005. [DOI] [PubMed] [Google Scholar]
- Varambally S, Cao Q, Mani RS, Shankar S, Wang X, Ateeq B, Laxman B, Cao X, Jing X, Ramnarayanan K, et al. Genomic loss of microRNA-101 leads to overexpression of histone methyltransferase EZH2 in cancer. Science (New York, NY. 2008;322:1695–1699. doi: 10.1126/science.1165395. [DOI] [PMC free article] [PubMed] [Google Scholar]
- Varambally S, Dhanasekaran SM, Zhou M, Barrette TR, Kumar-Sinha C, Sanda MG, Ghosh D, Pienta KJ, Sewalt RG, Otte AP, et al. The polycomb group protein EZH2 is involved in progression of prostate cancer. Nature. 2002;419:624–629. doi: 10.1038/nature01075. [DOI] [PubMed] [Google Scholar]
- Varambally S, Yu J, Laxman B, Rhodes DR, Mehra R, Tomlins SA, Shah RB, Chandran U, Monzon FA, Becich MJ, et al. Integrative genomic and proteomic analysis of prostate cancer reveals signatures of metastatic progression. Cancer cell. 2005;8:393–406. doi: 10.1016/j.ccr.2005.10.001. [DOI] [PubMed] [Google Scholar]
- Vire E, Brenner C, Deplus R, Blanchon L, Fraga M, Didelot C, Morey L, Van Eynde A, Bernard D, Vanderwinden JM, et al. The Polycomb group protein EZH2 directly controls DNA methylation. Nature. 2006;439:871–874. doi: 10.1038/nature04431. [DOI] [PubMed] [Google Scholar]
- Wang H, Wang L, Erdjument-Bromage H, Vidal M, Tempst P, Jones RS, Zhang Y. Role of histone H2A ubiquitination in Polycomb silencing. Nature. 2004;431:873–878. doi: 10.1038/nature02985. [DOI] [PubMed] [Google Scholar]
- Wang HJ, Ruan HJ, He XJ, Ma YY, Jiang XT, Xia YJ, Ye ZY, Tao HQ. MicroRNA-101 is down-regulated in gastric cancer and involved in cell migration and invasion. Eur J Cancer. 2010;46:2295–2303. doi: 10.1016/j.ejca.2010.05.012. [DOI] [PubMed] [Google Scholar]
- Wang XS, Shanka S, Dhanasekaran SM, Ateeq B, Sasaki AT, Jing X, Robinson D, Cao Q, Prensner JR, Yocum AK, et al. Characterization of KRAS Rearrangements in Metastatic Prostate Cancer. Cancer Discovery. 2011;1 doi: 10.1158/2159-8274.CD-10-0022. [DOI] [PMC free article] [PubMed] [Google Scholar]
- Wellner U, Schubert J, Burk UC, Schmalhofer O, Zhu F, Sonntag A, Waldvogel B, Vannier C, Darling D, zur Hausen A, et al. The EMT-activator ZEB1 promotes tumorigenicity by repressing stemness-inhibiting microRNAs. Nature cell biology. 2009;11:1487–1495. doi: 10.1038/ncb1998. [DOI] [PubMed] [Google Scholar]
- Wong CF, Tellam RL. MicroRNA-26a targets the histone methyltransferase Enhancer of Zeste homolog 2 during myogenesis. The Journal of biological chemistry. 2008;283:9836–9843. doi: 10.1074/jbc.M709614200. [DOI] [PubMed] [Google Scholar]
- Yi R, Poy MN, Stoffel M, Fuchs E. A skin microRNA promotes differentiation by repressing ‘stemness’. Nature. 2008;452:225–229. doi: 10.1038/nature06642. [DOI] [PMC free article] [PubMed] [Google Scholar]
- Yu F, Yao H, Zhu P, Zhang X, Pan Q, Gong C, Huang Y, Hu X, Su F, Lieberman J, Song E. let-7 regulates self renewal and tumorigenicity of breast cancer cells. Cell. 2007a;131:1109–1123. doi: 10.1016/j.cell.2007.10.054. [DOI] [PubMed] [Google Scholar]
- Yu J, Cao Q, Mehra R, Laxman B, Yu J, Tomlins SA, Creighton CJ, Dhanasekaran SM, Shen R, Chen G, et al. Integrative genomics analysis reveals silencing of beta-adrenergic signaling by polycomb in prostate cancer. Cancer cell. 2007b;12:419–431. doi: 10.1016/j.ccr.2007.10.016. [DOI] [PubMed] [Google Scholar]
- Yu J, Cao Q, Yu J, Wu L, Dallol A, Li J, Chen G, Grasso C, Cao X, Lonigro RJ, et al. The neuronal repellent SLIT2 is a target for repression by EZH2 in prostate cancer. Oncogene. 2010 doi: 10.1038/onc.2010.269. [DOI] [PMC free article] [PubMed] [Google Scholar]
- Yu J, Yu J, Rhodes DR, Tomlins SA, Cao X, Chen G, Mehra R, Wang X, Ghosh D, Shah RB, et al. A polycomb repression signature in metastatic prostate cancer predicts cancer outcome. Cancer research. 2007c;67:10657–10663. doi: 10.1158/0008-5472.CAN-07-2498. [DOI] [PubMed] [Google Scholar]
Associated Data
This section collects any data citations, data availability statements, or supplementary materials included in this article.