

INTRODUCTION
The current study examines the long-term language outcomes of high school students who received a cochlear implant (CI) between 2 and 5 years of age and have more than 10 years of CI experience. The language of these teenagers was previously assessed in their preferred communication mode when they were in early elementary grades (Geers, Nicholas, & Sedey, 2003). At the ages of 8 and 9 years, over half of this sample scored within expectation relative to age-mates with normal hearing on expressive language measures such as utterance length, lexical diversity and narrative structure and on verbal reasoning as measured by the Similarities subtest of the Wechsler Intelligence Scale for Children (WISC-III) (Wechsler, 1991). However, fewer than half of the sample achieved within one standard deviation of hearing age-mates on syntactic measures such as the Index of Productive Syntax: IPSyn (Scarborough, 1990) or the Test for Auditory Comprehension of Language-Revised: TACL-R (Carrow, 1985). Factors predictive of better language skill included higher performance intelligence quotients (PIQ) on the WISC-III, smaller family size, higher family socioeconomic status (SES) and female gender. After these predictors were statistically controlled, children with an early educational emphasis on auditory-oral communication exhibited significantly higher English language outcomes than those whose early education included sign communication. The current investigation examines language skills in 112 of these students in high school (CI-HS) to determine the extent to which the earlier results were maintained throughout the school years.
Language Development in CI Children
One consequence of hearing loss early in life is a slower rate of spoken language development relative to hearing children. CIs and the consequent improvement in auditory perception associated with their use result in an increase in the rate at which children with prelingual profound deafness acquire language, from less than half the normal rate in children using only hearing-aids (HA) to between 60% and 100% of the normal rate for children using CIs, depending on the study quoted (Blamey, 2003; Niparko et al., 2010). Among children who use CIs, several factors contribute to language development rate. For example, younger age at implantation (below 24 months) is associated with an increased language rate, even after equivalent durations of CI use. Early educational intervention also positively affects language development following cochlear implantation, especially when occurring at one and two years of age (Moog, Geers, & Brenner, 2010).
A recent study summarized language results for 153 five-and six-year-olds from across North America who used a CI for more than a year and received early spoken language intervention (Geers, Moog, Biedenstein, Brenner, & Hayes, 2009). Over half of the CI children exhibited age-appropriate vocabulary scores by kindergarten. However, fewer children (29–47%) caught up with hearing age-mates in syntax, morphology and other connected language skills, suggesting some areas of language are more difficult for CI children to master than others. Assuming the 5 and 6 year olds reported in this study started out with a language delay before receiving a CI, those who were on par with hearing age-mates progressed at a faster rate than age-equivalent hearing children to close the language gap by kindergarten. Presumably, the shorter the period of auditory deprivation, the smaller the language gap to overcome. In fact, for all language tests administered, kindergarteners who received a CI at younger ages (i.e., one and two years) obtained higher language scores than those implanted at older ages (three and four years) relative to hearing age-mates (Geers et al., 2009).
This study addresses how the rate of language development changes over a long time period. Do children with CIs whose language is delayed at 8 and 9 years of age eventually close the gap with hearing age-mates? Does a slower than normal rate continue so that the gap relative to hearing age-mates widens as they grow older? The current study examines language outcomes of a large sample of adolescents who received a CI in preschool. By comparing the extensive data collected from children using CIs during the early elementary grades with a complete battery of measures collected from these same students in high school, we document the extent to which their language kept pace with normal development and identify factors associated with successful language outcomes.
It was anticipated that the percentage of children achieving language scores commensurate with typically-developing hearing age-mates would decrease between elementary grades and high school because of fundamental differences between early and later language learning (Nippold, 1988). While the primary source of language stimulation in early years is spoken (and/or signed) communication, written communication has an additional impact on later language learning, and reading may play an important role in developing age-appropriate vocabulary and discourse skills in high school. Students with prelingual severe-profound sensorineural hearing loss (SNHL) typically exhibit substantial delays in reading throughout their academic years (Traxler, 2000). These delays may further impair acquisition of new language and vocabulary from print. In addition, typically-developing children acquire facility with language from conversational interactions and incidental learning not fully accessible to children with CIs (Nevins & Chute, 2009).
Increased language delay also may be associated with differences in the types of language skills measured at primary and secondary grades. At young ages, language is concrete and literal, and language test items are designed to assess these skills. As cognitive skills develop, adolescents demonstrate increasing ability to appreciate figurative meanings and employ abstract reasoning processes, and these skills become the focus of age-appropriate language assessment (Larson & McKinley, 1995). Adolescents are more aware of listeners’ and readers’ needs and adjust their spoken and written messages accordingly. These skills may be more difficult to acquire with a compromised auditory system in which speech perception is degraded, particularly in challenging listening conditions such as occurs with softer intensities and in noisy backgrounds (Davidson, Geers, Blamey, & Tobey, 2010).
Communication Mode and Language in CI Users
Current study participants were recruited to include approximately equal representation of Simultaneous Communication (SC) and Oral Communication (OC) early intervention approaches (Geers & Brenner, 2003). It has been argued that children whose families use SC before receiving a CI have a base from which to build language. Thus, young children using SC succeed in developing some language skills and understand key communication concepts when they begin learning spoken language after receiving a CI. Language levels achieved by young children following cochlear implantation are related to levels exhibited prior to obtaining a CI (Connor & Zwolan, 2004). When a child lacks language at 4 years of age, spoken language development, even with a CI, remains a slow process (Ambrose, Hammes-Ganguly, & Lehnert, 2009). During later years of CI use, children who use SC in school with support from sign language interpreters may benefit more from classroom discourse given that they have access to multiple modes of communication (Marschark, Rhoten, & Fabich, 2007). A recent study of mainstreamed children with CIs who used SC have been reported to score within one standard deviation of normal hearing age-mates on Concepts and Directions, a receptive subtest of the Clinical Evaluation of Language Fundamentals (CELF) (Semel-Mintz, Wiig, & Secord, 2003). However, the same group’s average score on an expressive subtest, Formulated Sentences, was below the average range relative to age-matched hearing peers (Spencer, Barker, & Tomblin, 2003).
On the other hand, some studies have shown that children who receive an early consistent emphasis on auditory and speech skill development without use of signs (OC) exhibit an advantage over SC users in spoken language development (Kirk, Miyamoto, Ying, Perdew, & Zuganelis, 2003; Svirsky, Robbins, Kirk, Pisoni, & Miyamoto, 2000). A recent study of 118 children with moderate-profound hearing loss identified by 30 months of age who used either HAs or CIs included 44 children exposed to sign language from a young age (Nittrouer, 2010). Signing had no effect on spoken language growth for children with early-identified SNHL. However, signing children with late-identified SNHL exhibited a slower rate of language growth compared to late-identified, non-signing children. Nittrouer (2010) suggests that the greater the risk for language delay, the more signing may interfere with English language growth. Results obtained from 181 students (including participants in the current investigation when they were 8 and 9 years old) found CI children whose educational program emphasized speech and auditory skill development during the first five years of CI use not only exhibited better English language than those in SC settings when they were assessed in a speech-only mode, but also achieved higher language scores when both spoken and signed responses were considered together (Geers et al., 2003). The English language advantage for children with early OC educational emphasis was significant even after other contributing variables, including performance intelligence (PIQ), family socio-economic status, age at implant, parent participation in therapy, type of classroom and amount of individual therapy were controlled in the analysis.
The current investigation reassessed communication mode in 112 of these students as adolescents. Following a group of students from elementary to high school is important because it is often unclear whether children who begin their language learning using a SC philosophy continue to utilize this modality in later years. Mode of communication may change multiple times in a child’s life. It is possible for a child to start out utilizing a signed language as a primary modality for communication during the preschool years, using more and more voice as spoken language skills mature, finally reaching a point in the middle school years where sign is used only for receptive purposes during school lectures (Spencer & Tomblin, 2006). Thus, it is difficult to draw conclusions from cross-sectional studies on the impact of mode of communication and educational placement on the language development of children with CIs (Ambrose et al., 2009). Specifying the extent to which children use spoken language or sign language as they progress through the academic grades is beneficial in determining how the link between language modality and achievement interacts with other variables and sample characteristics (Marschark et al., 2007).
Cognitive Skills Underlying Language Development
Individual differences in language skills with use of a CI also may be associated with “higher level” processing skills. Once the contributions of child, family and speech perception characteristics are identified, additional sources of variance in language outcome may be explained by more central cognitive factors. Substantial information processing takes place beyond the auditory periphery for spoken language understanding to occur. Explanatory research studies, including our own previous work with this sample at ages 8–9, have focused not only on what CI users hear, but also what they are able to do with the sensory information they receive. In particular, studies of working memory and speaking rate in children with CIs provide new insight into the basic elementary information processing skills that underlie speech and language performance (Pisoni & Geers, 2000; Cleary, Pisoni, & Geers, 2001; Pisoni & Cleary, 2003). Results of these studies suggest working memory capacity (as measured by a digit span task) and verbal rehearsal speed (as measured by speaking rate) may both be unique sources of variability in language skills measured following cochlear implantation. The continued contribution of these underlying process measures to language skills in adolescence is examined in the current investigation.
Aims of the Current Study
The aims of this follow-up investigation include: 1) documenting English language skills of adolescents with more than 10 years of CI experience and determining the proportion exhibiting language skills commensurate with typically developing hearing age-mates, 2) comparing English language skills achieved in the high school years with those achieved by elementary school years, 3) identifying participant characteristics associated with language achievement levels; 4) estimating the influence of communication mode on English language outcomes and 5) evaluating the contribution of cognitive processing skills, as measured by memory capacity and speaking rate, to English language outcomes.
METHODS
Participants
All participants and their families signed consent and assent forms approved by the Institutional Review Board of the University of Texas at Dallas. Characteristics of the 112 participants are described in detail at the beginning of this monograph (Geers, Brenner, & Tobey, 2010) and are briefly summarized here. Participants were 8; 0 (8 years, 0 months) to 9; 11 years old at the first language assessment (CI-E) and 15; 0 to 18; 6 years old at their second assessment (CI-HS). Grade placement of the CI-HS group ranged from 9th to 12th grades, with the majority of the participants enrolled in 10th and 11th grades. Fifty-three participants were boys and 59 were girls. Education level of the highest educated parent in their families averaged 16 years (SD = 2.4) and family size averaged 4 persons (SD = 1). WISC PIQ averaged 103 (SD = 16). Aided sound-field detection thresholds were obtained from the CI-HS group using frequency modulated (FM) tones at octave frequencies from 250–4000 Hz. The group average aided threshold across these five frequencies was 30 dB HL (SD = 9.6). Children selected to participate in the study at age 8 or 9 years were reported to have no educationally significant diagnosed disabilities in addition to deafness.
Thirty of the CI-HS students (27%) reported using sign daily at school and/or at home. Fifty-two students (46%) sometimes used sign with deaf friends or others who sign. Thirty students (27%) reported that they seldom or never used signs. Within the context of this study, use of sign to enhance spoken communication was measured at both the CI-E and CI-HS test sessions. Procedures for calculating sign enhancement are described in detail at the beginning of this monograph (Geers et al., 2010) and are summarized here. Measures from two separate language samples collected under OC and SC conditions were used to estimate sign enhancement at the CI-E test session. Word-for-word transcriptions of speech (OC) and speech plus sign (SC) language samples were analyzed for each child and the following dependent variables were obtained: 1) number of words per utterance; 2) number of different words per minute; 3) Index of Productive Syntax (IPSyn) (Scarborough, 1990) Noun Phrase Score; 4) IPSyn Sentence Complexity Score. Ratios were calculated between the measures from the SC sample to those from the OC sample. Values less than 1.0 indicated greater lexical diversity and syntactic complexity in the SC sample.
The sign enhancement estimate for the CI-HS group was based on the standard score difference on the Peabody Picture Vocabulary Test (PPVT) (Dunn & Markwardt, 1989), Form A administered in OC and Form B administered in SC. Values greater than 0 indicate higher receptive vocabulary standard scores (SS) in the SC than in the OC test condition. This estimate of sign enhancement corresponded with the reports of frequency of SC use in high school. The mean PPVT (SC-OC) difference score for the 30 CI-HS students who reported daily SC was 8.9 SS points. The 52 adolescents reporting occasional SC exhibited a mean PPVT difference of 5 points, and 30 students reporting no SC had an average PPVT difference of 0.7 SS points.
Language Assessments
A battery of language and verbal reasoning tests was administered to the teenagers by examiners (speech-language pathologist, school psychologist or teacher of the deaf) with proficiency in SC or OC. Sign language proficiency of each of the examiners was verified by an interpreter who has been signing for over 35 years. All language tests were administered in individual sessions in either the student’s preferred communication mode or in SC (whether or not the student knew sign). Responses were counted regardless of whether the student responded in speech or sign. Including sign along with speech even for orally-educated students controlled for any advantages derived from iconicity of signed items. In addition, providing both speech and sign to all students who reported knowing sign language allowed us to obtain an optimal estimate of English language knowledge in these students. None of the students reported using American Sign Language (ASL) as their preferred communication mode and none of the tests assessed ASL skills. Therefore, all scores reflect English language ability, but not necessarily spoken English exclusively.
Wechsler Intelligence Scale for Children Verbal Scale (WISC-V) (Wechsler, 1991)
These subtests require both receptive and expressive language, as well as verbal reasoning skills. All items were presented on printed cards and administered in the student’s preferred communication mode (SC or OC). Responses were accepted in the student’s preferred mode and scored based on standardized criteria. Raw scores were converted to standard scores based on the age-appropriate typically-developing normative sample (TD-NS) in which the mean was 10 and the standard deviation was 3. Scores of 7 or higher were considered within the average range for the normative sample of hearing age-mates. The Verbal Intelligence Quotient (VIQ) is a composite of the 3 verbal subtests with a TD-NS mean of 100 (SD = 15).
Information: These questions tap knowledge acquired from experience and education, remote verbal memory, understanding and associative thinking e.g. “On what continent is Argentina?” While this subtest was administered to all 112 at the CI-HS session, it was only given to 91 participants at the CI-E session due to scheduling constraints.
Similarities: These questions require abstract and concrete reasoning, logical thought processes, vocabulary knowledge and associative thinking ( e.g.,” In what way are happiness and sadness alike?”). This subtest was administered to all 112 students at both CI-E and CI-HS sessions.
Comprehension: These questions measure social judgment and common sense reasoning based on past experience. Items are often thought to measure practical intelligence (e.g., “Why do we put stamps on letters?”). This subtest was administered only to the CI-HS group.
Clinical Evaluation of Language Fundamentals- 4th Edition CELF-4 (Semel-Mintz et al., 2003)
This global language measure contains both receptive and expressive language tasks that tap semantic, syntactic and discourse skills. Responses were accepted in the student’s preferred mode and scored based on standardized criteria. Raw scores were converted to standard scores based on an age-appropriate normative sample in which the mean was 10 and the standard deviation was 3. Scores of 7 or higher were considered within the average range for the NS-TD. Scores on three of the subtests (Word Definitions, Understanding Spoken Paragraphs and Sentence Assembly) were combined to form the Language Content Index with a NS-TD mean of 100 (SD = 15).
Word Definitions
These items measure vocabulary knowledge, learning ability and verbal information acquired from experience and education. Individual words (e.g., mustard) were presented in print and SC, and then the examiner used the word in a sentence (e.g., Mom asked, “Would you like mustard on your hot dog?”).
Understanding Spoken Paragraphs
Three paragraphs designed for 15 to 21 year olds were read to the student by an examiner using SC. Each paragraph was followed by questions requiring comprehension and recall of factual details and the ability to make inferences from known information (e.g.,”What is this announcement about?” or “How many screens do you think the new theatre has?”)
Sentence Assembly
Students were presented with groups of words printed on a page (e.g., the chair/ on/ the kitten / is) that could be rearranged to form more than one grammatically correct sentence. The student was required to order the word groupings into two different sentences in order to receive credit for each item (e.g., Is the kitten on the chair? The kitten is on the chair.). This task measures the ability to assemble syntactic structures into grammatically and semantically meaningful sentences. Items were presented in print and the student responded by pointing to the word groupings in order while producing each sentence.
Semantic Relationships
Students were presented with a list of four printed words or phrases (e.g., a. house; b. button; c. spoon; d. plane) and were asked to pick the two correct answers to a question (e.g., A man is bigger than a _____). This subtest measures comprehension of comparatives; spatial, passive, and temporal relationships.
Peabody Picture Vocabulary Test PPVT (Dunn & Markwardt, 1989)
This is a wide-ranging individually-administered test of receptive vocabulary in which the examiner provides a label and the student selects one of four pictures that best represents the label. Form IIIA was administered by presenting the stimulus words in OC only. Form IIIB was administered using SC. Two adults who were native signers were consulted to determine how the items should be signed in the SC administration. For words that were produced differently in American Sign Language (ASL) and an English-based sign system, both versions of the sign were presented. In cases where both adults indicated there was no ASL sign for an item, the word was fingerspelled.
Expressive One-Word Picture Vocabulary Test EOWPVT (Gardner, 2000)
This is a wide-ranging individually administered test of expressive vocabulary in which the student labels pictures in his/her preferred communication mode.
Cognitive Measures
Unlike the tests described above that comprised the language battery, the following two cognitive measures were administered in a speech-only (OC) communication mode.
Memory Span
Digit span was used to estimate short-term information processing/storage capacity at both the CI-E and CI-HS sessions. Administration was according to the Wechsler Intelligence Scale for Children (WISC) III (Wechsler, 1991) test procedures. The forward digit span task requires the students to repeat a list of digits spoken live-voice by an experimenter at a rate of approximately one digit per second. Backward digit span requires the student to repeat the series of digits in reverse. The face of the clinician was visible to the student but SC was not used. The lists began with two digits and were increased in length on successful repetition until a student got two lists incorrect at a given length, at which point the testing stopped. Performance on this task at the CI-E and CI-HS sessions is summarized in detail elsewhere in this monograph (Pisoni, Kronenberger, Roman, & Geers, 2010). Principal components analysis was used to combine the scores from the digit span task that loaded on a single factor: longest forward series correct, total forward spans correct (out of 2 possible at each length), total raw score (forward spans plus backward spans) and WISC scaled score (total raw score converted to scaled score based on the age-appropriate normative sample). Principal component loadings for scores obtained at the CI-E and CI-HS test sessions are summarized in Table 1.
Table 1.
Principal components loadings for Digit Span(DS) composite score
| CI-E | CI-HS | |
|---|---|---|
| Digits forward raw score | .96 | .95 |
| WISC DS scaled score | .95 | .94 |
| Total DS raw score | .94 | .93 |
| Longest forward span | .89 | .81 |
Verbal Rehearsal Speed
This variable was estimated by the average duration of each student’s production of the twelve 7-syllable McGarr sentences (McGarr, 1983). Sentence imitations were recorded and durations measured using procedures described in detail elsewhere in this monograph (Tobey, Geers, Sundarrajan, & Lane, 2010). Mean sentence duration at CI-E was 3295 msec (SD = 1195) and at CI-HS was 2035 msec (SD = 468).
RESULTS
Comparisons with Typically-Developing Age Mates
Table 2 summarizes the mean and SD of language test scores obtained by the CI-HS students with the percentage of CI-HS students scoring within or above one standard deviation of the normative samples of NS-TD. It is important to point out that in a normal distribution, 84% of the population is expected to achieve scores in this range.
Table 2.
Mean languageoutcomes
| Test | Cochlear implant (CI-HS) | Normal hearingNS-TDb | |||
|---|---|---|---|---|---|
| Mean | SD | % WNLa | Mean | SD | |
| Wechsler Intelligence Scale (WISC) | |||||
| VIQ | 91.3 | 15.1 | 71% | 100 | 15 |
| Comprehension | 6.8 | 3.0 | 65 | 10 | 3 |
| Information | 9.3 | 3.1 | 86 | 10 | 3 |
| Similarities | 9.4 | 3.2 | 81 | 10 | 3 |
| Difference PIQ-VIQ | 11.8 | 17.1 | 46 | 0 | 15 |
| Clinical Evaluation of Language Fundamentals(CELF) | |||||
| Language Content Index | 92.1 | 18.9 | 68% | 100 | 15 |
| Word Definitions | 9.4 | 4.3 | 76 | 10 | 3 |
| Semantic Relations | 8.4 | 3.3 | 73 | 10 | 3 |
| Sentence Assembly | 9.1 | 3.7 | 74 | 10 | 3 |
| Understanding Paragraphs | 7.6 | 3.1 | 69 | 10 | 3 |
| Peabody Picture Vocabulary Test (PPVT) | |||||
| Speech only (OC) | 90.3 | 22.6 | 66% | 100 | 15 |
| Speech + sign (SC) | 93.4 | 17.1 | 71% | 100 | 15 |
| Expressive One-Word Picture Vocabulary Test (EOWPVT) | |||||
| Total standard score | 91.4 | 12.3 | 74% | 100 | 15 |
WNL Within or above 1SD of normal hearing age-matescompared tothe normative sample of typically developing childrenin the test manual.
NS-TD Normative sample of typically developing age-mates
WISC-VIQ (Wechsler, 1991)
Seventy-one percent of the teenagers obtained VIQs within or above one SD of age-mates in the NS-TD sample (i.e., they obtained a VIQ ≥85). Subtest mean scaled scores were within 1 SD of the NS-TD sample (Mean = 10; SD = 3) on two of the three verbal subtests. The Comprehension subtest resulted in the poorest performance, with an average scaled score of 6.8, slightly more than 1 SD below average.
The mean VIQ of 91.3 was almost 10 points below the expected mean of 100 for age-mates in the normative sample and was 11.8 points below the CI-HS participants’ mean PIQ reported earlier in this monograph (Geers et al., 2010). Figure 1 compares each student’s VIQ to their PIQ. A gap between VIQ and PIQ is characteristic of students with prelingual, profound SNHL because their nonverbal learning ability (PIQ) typically exceeds their verbal achievement (VIQ) (Geers & Moog, 1989). However, 46% of these long-term CI users achieved a VIQ within one SD (± 15 IQ points) of their PIQ or greater, including 10 students who achieved a VIQ score that exceeded their PIQ by more than 15 points.
Fig. 1.
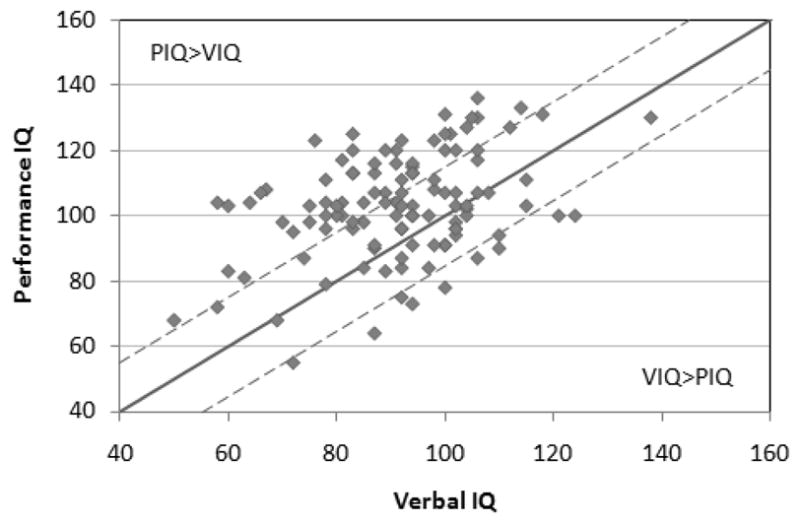
Performance IQs are plotted against verbal IQs on the Wechsler Intelligence Scale for Children (WISC-III; Wechsler 1991) for 112 adolescent CI users. The expected mean based on the WISC-III normative sample (PIQ = VIQ) is indicated by the solid line, with dashed lines representing ±1 SD from this mean.
Two of the verbal subtests of the WISC-III also were administered at the CI-E test session. Ninety-one of the students were administered the Information subtest at age 8–9 and all 112 were administered the Similarities subtest. Significant increases were observed for both scales over time. The mean Information scaled score increased from 6.7 (SD = 3.9) at CI-E to 9.3 (SD = 3.1 at CI-HS [F (1, 90) = 52.9, p <.0001] and the Similarities scaled score increased from 7.6 (SD= 3.5) at CI-E to 9.4 (SD = 3.2) at CI-HS [F (1,111) = 38.9, p<.0001]. These increases in scaled scores, expressed in relation to typically developing age-mates, indicate growth in verbal reasoning skills that exceeded expected change from elementary grades to high school (i.e., more than one year’s growth in a year). The percentage of subjects scoring within expectation for age also increased over time. Similarities increased from 64% to 81% and Information increased from 49% to 86%.
CELF-4 (Semel-Mintz et al., 2003)
Sixty-eight percent of the sample achieved a Language Content Index within or above 1 standard deviation of NS-TD age-mates. The most challenging subtest was Understanding Spoken Paragraphs (Mean scaled score = 7.6) in which the examiner presented connected discourse and then asked questions requiring recalling factual information presented in the text and making inferences from the text.
PPVT (Dunn & Markwardt, 1989)
The mean receptive vocabulary score on a standard OC administration of the PPVT Form A was 90.3, within 1 standard deviation of the NS-TD mean of 100 (SD=15). When the stimulus words were only spoken, 66% of the sample scored at or above the −1 SD cut off of 85. When Form B was administered in SC, with sign or finger spelling accompanying each spoken item, the mean standard score was 93 and 71% of the sample scored within or above 1 standard deviation of the age-appropriate NS-TD group. A comparison of scores in the two modality conditions is summarized elsewhere (Geers et al., 2010). For all further analyses reported here, the best score was used, whether it was obtained in OC or SC modalities.
EOWPVT (Gardner, 2000)
The mean expressive vocabulary standard score was 91.4 (within one SD of NS-TD) and 74% of the sample scored within or above the average range for their age.
Predicting Language Outcomes
Principal components analysis (PCA) was used to provide a summary score to represent language outcome. Then, this summary score was examined using hierarchical multiple linear regression analysis in which sets of selected predictors were entered in stages (Strube, 2003).
Table 3 contains the inter-correlation matrix summarizing the relations among the language measures. All coefficients were significant at p <.001. The relatively high correlation coefficients obtained among the measures suggests that these language tests all tap similar skills. Since it is the commonality among these measures that is of interest, they were reduced to a single standardized score by creating a weighted linear combination of the original variables using PCA. Aggregating multiple scales produces more reliable composites that increase the power of the statistical analysis. The language measures (followed by factor loadings) formed a single principal component (PC) and were combined into a single score: PPVT (.94), EOWPVT (.93), VIQ (.92) and CELF (.90). Together these measures accounted for 85% of the variance in the Language Outcome PC score.
Table 3.
Inter-correlations among language scores
| WISC | WISC | WISC | WISC | CELF | CELF | CELF | CELF | CELF | PPVT | EOWPT | |
|---|---|---|---|---|---|---|---|---|---|---|---|
| VIQ | Comp | Info | Similar | LCI | WdD | SenAss | USP | SRel | |||
| WISC VIQ | 1.00 | ||||||||||
| WISC Comp | .84 | 1.00 | |||||||||
| WISC Info | .86 | .62 | 1.00 | ||||||||
| WISC Similar | .86 | .59 | .69 | 1.00 | |||||||
| CELF LCI | .78 | .70 | .66 | .72 | 1.00 | ||||||
| CELF WordDef | .82 | .72 | .70 | .71 | .91 | 1.00 | |||||
| CELF Sent | .54 | .47 | .44 | .55 | .80 | .59 | 1.00 | ||||
| CELF USp Par | .61 | .58 | .51 | .56 | .82 | .69 | .43 | 1.00 | |||
| CELF SemRel | .65 | .55 | .52 | .63 | .77 | .69 | .65 | .61 | 1.00 | ||
| PPVT | .82 | .66 | .73 | .72 | .78 | .87 | .46 | .62 | .64 | 1.00 | |
| EOWPVT | .81 | .63 | .73 | .73 | .77 | .82 | .51 | .60 | .60 | .85 | 1.00 |
Note: All coefficients are significant at p <.001
A similar procedure was used to derive a PC score for language measures from the CI-E test session. This score was comprised of early language measures (Geers et al., 2003) with the following PC loadings: three measures were derived from the better of two language samples, whether OC or TC: number of different words/minute (.93), number of words per utterance (.90), and IPSyn (.87). In addition, standard scores were included from the WISC Similarities (.82) and TACL (.84). Together, these measures accounted for 77% of the variance in the CI-E language factor.
Once the battery of CI-E and CI-HS language tests had been reduced to two PC scores, the next stage of the analysis examined the role of child and family characteristics, sign enhancement, verbal rehearsal speed, digit span and early language ability in predicting language outcomes in high school. The contribution of these variables was examined in stages, allowing the systematic identification of unique proportions of variance in language outcome associated with particular predictors. Two multiple regression analyses were conducted. The first analysis considered the contribution of early predictors (collected at the CI-E session) to language outcome in high school (Table 4). The second analysis considered how student characteristics at the CI-HS session were related to current CI-HS language outcome (Table 5).
Table 4.
Predicting CI-HS LanguageScores from Early(CI-E) Measures
| Predictor | Step 1 | Step 2 | Step 3 | |||||||||
|---|---|---|---|---|---|---|---|---|---|---|---|---|
| β | t | p | R2 | β | t | p | R2 | β | t | p | R2 | |
| Gender | −0.089 | 1,053 | 0.292 | −0.177 | 2.608 | 0.009 | −0.189 | 3.474 | 0.001 | |||
| Performance IQ | 0.234 | 2.714 | 0.007 | 0.132 | 1.888 | 0.059 | 0.136 | 2.448 | 0.014 | |||
| Family Size | −0.030 | 0.341 | 0.733 | 0.111 | 1.506 | 0.132 | 0.146 | 2.495 | 0.013 | |||
| SES | 0.288 | 3.130 | 0.002 | 0.158 | 2.101 | 0.036 | 0.123 | 2.056 | 0.040 | |||
| Duration of Deafness | −0.230 | 2.704 | 0.007 | −0.169 | 2.494 | 0.013 | −0.111 | 2.034 | 0.042 | |||
| Sign Enhancement | 0.116 | 1.294 | 0.196 | −0.079 | 1.058 | 0.290 | −0.181 | 2.977 | 0.003 | |||
| Digit Span | −0.064 | 0.753 | 0.452 | −0.124 | 1.812 | 0.070 | ||||||
| Sentence Duration | −0.675 | 7.336 | <0.001 | −0.211 | 2.227 | 0.026 | ||||||
| Language CI-E | 0.708 | 7.719 | <0.001 | |||||||||
| Explained Variance | 0.254 | 0.293 | 0.168 | |||||||||
| Total Explained Variance | 0.254 | 0.547 | 0.715 | |||||||||
Table 5.
Predicting CI-HS Language Scores from Late (CI-HS) Measures
| Predictor | Step 1 | Step 2 | Step 3 | |||||||||
|---|---|---|---|---|---|---|---|---|---|---|---|---|
| β | t | p | R2 | β | t | p | R2 | β | t | p | R2 | |
| Gender | .018 | .216 | .829 | −.044 | −.589 | .556 | −.100 | −1.701 | .089 | |||
| Performance IQ | .285 | 3.364 | .001 | .245 | 3.228 | .001 | .242 | 4.083 | <.001 | |||
| Family Size | .029 | .337 | .736 | .060 | .780 | .435 | .058 | .978 | .328 | |||
| SES | .135 | 1.525 | .127 | .102 | 1.277 | .202 | .097 | 1.555 | .120 | |||
| Duration of Deafness | −.179 | −2.183 | .029 | −.116 | −1.578 | .114 | −.085 | −1.481 | .139 | |||
| Sign Enhancement | −.345 | −4.185 | <.001 | −.172 | −2.080 | .037 | .015 | .225 | .822 | |||
| Aided Threshold Average | −.007 | −.085 | .932 | −.049 | −.818 | .413 | ||||||
| Digit Span | .261 | 3.265 | .001 | .095 | 1.438 | .150 | ||||||
| Sentence Duration | −.266 | −3.116 | .002 | .009 | .121 | .904 | ||||||
| Language CI-E | .665 | 8.111 | <.001 | |||||||||
| Explained Variance | .344 | .153 | .199 | |||||||||
| Total Explained Variance | .344 | .497 | .696 | |||||||||
Predicting CI-HS Language from CI-E Sample Characteristics
This analysis allowed us to ask how characteristics of CI children in early elementary grades predicted their language level in high school. Table 4 details the multiple linear regression analyses used to predict the amount of variance in CI-HS language PC score associated with variables measured at CI-E. In the first step of the analysis, gender, duration of deafness prior to implantation, PIQ, family size, family SES and the sign enhancement ratio obtained at the CI-E test session accounted for 25% of the variance in CI-HS language level. Significant independent predictors included duration of deafness prior to implantation, PIQ and family SES. Children who received their CI shortly after birth (or shortly after onset of profound SNHL), those children with higher nonverbal intelligence and those children from families with higher education and income levels demonstrated the best language outcomes in high school. The second step of the analysis added the cognitive predictors, digit span and sentence duration, accounting for 29% of additional variance in CI-HS language score. Only sentence duration, as measured by the average rate of producing 7-syllable sentences at the CI-E test session, predicted significant independent variance in language level achieved in high school. In a final step, with variance associated with all of the preceding variables controlled, the language PC score obtained at the CI-E test session was examined and found to predict 17% of additional independent variance in CI-HS language PC scores. Language competence in elementary grades remains an important predictor of language skills in high school. Together, the predictor variables examined from the CI-E test session accounted for 71% of the variance in CI-HS language scores.
A number of early variables contributed significant variance to CI-HS language outcome in all three steps of the analysis. Children from higher SES families who received their cochlear implant at a young age (or shortly following onset of deafness) and those with the highest PIQs, shortest sentence durations and best language performance in early elementary grades exhibited the best language outcomes in high school. Gender emerged as a significant predictor when sentence duration was added in step 2 of the analysis; girls did better than boys. Family size and sign enhancement did not emerge as significant predictors until the influence of early language scores was entered in step 3.
Predicting CI-HS Language from CI-HS Sample Characteristics
Table 5 details results of multiple linear regression analyses to identify current predictors of variance in the language score estimated at CI-HS. In this analysis, the predictor variables PIQ, family size, family SES, sign enhancement, aided threshold average, digit span, and sentence duration are based on measures made at the CI-HS test session. PIQ score was a significant independent predictor of HS language at Step 1 and remained significant as more variables were added. In addition, students who received their CI at the youngest ages (or shortly after onset of profound deafness) and those whose vocabulary score was not improved with the addition of sign (i.e., smallest difference in PPVT scores at SC and OC administrations) demonstrated the highest language scores at CI-HS. Together with PIQ, these factors explained 34% of the variance in CI-HS language level. At step 2 of the analysis, digit span and sentence duration from the CI-HS test session predicted significant variance in CI-HS language outcome. Students who recalled longer digit sequences and those with shorter sentence durations scored the highest in language. These variables explained 15% of additional variance in CI-HS language score and combined with PIQ and sign enhancement to explain 50% of total variance. In the third step of the analysis, Language PC score from the CI-E test session was a highly significant predictor accounting for an additional 20% in the overall variance. This indicates that students who demonstrated more advanced language skills during their elementary years continue to demonstrate relatively higher language abilities when they get to high school. When all CI-HS predictors were combined 70% of variance in CI-HS language score was predicted.
DISCUSSION
This large sample of teenagers who used a CI for more than 10 years provide an optimistic outlook on the language benefits of early implantation. Seventy-one percent of the teenagers obtained WISC-III VIQ scores within or above one SD of age-mates in the NS-TD sample. These students were, indeed, closing the gap between VIQ and PIQ that has characterized profoundly deaf students for generations. When high school scores on individual WISC-III verbal subtests were compared with scores obtained on the same subtests in early elementary grades, the students’ skill development over time was even greater than would be expected of age-mates with normal hearing scoring at comparable levels at the initial evaluation. The percentage of CI subjects scoring within expectation for age increased from 64% to 81% on the Similarities subtest and from 49% to 86% on the Information subtest. Similar positive results were observed on the CELF where 68% of the CI-HS sample achieved a Language Content Index score within or above 1 SD of the mean for NS-TD age-mates, on the PPVT where 71% of the sample achieved this level (66% in the OC administration) and on the EOWPVT where 74% of the sample achieved in the normal range. These observations represent a dramatic improvement over performance on the TACL-R in early elementary grades, where only 30% of the CI-E sample achieved language scores within or above a SD of typically developing age mates (Geers et al., 2003). Still, the results of this study indicate that CI teenagers continue to perform closer to hearing age-mates on single word vocabulary, isolated sentence comprehension and factual information questions than they do on connected discourse and abstract reasoning tasks. This discrepancy may have an impact on their ultimate achievement at the secondary and college levels.
Factors from both early and late test sessions that contributed to successful CI-HS language outcomes include shorter duration of profound deafness prior to implantation (roughly corresponding to younger age at CI), higher nonverbal intelligence and faster verbal rehearsal speed (reflected in shorter sentence durations). These results suggest the advantage provided to children with the shortest period of auditory deprivation before receiving a CI (i.e., younger age at implant) is long-lasting and continues to influence the level of language skill exhibited 10 to 15 years later. Moreover, its influence is independent of non-verbal IQ, family SES and communication mode. This result provides strong support for implanting children at very young ages or as soon as possible following the onset of deafness. In addition, children with faster sentence repetition speeds at both the CI-E and CI-HS test sessions achieve better language outcomes by high school. The significant contribution of digit span scores at the CI-HS test session further supports the importance of speed and efficiency of phonological processing as explanatory constructs underlying the development of language throughout childhood (Pisoni et al., 2010).
The contribution of sign enhancement to language outcome in high school differed based on the type of estimate entered into the model and the time at which the estimate was obtained. Sign enhancement was measured with the same test administered in both SC and OC modes in order to estimate the amount of benefit participants received from the addition of sign over results obtained using speech alone. The CI-E estimate was based on a comparison of language measures obtained from two language samples, one using only spoken language and the other using simultaneous speech and sign. Students with early sign enhancement exhibited higher CI-HS language scores after variance due to CI-E language was controlled. This means that signing children made greater language gains between the CI-E and CI-HS test sessions. This is not a surprising result, since in the previous investigation it was established that children enrolled in preschool programs with an emphasis on speech and auditory skill development (OC) exhibited better English language skills in elementary grades than those from programs that emphasized SC (Geers et al., 2003). Therefore, children with the greatest sign enhancement had more room for improvement between elementary grades and high school and some of these children caught up in their use of language during the interval between CI-E and CI-HS testing. However, when the effects of sign enhancement were examined at the CI-HS session, the students who showed little or no benefit from SC on the PPVT tended to achieve higher language scores. Although sign enhancement was related to the students’ use of sign in school, not all students who previously or currently used SC in their educational settings exhibited sign enhancement at the CI-HS test session. For some of these students, comprehension of spoken vocabulary paralleled their understanding of words when signs were added. However, for those students who continued to rely on sign in their teenage years to demonstrate their maximum language ability, overall English language outcomes tended to be lower.
Participants volunteered for this study and although all who qualified were included, their use of a CI and their decision to apply for the study was not random. Therefore we must consider the impact of sample selection bias on these results. One way we dealt with this problem was to include as many contributing background characteristics as possible in the multiple regression analyses (e.g., PIQ, family SES, gender, duration of CI use). Even so, we can never be 100% certain that all possible sources of selection bias were controlled. It is likely, therefore, that the current CI-HS sample does not represent the entire population of children receiving CIs.
The first source of bias may have occurred in the group of 184 eight and nine year olds whose families chose to participate in the original study. These families were among the first in North America to seek out cochlear implantation when their children were very young and thus were highly motivated to participate in intervention. In addition, these families spoke only English at home and children with additional significant disabilities were not included in the sample at age 8–9. Furthermore, the mean parental education and income level was higher than the average for the general American population.
Further selection bias may characterize the 112 students who returned for follow-up testing. These follow-up participants outperformed the 72 students who did not return for follow-up on some outcome measures at CI-E (Geers et al., 2010). Although the current sample exhibits the expected distribution of average and below-average PIQ scores, along with similar socioeconomic characteristics to those children who did not return for follow-up testing, the CI-HS participants may be advantaged in some respects. It is possible, for example, that families who felt their children were performing reasonably well would be more likely to return for follow-up testing. Some of the families who declined to participate may have done so because their child was either no longer using the cochlear implant or they did not achieve the level of outcomes with the device that the family had hoped. These sample selection factors may have resulted in our overestimating language outcomes to be expected for adolescents with long-term use of CIs.
On the other hand, these results may underestimate the positive effects of early cochlear implantation on language achievement in current CI users. The CI-HS students who participated in this study received their device more than 10 years ago and did not have some of the advantages available to more recently implanted children. Advances in implant technology along with revised candidate selection guidelines that include children under 2 years of age and those with significant amounts of pre-implant residual hearing have been associated with higher performance levels in more recently implanted children (Nicholas & Geers, 2007). As the current population of CI children with these advantages reaches adolescence, even more of them may exhibit age-appropriate language skills.
Acknowledgments
These studies were supported by Grant RO1 DC000581 from the National Institute of Deafness and Other Communication Disorders. Statistical analyses were completed by Michael J. Strube, PhD.
Reference List
- Ambrose S, Hammes-Ganguly D, Lehnert K. The speech-language specialist on the pediatric cochlear implant team. In: Eisenberg LS, editor. Clinical Management of Children with Cochlear Implants. San Diego: Plural Publishing; 2009. pp. 251–324. [Google Scholar]
- Blamey P. Development of spoken language by deaf children. In: Marschark M, Spencer PE, editors. Deaf Studies, Language and Education. New York: Oxford University Press; 2003. pp. 232–246. [Google Scholar]
- Carrow E. Test for auditory comprehension of language-revised. Allen, TX: DLM Teaching Resources; 1985. (revised ed.) [Google Scholar]
- Cleary M, Pisoni DB, Geers AE. Some measures of verbal and spatial working memory in eight- and nine-year-old hearing-impaired children with cochlear implants. Ear Hear. 2001;22:395–411. doi: 10.1097/00003446-200110000-00004. [DOI] [PMC free article] [PubMed] [Google Scholar]
- Connor C, Zwolan T. Examining multiple sources of influence on the reading comprehension skills of children who use cochlear implants. Journal of Speech, Language and Hearing Research. 2004;43:1185–1204. doi: 10.1044/1092-4388(2004/040). [DOI] [PubMed] [Google Scholar]
- Davidson L, Geers A, Blamey P, Tobey E. Factors contributing to speech perception scores in long-term pediatric CI users. Ear and Hearing. 2010 doi: 10.1097/AUD.0b013e3181ffdb8b. [DOI] [PMC free article] [PubMed] [Google Scholar]
- Dunn L, Markwardt FC. Peabody Individual Achievement Test. Circle Pines, MN: American Guidance; 1989. [Google Scholar]
- Gardner M. Expressive One-Word Picture Vocabulary Test. Novato, CA: Academic Therapy Publications; 2000. [Google Scholar]
- Geers A, Brenner C, Tobey E. Long-term outcomes of cochlear implantation in early childhood: Sample characteristics and data collection methods. Ear and Hearing. 2010 doi: 10.1097/AUD.0b013e3182014c53. [DOI] [PubMed] [Google Scholar]
- Geers A, Brenner C. Background and educational characteristics of prelingually deaf children implanted by five years of age. Ear and Hearing. 2003;24:2S–14S. doi: 10.1097/01.AUD.0000051685.19171.BD. [DOI] [PubMed] [Google Scholar]
- Geers A, Moog J, Biedenstein J, Brenner C, Hayes H. Spoken language scores of children using cochlear implants compared to hearing age-mates at school entry. The Journal of Deaf Studies and Deaf Education. 2009:371–385. doi: 10.1093/deafed/enn046. [DOI] [PubMed] [Google Scholar]
- Geers A, Moog JS. Factors predictive of the development of literacy in hearing-impaired adolescents. Volta Review. 1989;91:69–86. [Google Scholar]
- Geers AE, Nicholas JG, Sedey AL. Language skills of children with early cochlear implantation. Ear Hear. 2003;24:46S–58S. doi: 10.1097/01.AUD.0000051689.57380.1B. [DOI] [PubMed] [Google Scholar]
- Kirk K, Miyamoto R, Ying E, Perdew A, Zuganelis H. Cochlear implantation in young children: Effects of age at implantation and communication mode. The Volta Review. 2003;102:127–144. [Google Scholar]
- Larson V, McKinley N. Language Disorders in Older Students: Preadolescents and Adolescents. Eau Claire, WI: Thinking Publications; 1995. [Google Scholar]
- Marschark M, Rhoten C, Fabich M. Effects of cochlear implants on children’s reading and academic achievement. J Deaf Stud Deaf Educ. 2007;12:269–282. doi: 10.1093/deafed/enm013. [DOI] [PubMed] [Google Scholar]
- McGarr N. The intelligibility of deaf speech to experienced and inexperienced listeners. Journal of Speech, Language and Hearing Research. 1983;26:451–458. doi: 10.1044/jshr.2603.451. [DOI] [PubMed] [Google Scholar]
- Moog J, Geers A, Brenner C. Early educational placement and later language outcomes for children with cochlear implants. Otology and Neurotology. doi: 10.1097/MAO.0b013e3181eb3226. (in press) [DOI] [PubMed] [Google Scholar]
- Nevins M, Chute P. Educational consideration: from listening to literacy. In: Eisenberg L, editor. Clinical Management of Children with Cochlear Implants. San Diego: Plural Publishing; 2009. pp. 495–512. [Google Scholar]
- Nicholas J, Geers A. Will They Catch Up? The Role of Age at Cochlear Implantation In the Spoken Language Development of Children with Severe-Profound Hearing Loss. Journal of Speech, Language and Hearing Research. 2007;50:1048–1062. doi: 10.1044/1092-4388(2007/073). [DOI] [PMC free article] [PubMed] [Google Scholar]
- Niparko J, Tobey E, Thal D, Eisenberg L, Wang N, Quittner A, et al. Spoken language development in children following cochlear implantation. Journal of the American Medical Association. 2010;303:1498–1506. doi: 10.1001/jama.2010.451. [DOI] [PMC free article] [PubMed] [Google Scholar]
- Nippold M. Linguistic Ambiguity. In: Nippold M, editor. Later language development: Ages nine to nineteen. Boston: Little, Brown and Company; 1988. pp. 211–224. [Google Scholar]
- Nittrouer S. Early Development of Children with Hearing Loss. San Diego: Plural Publishing; 2010. [Google Scholar]
- Pisoni D, Kronenberger W, Roman A, Geers A. Measures of digit span and verbal rehearsal speed in deaf children following more than 10 years of cochlear implant use. Ear and Hearing. doi: 10.1097/AUD.0b013e3181ffd58e. (in press) [DOI] [PMC free article] [PubMed] [Google Scholar]
- Pisoni D, Cleary M. Measures of working memory span and verbal rehearsal speed in deaf children after cochlear implantation. Ear and Hearing. 2003;24(Supplement):106–120. doi: 10.1097/01.AUD.0000051692.05140.8E. [DOI] [PMC free article] [PubMed] [Google Scholar]
- Pisoni D, Geers A. Working memory in deaf children with cochlear implants: correlations between digit span and measures of spoken language processing. American Annals of Otology Rhinology and Laryngology Supplement. 2000;185:92–93. doi: 10.1177/0003489400109s1240. [DOI] [PMC free article] [PubMed] [Google Scholar]
- Scarborough H. Index of productive syntax. Applied Psycholinguistics. 1990;11:1–22. [Google Scholar]
- Semel-Mintz E, Wiig E, Secord W. Clinical Evaluation of Language Fundamentals. 4. San Antonio: Psychological Corporation; 2003. [Google Scholar]
- Spencer L, Barker BA, Tomblin B. Exploring the language and literacy outcomes of pediatric cochlear implant users. Ear and Hearing. 2003;24:236–247. doi: 10.1097/01.AUD.0000069231.72244.94. [DOI] [PMC free article] [PubMed] [Google Scholar]
- Spencer L, Tomblin B. Speech production and spoken language development of children using “total communication”. In: Spencer P, Marschark M, editors. Advances in the Sjpoken Language Development of Deaf and Hard-of Hearing Children. Oxford, NY: Oxford Univeristy Press; 2006. [Google Scholar]
- Strube M. Statistical analysis and interpretation in a study of prelingually deaf children implanted before five years of age. Ear and Hearing. 2003;24:15S–23S. doi: 10.1097/01.AUD.0000051686.02809.18. [DOI] [PubMed] [Google Scholar]
- Svirsky MA, Robbins AM, Kirk KI, Pisoni DB, Miyamoto RT. Language development in profoundly deaf children with cochlear implants. Psychol Sci. 2000;11:153–158. doi: 10.1111/1467-9280.00231. [DOI] [PMC free article] [PubMed] [Google Scholar]
- Tobey E, Geers A, Sundarrajan M, Lane J. Factors influencing speech intelligibility in elementary and high school aged cochlear implant users. Ear and Hearing. 2010 doi: 10.1097/AUD.0b013e3181fa41bb. [DOI] [PubMed] [Google Scholar]
- Traxler C. Measuring up to performance standards in reading and mathematics: Achievement of selected deaf and hard-of-hearing students in the national norming of the 9th Edition Stanford Achievement Test. Journal of Deaf Studies and Deaf Education. 2000;5:337–348. doi: 10.1093/deafed/5.4.337. [DOI] [PubMed] [Google Scholar]
- Wechsler D. Wechsler Intelligence Scale for Children. 3. San Antonio: Psychological Corporation; 1991. [Google Scholar]