

Abstract
Colony-stimulating factor (CSF)-1 controls the survival, proliferation, and differentiation of macrophages, which are recognized as scavengers and agents of the innate and the acquired immune systems. Because of their plasticity, macrophages are endowed with many other essential roles during development and tissue homeostasis. We present evidence that CSF-1 plays an important trophic role in postnatal organ growth and kidney repair. Notably, the injection of CSF-1 postnatally enhanced kidney weight and volume and was associated with increased numbers of tissue macrophages. Moreover, CSF-1 promotes postnatal renal repair in mice after ischemia-reperfusion injury by recruiting and influencing macrophages toward a reparative state. CSF-1 treatment rapidly accelerated renal repair with tubular epithelial cell replacement, attenuation of interstitial fibrosis, and functional recovery. Analysis of macrophages from CSF-1-treated kidneys showed increased expression of insulin-like growth factor-1 and anti-inflammatory genes that are known CSF-1 targets. Taken together, these data suggest that CSF-1 is important in kidney growth and the promotion of endogenous repair and resolution of inflammatory injury.
Macrophages are versatile cells that have been long recognized as immune effectors where their recruitment to sites of injury is a fundamental feature of inflammation. Although their role in host defense has been well documented, macrophages and their precursors are also important during embryogenesis, normal tissue maintenance, and postnatal organ repair.1,2 Almost all developing organs contain a population of resident monocytes that infiltrate very early during organogenesis and persist throughout adult life.3–6 In addition to their phagocytic capabilities during tissue remodeling-associated apoptosis,5,7 fetal macrophages have many trophic effects that promote tissue and organ growth.6,8,9
Colony-stimulating factor (CSF)-1 controls the differentiation, proliferation, and survival of macrophages by binding to a high-affinity cell-surface tyrosine kinase receptor (CSF-1R), encoded by the c-fms proto-oncogene that is expressed on macrophages and their progenitors.6 CSF-1 is critical for both adult and embryonic macrophage development. This is manifested by multiple organ growth deficiencies observed in osteopetrotic (Csf1op/Csf1op) mice that have a spontaneous mutation in the csf-1 gene. These mice show growth restriction and developmental abnormalities of the bones, brain, and reproductive and endocrine organs,10–13 a phenotype that can be rescued by injection of exogenous CSF-1 or insertion of a csf-1 transgene.14–16
In adult organs, there is considerable heterogeneity of monocytes and macrophages with distinct subsets defined by phenotype, function, and the differential expression of cell surface markers.17–19 Subpopulations of macrophages directly contribute to wound healing and tissue repair, supporting the concept that some macrophage phenotypes can promote organ regeneration after a pro-inflammatory state of injury.20 The concept of macrophage polarization states has emerged; the M1 “classically activated” pro-inflammatory cell type apparently opposed by an M2 “alternatively activated” immune regulatory macrophage.18 In general, these two states are thought to be analogous to the opposing T helper 1 and T helper 2 immune responses, although in both cases this model is probably too simplistic. Functionally, it is more likely that distinct subpopulations of macrophages may exist in the same tissue and play critical roles in both the injury and recovery phases of inflammatory scarring.20
Our previous study provided evidence that the addition of CSF-1 to a developing murine kidney promotes a growth and differentiation response that is accompanied by increased numbers of macrophages.3 Furthermore, with the use of expression profiling we demonstrated that fetal kidney, lung, and brain macrophages share a characteristic gene expression profile that includes the production of factors important in the suppression of inflammation and the promotion of proliferation.3 Embryonic macrophages appear to play a positive trophic role that may have parallel reparative functions in many adult tissues undergoing repair and cellular replacement.1,20 A number of studies have suggested that infiltrating macrophages along with the trophic factors they release participate in tissue repair of the kidney,20–22 brain,23 skin,24,25 lung,26 liver,27 heart,28 gastrointestinal tract,29,30 and skeletal muscle.31,32 Indeed, the pleiotrophic roles for CSF-1 in reproduction, development of multiple organ systems, and maternal-fetal interactions during pregnancy by macrophage-mediated processes have also been well defined.2,33,34
To determine the physiological relevance of CSF-1 as a component of the mammalian growth regulatory axis, CSF-1 was administered to neonatal mice. We report that CSF-1 administration to newborn mice increased body weight and kidney weight and volume and was associated with increased numbers of macrophages. Our results also establish that CSF-1 injection into mice after ischemia-reperfusion (IR) injury promoted endogenous repair with characteristic rapid re-epithelialization of the damaged tubular epithelium, leading to functional recovery. Flow cytometric and gene expression analyses were used to delineate the macrophage profile present in the kidneys during the early and resolution phase of IR injury with and without CSF-1 therapy. We thus provide evidence that CSF-1 recruits macrophages to the reparative site and influences their phenotype, partly through an insulin-like growth factor (IGF)-1 signaling response. Therefore, macrophages under the stimulus of CSF-1 in an acute setting of renal disease markedly accelerate renal cell replacement and tissue remodeling while attenuating downstream interstitial extracellular matrix accumulation.
Materials and Methods
Mice
Csf1r-enhanced green fluorescent protein (EGFP) transgenic or C57BL/6J mice were obtained from Monash University Animal House, Melbourne, Australia. The csf1r-EGFP transgenic mice express EGFP under the control of the CSF-1R (c-fms) promoter and first intron.6 These mice were backcrossed onto the C57BL/6J background for 10 generations. All experiments were approved by the Monash University Animal Ethics Committee, which adheres to the Australian Code of Practice for the Care and Use of Animals for Scientific Purposes.
Newborn Mouse Analysis
Newborn csf1r-EGFP transgenic mice received treatment by i.p. injection at postnatal day (P) 0.5, P1.5, and P2.5. Littermate newborn mice were injected with either mouse recombinant CSF-1 protein (1 μg/g of body weight; Chiron Corporation, Emeryville, CA) or vehicle (PBS). Mice were sacrificed at P30 for unbiased stereologic approaches to estimate kidney and glomerular volumes. The kidneys from csf1r-null mutant mice10 and wild-type kidneys were collected at P19, and the body and organ weights were assessed.
CSF-1 and vehicle-injected littermate pups were sacrificed at P5 to investigate kidney macrophage number. The number of csf1r-EGFP macrophages was quantified from three sections at ×1000 magnification, with a minimum of three medullary and five cortical fields of view per section.
Stereologic Estimation of Total Kidney and Glomerular Volumes
Unbiased estimation was performed on the kidneys from littermate mice injected with CSF-1 and vehicle at P30. Kidneys were immersion fixed in 10% formalin for 48 hours and embedded in Technovit 7100 glycol methacrylate resin (Electron Microscopy Sciences, Hatfield, PA). Tissue was then serial sectioned at 20 μm, and every 10th and 11th sections were collected, beginning at a random number, and stained with periodic acid-Schiff reagent. To determine total kidney volume, every 10th section was viewed on a RF3A microfiche reader (Fugi, Tokyo, Japan) overlaid with a 2 × 2-cm grid at a final magnification of ×24.25. Total volume was calculated with the Cavalieri Principle.35,36 Glomerular volume was estimated with the physical dissector/fractionator principle as previously described37,38 where sections were projected on an unbiased 2 × 2-cm grid at a final magnification of ×298.
Unilateral IR Injury in Adult Mice
Male mice (20 to 25 g) were anesthetized with 2% inhaled isofluorane (Abbott Australasia Pty Ltd, Kurnell, Australia), and IR injury was induced by 40 minutes of left renal artery clamping with a vascular clamp (0.4 to 1.0 mm; S&T Fine Science Tools, Foster City, CA) through a flank incision. After IR injury, mice either received mouse recombinant CSF-1 protein (Chiron Corporation) or vehicle (PBS), starting at 3 days after the induction of injury and continuing daily for 3 consecutive days. A third group of mice served as a sham-operated control group in which the animals were anesthetized, and a flank incision was performed without renal artery clamping.
Functional Assessment
Csf1r-EGFP mice (20 to 25 g) were used for functional assessment and placed in metabolic cages to obtain 24-hour urine samples. Mice underwent bilateral IR injury for 25 minutes on both kidneys by flank incisions. After IR surgery, mice were injected with CSF-1 (Chiron Corporation) or vehicle (PBS) at 3, 4, and 5 days. Twenty-four–hour urinary albumin excretion was measured with a murine-specific albumin ELISA (Exocell Inc., Philadelphia, PA).
Histology and Immunofluorescence Microscopy
For structural analysis, csf1r-EGFP or C57BL/6J mice were perfusion-fixed with 4% paraformaldehyde at 100 mmHg for 10 minutes. Mid-coronal kidney sections were immersion fixed in 4% paraformaldehyde embedded in paraffin wax and sectioned at 5 μm and processed for H&E staining for histopathologic analysis or deparaffinized and rehydrated for quantification of tubular epithelial cell proliferation. For quantification of renal pathology five fields of view per section at a magnification of ×400 were assessed within the outer stripe of the outer medulla (OSOM) of the kidney for proximal tubular damage and protein cast formation in modification to a previously reported method.21 The percentage of renal damage was graded on a scale of 0 to 4.0, with 0 representing normal tubules and no protein casts; 0.5, minor tubular damage and protein cast formation; 1, involvement of <10% of OSOM; 2, involvement of <25% of OSOM; 2.5, involvement of 26% to 50% of OSOM; 3, involvement of 51% to 75% of OSOM; and 4, widespread damage >75% of OSOM.
For proliferating cell nuclear antigen (PCNA) quantification, kidney sections were antigen retrieved in boiling 10 mmol/L sodium citrate buffer, followed by blocking nonspecific binding with the use of the MOM blocking kit (Vector Laboratories, Burlingame, CA). Sections were stained with mouse anti-PCNA primary Ab (1:100; DakoCytomation, Glostrup, Denmark) for 30 minutes, followed by donkey anti-mouse Alexa Fluor 555 (1:1000; Molecular Probes, Eugene, OR) for 30 minutes. PCNA-positive tubular epithelial cells were quantified in five randomly selected fields of view per section at a magnification of ×400 within the OSOM.
For fluorescence visualization of csf1r-EGFP macrophages, after perfusion-fixation of adult and P5 kidneys, tissue was postfixed in 4% paraformaldehyde for 24 hours, transferred to PBS containing 30% sucrose for overnight incubation at 4°C, embedded in OCT (TissueTek, Tokyo, Japan), and stored at −80°C. Frozen sections were cut at 5 μm, washed in PBS, and blocked with 1% bovine serum albumin. For determination of collagen type IV localization, a goat anti-human collagen type IV primary Ab (1:400; Southern Biotech, Birmingham, AL) was added for 1 hour, followed by a chicken anti-goat Alexa Fluor 488 (1:1000; Molecular Probes) for 30 minutes. For macrophage staining, sections were incubated with rat anti-mouse F4/80 (1:100; AbD Serotec, Oxford, UK) for 1 hour, followed by a goat anti-rat Alexa Flour 594 (1:1000; Molecular Probes) for 30 minutes. After staining, sections were counterstained with DAPI (1:10,000; Molecular Probes) and then mounted with Fluorescent Mounting Medium (DakoCytomation). Sections were analyzed with a Provis AX70 fluorescent microscope (Olympus, Tokyo, Japan), and fluorescent images were captured with the F-view II digital camera (Soft Imaging System, Munster, Germany).
Hydroxyproline and SDS-PAGE Analyses of Kidney Collagen Content
Hydroxyproline content was measured from one-half of each kidney (cross-sectioning the same region of cortex, medulla, and papilla for analysis) of sham control and treated adult C57BL/6J mice (20 to 25 g) as previously described.39,40 Hydroxyproline values were then multiplied by a factor of 6.94 to extrapolate collagen content from each sample (because hydroxyproline represents ∼14.4% of the amino acid composition of collagen).41 Collagen concentration was then determined by dividing collagen content as a percentage of the dry weight tissue. The other half of each kidney was digested for the detection of changes in interstitial collagen subtypes by SDS-PAGE analysis.39,40 The pepsin-digested supernatant fluids were then analyzed on 5% (w/v) acrylamide gels with stacking gels of 3.5% (w/v) acrylamide. The α1(I) collagen chains were separated from the α1(III) chains by interrupted electrophoresis with delayed reduction of the disulfide bonds of type III collagen. The gels were stained with 0.1% Coomassie Blue R-250 overnight at 4°C and destained with 30% methanol supplemented with 7% acetic acid.42 Densitometry of the α1(I) and α2(I) chains (representing type I collagen monomers) was then performed with a calibrated imaging densitometer and Quantity-One software version 4.1 (Bio-Rad, Hercules, CA).
Flow Cytometry of the CSF-1 Inflammatory Profile
The left kidneys of neonatal csf1r-EGFP mice at P5 and adult C57BL/6J mice (20 to 25 g) were removed and prepared for single-cell suspensions. Kidneys were placed in cold fluorescent-activated cell sorting (FACS) buffer containing PBS supplemented with 0.2% bovine serum albumin, 0.5 mol/L EDTA, and 0.02% NaAz. Kidneys were finely minced and incubated in HBSS containing 1 mg/mL Collagenase/Dispase (Roche Diagnostics, Indianapolis, IN), 0.1% DNase I (Roche Diagnostics), and 5 mmol/L CaCl2 at 37°C for 30 minutes on a rotating board. Cells were manually digested into a single-cell suspension with a 1000-μL pipette and further incubated for 5 minutes. The cell suspensions were washed in FACS buffer and recovered by centrifugation at 400 g for 5 minutes at 4°C. Cells were filtered through a 40-μm cell strainer (BD Biosciences, North Ryde, Australia), washed, centrifuged, and lysed with red blood cell lysis buffer (8.3 g/L ammonium chloride, pH 7.5). Cells were adjusted to 3 × 10⁶ cells/test in 96-well trays and stained with the following mAb cocktail for 15 minutes at 4°C: CD45-APC Cy7 (clone 30-F11), CD11c-Pacific Blue, (clone N418), mannose receptor (MR) CD206-Alexa Fluor 488 (clone MR5D3; BioLegend, San Diego, CA); CD11b-PE Cy7 (clone M1/70) MHCII/1-A/1-E-PE (Clone M5/114.15.2; BD Biosciences); and F4/80-APC (clone BM8; eBioscence, San Diego, CA). For intracellular MR staining, surface-labeled cells were fixed, permeabilized, and stained for 30 minutes at 4°C with the use of the CytoFix/CytoPerm kit (BD Biosciences) according to the manufacturer's instructions. Cells were washed twice in 1× Perm/Wash buffer (BD Biosciences) and finally resuspended in FACS buffer. Labeled kidney cells were then analyzed with the FACSCanto II (BD Biosciences), and flow cytometric data were analyzed with FlowJo software version 8.8.6 (TreeStar, Palo Alto, CA).
Real-Time Quantitative PCR Gene Expression Analysis
Total RNA was extracted from whole kidneys with the use of the RNeasy Mini Kit (Qiagen, Doncaster, Australia), and kidney macrophages were sorted on the expression of CD45-APC (Clone 30-F11; BD Biosciences) and CD11b-FITC (Clone M1/70; BD Biosciences) and the absence of CD11c-PE (Clone HL3; BD Biosciences) with the use of the RNAqueous-Micro Kit (Ambion, Austin, TX) according to the manufacturer's instructions. RNA samples were reverse transcribed into cDNA with the use of the High Capacity cDNA Reverse Transcription Kit (Applied Biosystems, Foster City, CA). Real-time quantitative PCR (qPCR) of target mRNA expression was performed with the TaqMan Universal PCR Master Mix (Applied Biosystems) and the TaqMan Gene Expression Assays (Applied Biosystems). Reactions were measured on the 7500 Real Time PCR System (Applied Biosystems), and relative quantification PCR analysis was analyzed with the SDS software version 1.3 (Applied Biosystems). The threshold cycle (Ct) values were measured in triplicate and normalized against the endogenous control β-actin to determine the ΔCt value. The ΔCt value of the different treatment groups was standardized against the control group to yield the ΔΔCt for each gene. The relative quantification was then calculated as 2−ΔΔCt and graphed. The primers were as follows: Actb, Mm00607939_s1; Ccl2, Mm00441242_m1; Nos2, Mm00440485_m1; Tnf, Mm00443258_m1; Cxcl2, Mm00436450_m1; Ccl17, Mm00516136_m1; Mrc1, Mm00485148_m1; Msr2, Mm00472833_m1; Arg1, Mm00475988; Igf1, Mm00439561_m1; Wnt7b, Mm01301717_m1; Tgfb1, Mm01178820_m1; Acta2, Mm01546133_m1; and Mmp9, Mm00442991_m1. All primers were purchased from Applied Biosystems.
Microarray and Data Analyses
Microarray experiments were undertaken with the use of Illumina Mouse Ref8 V2 gene expression arrays (San Diego, CA). RNA was extracted from sorted macrophage cells as described above with the use of the RNeasy Micro Kit (Qiagen). Two technical replicates were included to determine whether the RNA extraction and labeling procedure and the hybridization procedure were reproducible. RNA quantity was measured with a Nanodrop ND1000 spectrophotometer (Rockland, DE), quality was determined with a Bioanalyzer 2100 (Agilent, Santa Clara, CA), and an RNA integrity number threshold of >8 was used for all samples. The procedures for amplifying RNA, labeling, hybridization, scanning, and data extraction were performed exactly as outlined previously with the following exception: The quantity of total RNA used in the initial amplification process was 150 ng and the in vitro transcription reaction was incubated for 14 hours.43 All microarray data have been submitted to the ArrayExpress database (http://www.ebi.ac.uk/arrayexpress) under the accession number E-MTAB-557. Data were normalized with the Lumi R/Bioconductor package and Log2 transformed. Samples were grouped on the basis of treatment regime, and genes were filtered on detection score whereby genes had to be detected in ≥75% of the samples in each group. Welch's t-test was applied to determine genes that were significantly different (P < 0.05) between the two groups. The lists of differentially expressed genes were then subjected to pathway analyses within the Ingenuity Pathway Analysis software version 8.8 (Ingenuity Systems, Redwood City, CA).
Cell Culture in Vitro
Bone marrow–derived macrophages (BMMs) were isolated and cultured with an established protocol.44 Cells were initially grown for 24 hours in serum medium with CSF-1 protein (100 ng/mL; Chiron Corporation). Once BMMs were plated, medium was replaced with serum-free medium, and cells were synchronized for 24 hours. BMMs were stimulated with CSF-1 protein (100 ng/mL; Chiron Corporation) in the presence of anti-IGF-1 mAb (3 μg/mL; R&D Systems, Minneapolis, MN) for 72 hours in serum-free medium. Cell proliferation was measured with the 3-(4,5-dimethylthiazol-2-yl)-5-(3-carboxymethoxyphenyl)-2-(4-sulfophenyl)-2H-tetrazolium) (MTS) assay, CellTiter 96 Aqueous One Solution Cell Proliferation Assay (Promega, Madison, WI) according to the manufacturer's instructions.
Statistical Analysis
Statistic analysis was performed with GraphPad Prism software version 5.0 (GraphPad Software Inc., San Diego, CA). A P value < 0.05 was considered statistically significant. All data were expressed as means ± SEMs.
Results
CSF-1 Treatment Increases Body Weight and Kidney Weight
The murine kidney undergoes significant postnatal maturation. CSF-1 increases in the circulation and tissues, including kidney, liver, and lung, in the immediate postnatal period. To determine whether the availability of CSF-1 is limiting in this period and to investigate the role(s) that CSF-1 may play in postnatal renal development, CSF-1 was administered to newborn csf1r-EGFP mice at P0.5, P1.5, and P2.5.45 CSF-1 treatment resulted in a significant 19% increase in body weight at P30 (P = 0.02) compared with littermate vehicle-injected controls (Figure 1A). At day 30, a significant increase in kidney weight (P = 0.04) of 19% was also observed (Figure 1A). Conversely, mice lacking CSF-1 signaling experienced retarded growth. The kidneys from csf1r-null mutant mice were assessed at P19 because of the shortened lifespan of the animals.10 Overall body weight was significantly decreased in knockout compared with wild-type mice of the same age (Figure 1C; 10.53 ± 0.11 versus 8.94 ± 0.06 g; P < 0.0002). Furthermore, csf1r knockout mice had a significant decrease in kidney weight compared with their wild-type counterparts (Figure 1C; 0.078 ± 0.004 versus 0.064 ± 0.003 g; P < 0.05).
Figure 1.
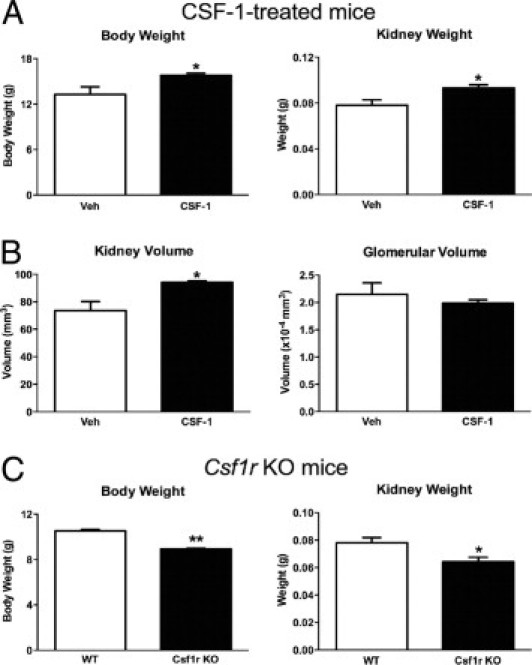
CSF-1 administration to newborn mice increased body and kidney weights and kidney volume, and in comparison csf1r knockout mice exhibit decreased body and kidney weights. A: Mean body and kidney weights of CSF-1 or vehicle control mice at P30, after injection at P0.5, P1.5, and P2.5 (n = 8 per group). CSF-1-treated mice had a 19% increase in body weight (P = 0.02) and a 19% increase in kidney weight (P = 0.04) compared with vehicle-injected controls. B: Unbiased stereologic estimation of kidney and glomerular volumes at P30 after littermates received either CSF-1 or vehicle control (n = 3 per group). Kidney volume was increased by 28% (P = 0.04), whereas no significant change in glomerular volume was observed. C:Csf1r knockout mice had significantly decreased body and kidney weights compared with wild-type animals (n = 3 per group). Body weight was decreased by 15% (P = 0.0002) and kidney weight by 28% (P = 0.048). Data were analyzed with a Student's t-test (unpaired, 2-tailed); *P < 0.05, **P < 0.005. Data are mean ± SEMs. KO, knockout; Veh, vehicle; WT, wild type.
Unbiased stereology was used to estimate kidney and glomerular volumes in CSF-1-injected kidneys compared with littermate control-injected mice to determine whether increased kidney weight was associated with overall renal volume or glomerular changes. At P30 the increase in kidney weight in CSF-1-treated mice correlated with a 28% increase in total kidney volume compared with littermate controls (Figure 1B). This increased volume was not associated with glomerular hypertrophy with no alteration in glomerular volume (Figure 1B). At P5, flow cytometric analysis of kidney macrophages after CSF-1 treatment showed an increase in both cell number (53.5 ± 0.8 versus 67.5 ± 2.2; P = 0.003) and proportion (34,633 ± 3561 versus 46,750 ± 2864; P = 0.04) of CD45+CD11b+CD11c− cells expressing the macrophage marker F4/80 (Figure 2, A–D). Semiquantitative analysis of the number of interstitial csf1r-EGFP cells showed significant increases in both the medulla (157%; P = 0.003) and cortex (42%; P = 0.004; Figure 2, E–H). Furthermore, the csf1r-EGFP cells displayed a more elongated, spindle-like structure and were regularly found to wrap around tubules (Figure 2G).
Figure 2.
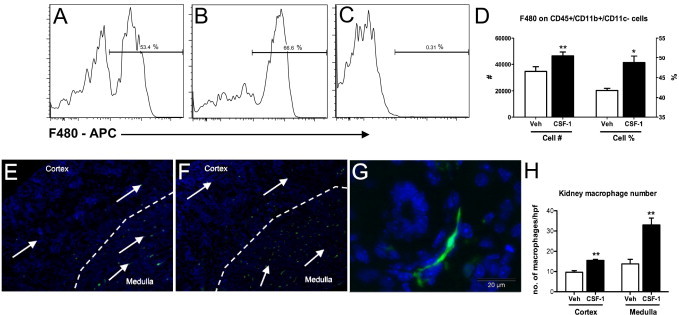
Macrophage infiltration is increased in kidneys at P5 after treatment with CSF-1. A–D: Flow cytometric analysis of whole kidneys indicates CD45+CD11b+CD11c−/F480+ renal macrophages are increased in CSF-1-treated mice at P5. Representative histograms show an increase in CD45+CD11b+CD11c− cells expressing the macrophage marker F4/80 with CSF-1 treatment (B) compared with littermate vehicle-injected controls (A). C: Positive staining was confirmed with appropriate isotype controls. E—G: Representative images with the use of fluorescent microscopy show csf1r-EGFP macrophage infiltration (arrows) in kidneys at P5 after treatment with either CSF-1 or vehicle control at P1, P2, and P3 (n = 4 per group). Nuclei are stained with DAPI (blue). Low magnification (×100) shows that kidneys treated with CSF-1 (F) had increased numbers of macrophages in the renal medulla and cortex, compared with vehicle controls (E). G:Csf1r-EGFP macrophages show a spindle-shaped structure, wrapping around newly developed structures. H: Estimation of the number of renal csf1r-EGFP macrophages showed a 42% (P = 0.004) increase in macrophages within the cortex and a 157% (P = 0.003) increase within the medulla after treatment with CSF-1, compared with vehicles (n = 3 to 4 per group). Data were analyzed with a Student's t-test (unpaired, 2-tailed); *P < 0.05, **P < 0.01. Data are means ± SEMs. Veh, vehicle.
Structural Regeneration and Functional Recovery in Response to CSF-1
On the basis of the observations of the role of CSF-1 in growth and development of the kidney in newborn mice, we tested the effect of CSF-1 in promoting kidney repair after IR injury (see diagram in Figure 3A). IR injury of the kidney leads to tubular epithelial cell damage within the OSOM, the area most susceptible to hypoxic damage. Compared with sham-operated kidneys, at 5 days after IR injury widespread tubular epithelial cell damage was evident with a prominent inflammatory cell infiltrate, interstitial matrix expansion, and tubular cast formation (Figure 3B). By contrast, when mice with IR injury were administered CSF-1, there was an acceleration of renal repair and reduced tubular damage (Figure 3, B and C), also characterized by increased tubular epithelial cell proliferation as measured by quantification of PCNA immunostaining in proximal tubules (Figure 3D). At 7 days after IR in mice with vehicle injection, renal damage was evident with numerous proteinaceous casts present and a marked inflammatory cell infiltrate associated with the accumulation of extracellular matrix proteins and interstitial matrix expansion (Figure 3B). Quantification of the histopathologic analysis of kidneys from IR mice with and without CSF-1 treatment showed that CSF-1 treatment rescued tubular damage as confirmed by the reduction in the number and size of tubular casts and restoration of the tubular epithelial cell layer (Figure 3C) that was associated with reduced tubular epithelial cell proliferation (Figure 3D).
Figure 3.
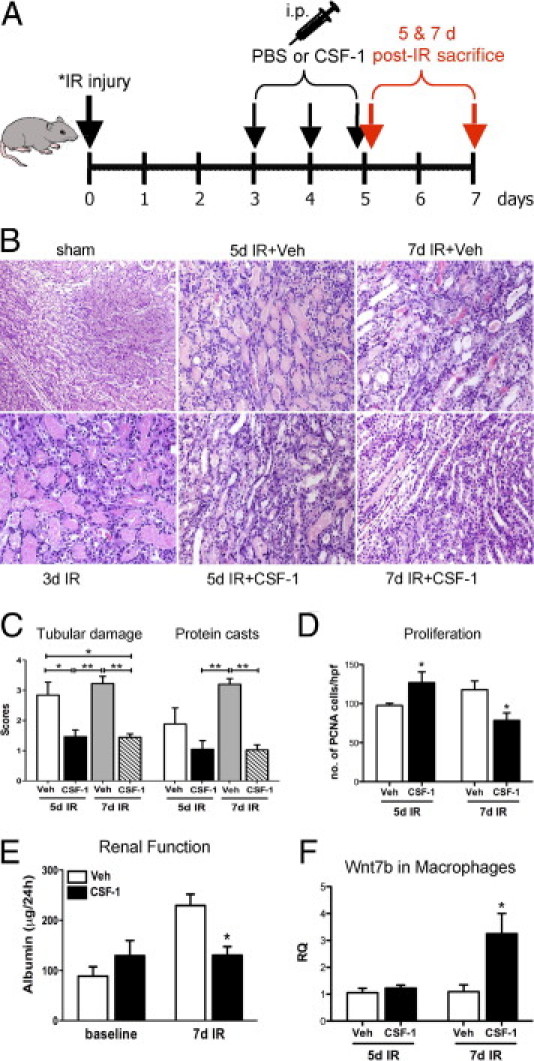
CSF-1 treatment, starting at 3 days after IR injury, accelerates endogenous cellular repair and improves renal function in adult mice after IR injury. A: Schematic diagram of the dosing regimen for CSF-1 therapy, beginning at 3 days after unilateral (40 minutes) or bilateral (25 minutes) renal artery clamping. B: Representative H&E-stained sections showing the histoarchitecture of the OSOM from sham control (original magnification, ×200), 3 days after unilateral IR kidney, 5 and 7 days after unilateral IR kidneys with vehicle or CSF-1 injections (original magnification, ×400). C: Semiquantitative analysis of kidney injury from kidneys 5 and 7 days after IR with vehicle or CSF-1 treatment. Data were analyzed by a one-way analysis of variance with an accompanying Tukey's post hoc test for multiple comparisons; *P < 0.05, **P < 0.01, and ***P < 0.001. D: Tubular epithelial cell proliferation measured by immunostaining with PCNA in kidneys 5 and 7 days after IR treated with CSF-1 or vehicle injections. Data were analyzed with a Student's t-test (unpaired, 2-tailed); *P < 0.05. E: Functional analysis measuring 24-hour urinary albumin excretion at baseline and in kidneys 7 days after bilateral IR. Albumin data were analyzed with a two-way analysis of variance; *P < 0.05. F: qPCR analysis of Wnt7b expression in sorted macrophage populations at 5 and 7 days after IR in kidneys treated with CSF-1 or vehicle injections. Data were analyzed with a Student's t-test (unpaired, 2-tailed); *P = 0.03. Data are means ± SEMs (n = 5 to 6 per group). RQ, relative quantification; Veh, vehicle.
This reparative effect of CSF-1 therapy in IR mice was further supported by evidence of functional recovery and the expression of Wnt7b in sorted macrophage populations. Urinary albumin excretion was measured in 24-hour urine samples from 7-day bilateral IR mice (Figure 3E). Baseline urinary albumin levels were determined in both vehicle- and CSF-1-treated groups before IR surgery (Figure 3E). At 7 days after bilateral IR surgery urinary albumin levels of vehicle-treated mice were twice that of baseline measurements (Figure 3E; 88.69 ± 18.59 versus 229.46 ± 22.52 μg/24 hours). However, 24-hour urinary albumin excretion of IR mice treated with CSF-1 was not different from baseline measurements and approximately one-half that of vehicle-injected controls (Figure 3E; 130.47 ± 17.14 versus 229.46 ± 22.52 μg/24 hours; P < 0.05).
Recently, it was shown that Wnt7b ligand production from in sorted macrophage populations in mouse IR kidneys is critical for repair of the kidney tubule basal lamina and the proliferation and migration of epithelial cells.46 With the use of qPCR, the expression of Wnt7b in sorted kidney macrophages was investigated with and without CSF-1 therapy after IR injury. A significant increase in Wnt7b expression was found in sorted kidney macrophages (CD45+CD11b+CD11c−) at day 7 after IR, a time corresponding to both structural and functional recovery, compared with vehicle-treated kidneys (Figure 3F; 1.091 ± 0.25 versus 3.25 ± 0.75 relative quantification; P = 0.03).
Assessment of Collagen Accumulation
CSF-1 treatment of mice with IR injury reduced the accumulation of interstitial collagen as assessed by hydroxyproline assay, SDS-PAGE analysis, and immunostaining for type IV collagen. In IR kidneys a significant increase was observed in total renal collagen concentration by hydroxyproline assay at both 5 and 7 days, compared with sham-operated kidneys (both P < 0.01 versus sham controls; Figure 4A). At 7 days after IR a significant decrease in total kidney collagen concentration (P < 0.05) was evident in CSF-1-treated mice than in kidneys from vehicle-treated mice (Figure 4A). In addition, most of the interstitial collagen in the kidney as assessed by SDS-PAGE was type 1 collagen [α1(I) and α2(I) monomers and dimers of two α1(I) chains (β11) or α1(I) and α2(I) monomers (β12)], with a smaller amount of type V collagen also being present. At 7 days after IR, a significant decrease was observed in collagen, particularly type 1 collagen, after CSF-1 treatment compared with vehicle-injected IR mice as determined by scanning densitometry (Figure 4A). Furthermore, immunofluorescence microscopy was used to visualize type IV collagen localization (Figure 4B). At 7 days, type IV collagen was present as a fine framework within the glomerular and tubulointerstitium without evidence of interstitial collagen accumulation in IR kidneys after CSF-1 treatment, compared with IR kidneys without treatment. These findings suggest that CSF-1-dependent macrophages prevent fibrosis during tissue remodeling. At day 5, qPCR showed a decreased expression of TGF-β and α-SMA in CSF-1-treated animals compared with vehicle-injected IR mice, with an up-regulation of MMP9 by day 7 (Figure 4C).
Figure 4.
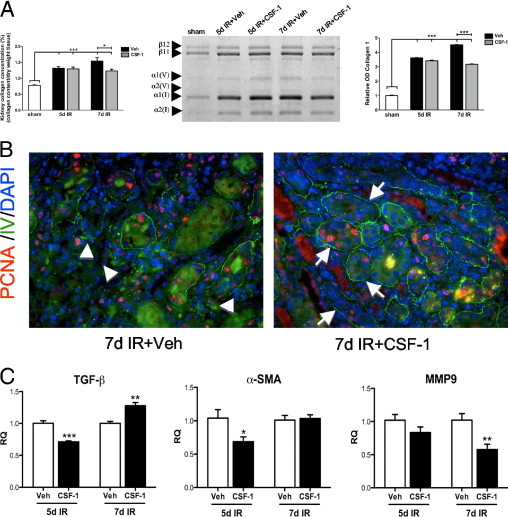
CSF-1 reduces renal fibrosis by 7 days after IR injury. A: Kidney collagen concentration, SDS-PAGE analysis, and densitometry of sham, and kidneys 5 and 7 days after IR treated with CSF-1 or vehicle. Type I collagen monomers are represented by α1(I) and α2(I) chains, β11 represents dimers of two α1(I) chains, whereas β12 represents dimers of α1(I) and α2(I) chains. Type V collagen is represented by α1(V) and α2(V) chains. B: Representative fluorescent micrographs showing type IV collagen (green) and PCNA (red) staining at 7 days after IR injury with and without CSF-1 treatment. Original magnification, ×400. Type IV collagen in the CSF-1-treated IR kidneys displays a fine supportive network around re-epithelialized tubules (arrows) compared with interstitial collagen accumulation (arrowheads) and disruption of the tissue architecture evidence in vehicle-injected controls. C: qPCR analysis of TGF-β, α-SMA, and MMP9 expression in sorted macrophage populations of kidneys at 5 and 7 days after IR treated with CSF-1 or vehicle injections. Hydroxyproline and densitometry data were analyzed with a one-way analysis of variance with an accompanying Tukey's post hoc test. qPCR analysis was analyzed with a Student's t-test (unpaired, 2-tailed); *P < 0.05, **P < 0.005, and ***P < 0.0001. Data are means ± SEMs (n = 5 to 6 per group). RQ, relative quantification; Veh, vehicle.
Alteration of Macrophage Phenotype after IR Injury with CSF-1 Treatment
With the use of fluorescence microscopy at 7 days after IR injury, a marked interstitial inflammatory response was observed with an infiltration of csf1r-EGFP macrophages in the tubulointerstitium associated with the presence of tubular casts. In response to CSF-1, csf1r-EGFP macrophages were also observed in large numbers in the tubulointerstitium (Figure 5A), however, without evidence of collagen accumulation or interstitial expansion. CSF-1-responsive csf1r-EGFP macrophages manifested a spindle-shaped structure such that the cells surrounded tubules with interconnecting projections surrounding the tubular basement membrane (Figure 5A).
Figure 5.
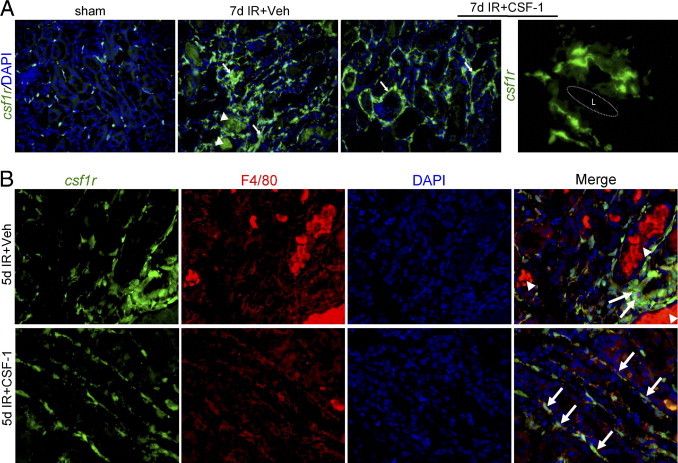
CSF-1 alters macrophage phenotype after IR injury. A: Representative fluorescent micrographs depicting the phenotypic changes of csf1r-EGFP (green) interstitial macrophages from sham control (original magnification, ×200) and kidneys 7 days after IR with and without CSF-1 treatment (original magnification, ×400). In vehicle-injected IR kidneys there is a marked infiltrate of interstitial macrophages (arrows) with autofluorescent tubular casts also evident (arrowheads). In comparison, kidneys from the CSF-1-treated mice had a prominent interstitial macrophage infiltrate that displayed a spindle-shaped structure (arrows). At high power the csf1r-EGFP macrophages in CSF-1-treated IR kidneys envelop the tubules with connecting cytoplasmic projections closely adjacent to the tubular basement membrane. Original magnification, ×1000. B: Representative immunofluorescence microscopy showing co-expression of F4/80 (red) with csf1r-EGFP macrophages (green) 5 days after IR injury with vehicle or CSF-1 injection. Original magnification, ×400. L, tubular lumen.
Immunofluorescence staining was then used to determine the maturation status of the macrophage with the use of the F4/80 antigen on csf1r-EGFP macrophages in kidneys 5 and 7 days after IR with and without CSF-1 treatment. At 5 and 7 days (data not shown) after IR, expression of F4/80 completely localized with csf1r-EGFP in presumptive macrophages in the interstitium surrounding damaged tubules (Figure 5B). In CSF-1-treated kidneys, mature F4/80/csf1r-EGFP macrophages adopted a flattened spindle-shaped structure that lined the basement membrane of repaired tubules (Figure 5B).
Characterization of Macrophage Phenotype after IR Injury in Response to CSF-1
The inflammatory profile and functional phenotype of macrophages in response to CSF-1 was further examined by flow cytometry, qPCR, and expression profiling with the use of the Illumina Mouse Ref8 V2 gene expression arrays (Illumina) in C57BL/6J mice. At 5 days after IR surgery, there was a large influx of macrophages (CD45+CD11b+CD11c−), which increased further in response to CSF-1, compared with vehicle- (P < 0.05) and sham-treated (P < 0.001) kidneys (Figure 6A). The number of macrophages remained consistent between 5 and 7 days after IR in vehicle-treated animals, whereas the inflammatory infiltrate declined in the CSF-1-treated animals, suggesting an accelerated recovery (Figure 6A). These inflammatory cells predominantly expressed F4/80 and major histocompatibility complex (MHC) class II, and CSF-1 treatment did not change the relative proportions of cells expressing these markers (Figure 6A). However, CSF-1 administration did increase the level of MHC class II expression on F4/80+ macrophages at 5 days after IR compared with vehicle-treated animals, as shown by a positive shift in the mean fluorescent intensity (P < 0.01; Figure 6B).
Figure 6.
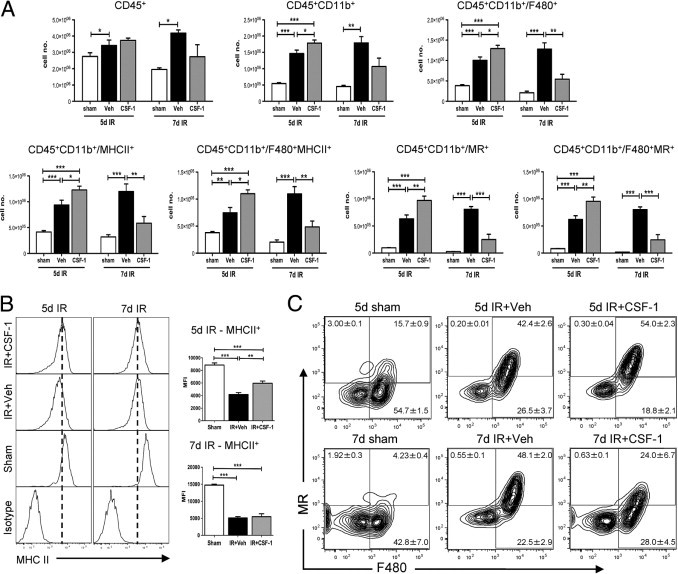
CD45+CD11b+CD11c− renal macrophages in CSF-1-treated mice display an altered phenotype and cell number compared with vehicle-treated mice at 5 and 7 days after IR injury. Flow cytometric analysis was performed on sham-operated kidneys and kidneys 5 and 7 days after IR treated with vehicle or CSF-1. A: Flow cytometric quantification of leukocytes stained for F480, MR, and MHC class II on CD45+CD11b+CD11c− renal macrophages. B: Representative histograms displaying the shift in mean fluorescent intensity of MHC class II+ cells gated on CD45+CD11b+CD11c−/F480+ macrophages. C: Representative contour plots of F480 and MR co-expression on CD45+CD11b+CD11c− macrophages. Positive staining was confirmed with appropriate isotype controls. Percentages of cells in each quadrant represent mean ± SEM. Statistical analysis was performed with a one-way analysis of variance with an accompanying Tukey's post hoc test for multiple comparisons; *P < 0.05, **P < 0.01, and ***P < 0.001. Data are means ± SEMs (n = 5 per group). MFI, mean fluorescent intensity; Veh, vehicle.
The accelerated resolution of the lesions in response to CSF-1 suggested the presence of an anti-inflammatory response. The macrophage MR has been associated with an anti-inflammatory phenotype in macrophages.47,48 The number of macrophages expressing MR at 5 days after IR with CSF-1 therapy was significantly increased than with vehicle- (P < 0.01) and sham-treated (P < 0.001) mice (Figure 6A). These MR cells were also positive for F4/80 (Figure 6A) with a shift from F4/80+MRhi population at 5 days after IR to a F4/80+MRlo population at 7 days after IR in response to CSF-1 (Figure 6C). In vehicle-treated mice, this phenotypic shift was mostly reversed with a F4/80+MRlo population at 5 days after IR to a F4/80+MRhi population at 7 days after IR injury (Figure 6C). These results suggest that CSF-1 accelerates macrophage maturation, leading to a more rapid resolution of injury.
The numbers of CD45+CD11b+CD11c− macrophages in the inflamed kidney are sufficient to allow detection of relevant macrophage-expressed genes with the use of qPCR analysis. At 5 days after IR, CSF-1 therapy increased the initial inflammatory response, as evidenced by TNF-α and CCL2 expressions (Figure 7A) but did not alter iNOS and Cxcl2 expressions (Figure 7A). By 7 days, these effects of CSF-1 were no longer evident (Figure 7A). Conversely, at 5 days after IR, CSF-1 therapy also induced the expression of arginase and CCL17 more often associated with an anti-inflammatory phenotype, and by 7 days after IR macrophage scavenger receptor 2 (MSR2) and MR were also induced further by CSF-1 (Figure 7B).
Figure 7.
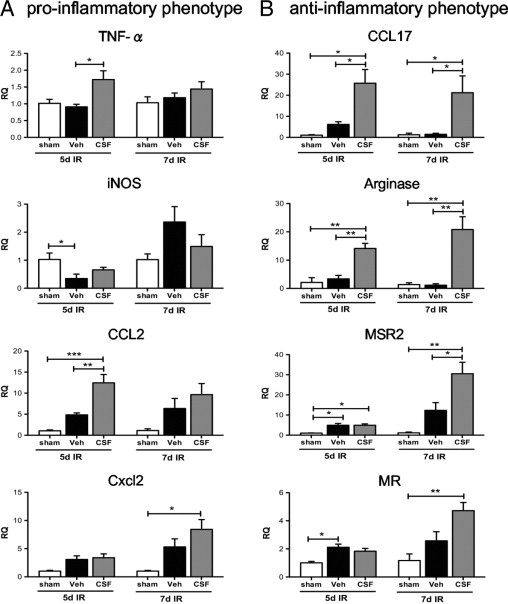
qPCR analysis of pro-inflammatory and anti-inflammatory gene expression in sorted CD45+CD11b+CD11c− macrophages from sham-operated kidneys and kidneys 5 and 7 days after IR treated with CSF-1 or vehicle injections. Pro-inflammatory (INOS, TNF-α, CCL2, and Cxcl2) (A) and anti-inflammatory (CCL17, arginase, MSR2, and MR) (B) gene expression in response to CSF-1 treatment. Sham-operated kidneys were used as the baseline control. Statistical analysis was performed with a one-way analysis of variance with an accompanying Tukey's post hoc test for multiple comparisons; *P < 0.05, **P < 0.01, and ***P < 0.001. Data are means ± SEMs (n = 5 per group). RQ, relative quantification; Veh, vehicle.
Gene expression profiling was performed to further examine the differentially expressed genes and altered signaling pathways in sorted kidney macrophages at both 5 and 7 days after IR injury with CSF-1 therapy compared with untreated mice. Hierarchical clustering of genes in each group showed distinct patterns of gene expression because of time and treatment with CSF-1. The largest difference in transcript expression between vehicle and CSF-1 treatment samples was seen at day 5 after IR; this was less obvious at day 7 after IR between treatment groups (Figure 8A). The lists of differentially expressed genes were then subjected to pathway overrepresentation analyses with the use of Ingenuity Pathway Analysis software version 8.8 (Ingenuity Systems). Overrepresentation analyses are a measure of probability that the gene lists at both 5 and 7 days after IR with CSF-1 treatment compared with vehicle contains more members of the biochemical pathway than because of chance alone (Figure 8B). Interestingly, in the day-5 CSF-1-treated macrophage populations, the glucocorticoid receptor, IL-10, and IGF-1 signaling pathways were identified, all are associated with a M2 macrophage response (Figure 8B). Networks of differentially expressed genes were also generated with Ingenuity Pathway Analysis version 8.8 (Ingenuity Systems), and network hubs were identified around IL-1 receptor antagonist, arginase, and mice STAT3 molecules, all associated with an M2 macrophage response (see Supplemental Figures S1 and S2 at http://ajp.amjpathol.org). The pathways significantly overrepresented in the day-7 CSF-1-treated macrophages included platelet-derived growth factor (PDGF), granulocyte macrophage (GM)-CSF-1, and apoptosis signaling (Figure 8B).
Figure 8.
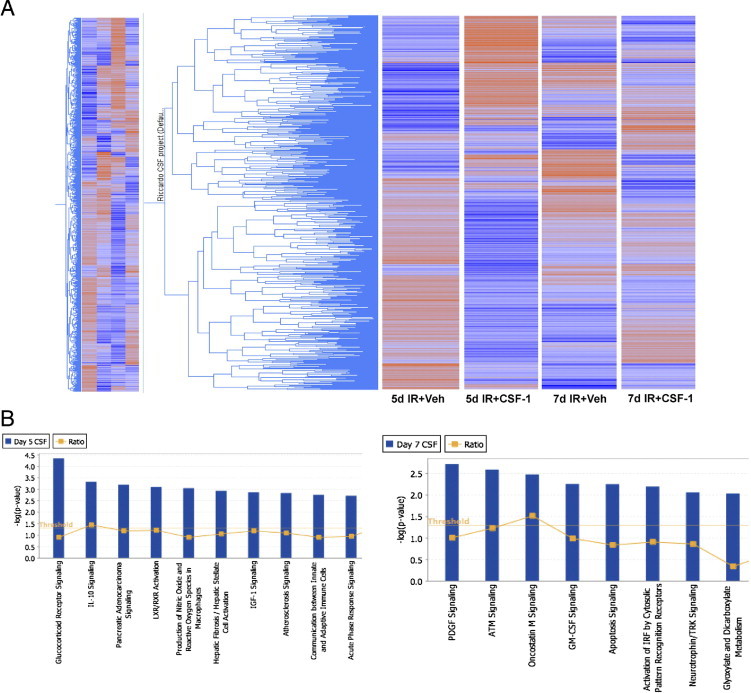
Microarray analysis of sorted macrophage populations from kidneys 5 and 7 days after IR with or without CSF-1 therapy. A: Hierarchical cluster of expressed genes in each group, where blue represents low gene expression and red represents high gene expression. B: Canonical signaling pathways significantly overrepresented in sorted macrophages from kidneys 5 and 7 days after IR with CSF-1 therapy compared with vehicle treatment. The threshold line indicates the cutoff probability (P < 0.05) calculated from a right-tailed Fisher's exact test within the Ingenuity Pathway Analysis software version 8.8 (Ingenuity Systems). The ratio line indicates the number of genes from the gene list that pass cutoff criteria in the pathway divided by the total number of genes in the pathway. ATM, ataxia telangiectasia mutated; LXR/RXR, liver X receptor/retinoid X receptor; TRK, tyrosine kinase receptor; Veh, vehicle.
IGF-1 Expression in IR Kidneys
IGF-1 has been shown to play an important role in the reparative process of postischemic rat kidneys,49–51 and CSF-1 is known to control the expression of IGF-1.52,53 We therefore investigated IGF-1 expression by qPCR at 5 and 7 days after IR injury following CSF-1 therapy (Figure 9). In whole kidneys, at 5 days after IR no difference in IGF-1 expression was observed between vehicle- and CSF-1-treated mice. However, by 7 days after IR, IGF-1 expression was significantly increased in CSF-1 mice compared with vehicle-treated animals (P < 0.01; Figure 9A), which correlated with the structural and functional recovery evident at the same time point. To confirm that macrophages were the source of IGF-1, we assessed the expression in sorted CD45+CD11b+CD11c− macrophage cells after IR injury. IGF-1 was significantly up-regulated in CSF-1-treated mice at both 5 (P < 0.001) and 7 (P < 0.01) days after IR injury compared with vehicle-treated animals (Figure 9A). In addition, BMMs cultured with CSF-1 protein in the presence of IGF-1-neutralizing antibody inhibited CSF-1-stimulated BMM cell proliferation, suggesting that CSF-1 can promote macrophage growth by IGF-1 signaling (Figure 9B).
Figure 9.
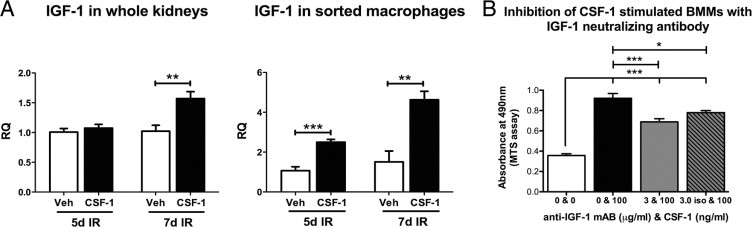
CSF-1 can promote macrophage growth and cell proliferation by IGF-1 signaling. A: qPCR analysis of IGF-1 expression in adult kidneys and sorted macrophages 5 and 7 days after IR injury with and without CSF-1 treatment. B: MTS proliferation assay of BMMs cultured with CSF-1 (100 ng/mL) in the presence of IGF-1 neutralizing antibody (3 μg/mL). qPCR data were analyzed with a Student's t-test (unpaired, 2-tailed), and MTS proliferation data were analyzed with a one-way analysis of variance with an accompanying Tukey's post hoc test for multiple comparisons; *P < 0.01, **P < 0.01, and ***P < 0.001. Data are means ± SEMs (n = 5 per group). RQ, relative quantification; Veh, vehicle.
Discussion
The pleiotrophic role for CSF-1 in reproduction, including mammary branching morphogenesis and placental growth, suggest that CSF-1 exerts many of its actions through the trophic activities of cells of the mononuclear phagocytic lineage.54 Fetal macrophages are among the first hematopoietic cells found in the kidney, entering the murine kidney at embryonic day 12.3 Furthermore, the numbers of macrophages in most major organs of the mouse undergo a substantial numerical increase in response to a postnatal surge of CSF-1.2,14 In the current study, we report that CSF-1 increases overall body weight and kidney weight and volume when administered during the final week of development, and we provide evidence that this is accompanied by an increase in macrophage numbers in the kidneys with the use of a csf1r-EGFP reporter mouse described previously.6
Osteopetrotic (csf1op/csf1op) mice that have a spontaneous mutation in the csf1 gene, show growth restriction and developmental abnormalities11,12,23 that can be partially reversed by the exogenous administration of CSF-1.16 Targeted disruption of the csf1r gene results in growth deficiencies, reduced macrophage numbers, and reproductive defects similar to csf1op/csf1op mice yet more severely.10 Here, we further show that csf1r-null mice have decreased kidney weight. The CSF-1-deficient csf1op/csf1op mouse has many developmental deficiencies in common with the IGF-1-deficient mouse, including a failure to produce insulin-producing cells in the islets, neurologic defects, deficiencies in male and female reproductive systems, and failure of mammary gland development.55 Our previous report showing that CSF-1 can promote nephrogenesis in kidney explants3 is analogous to the growth-promoting role of IGF-1 in human fetal kidney explants that supports the induction and differentiation of the nephrogenic zone.56 The production of IGF-1 by CSF-1-stimulated macrophages has been recognized previously,52,57,58 but no comparative abundance data have previously been presented.
The present data suggest that macrophages respond to CSF-1 signaling by the production of IGF-1, an essential growth factor that regulates postnatal growth and development.55 In fact, the biology we observe is consistent with a study of muscle regeneration, in which IGF-1 not only promotes repair but also dampens expression of inflammatory cytokines.59 The other possibility is that there is another cell type able to transduce the CSF-1 signal. Indeed, Menke et al60 have also reported that CSF-1 can promote kidney repair but conclude that the renal epithelium itself expresses the CSF-1R, suggesting a direct signaling mechanism for this outcome. They report the detection of CSF-1R mRNA and protein on mouse primary tubular epithelial cells in vitro, although at a very low level in comparison to macrophage lines.60
Local microenvironmental cues play an important role in macrophage heterogeneity. Therefore, CSF-1 activation of tissue macrophages may influence the growth, proliferation, and maturation of the kidney during organogenesis, a phenomenon that may be mirrored in repairing kidneys after CSF-1 therapy. We report that the administration of CSF-1 to mice with established IR injury resulted in tubular epithelial proliferation, attenuation of interstitial fibrosis, and functional recovery. In many settings regeneration of the kidney is macrophage dependent, evidenced by the switch of macrophage phenotype from a pro-inflammatory to an anti-inflammatory phenotype,21 which is followed by the production of angiogenic and anti-inflammatory factors in addition to phagocytic tissue remodeling.22,61 The precise phenotype of the macrophages seen in the repairing kidney in our study does not strictly conform to the M1/M2 dichotomy, because we see expression of genes associated with both extremes and the profile changes with time. Mosser and Edwards48 have suggested a third macrophage classification, associated with wound healing, that is distinct from the M2 category. In reality, the repairing kidney should be considered as a unique environment. Induction of genes such as IGF-1, and the MSR62 are probably direct responses to CSF-1. The macrophage MR is also highly expressed in CSF-1-stimulated BMMs (see data at http://www.bioGPS.org) and in macrophages of the embryo.48 Urokinase plasminogen activator is another relevant gene that is inducible by CSF-1.63 Previous reports implicate urokinase plasminogen activator in the prevention of fibrosis in kidney and other tissues.64,65 Other genes expressed by macrophages that we observed may be in response to the presence of apoptotic cells. Our microarray profiling of differentially expressed genes and signaling pathways showed distinct patterns that correspond to macrophage phenotypes that showed genes in common with csf1r-EGFP-expressing macrophages during embryonic development.3
Original studies of CSF-1 administration to adult mice showed that it can increase circulating monocytes and tissue macrophages.66 Notwithstanding the surge in availability in the postnatal period, injected CSF-1 can additionally promote postnatal growth in newborn mice. We have recently reported that the administration of CSF-1R blocking antibody selectively reduced monocyte precursors of resident tissue macrophages.67 The current study suggests that CSF-1 acts, at least in part, through production of IGF-1 by kidney macrophages. We further propose that an activation of CSF-1 by tissue macrophages creates a microenvironment that influences the growth, proliferation, and differentiation of renal epithelial cells and promotes matrix remodeling and cellular replacement in an inflammatory setting. CSF-1 thus may bias the macrophage response to one of mediating tissue repair rather than driving inflammation. An understanding of the factors that control differentiation and activation of regenerative macrophages and the environmental cues that govern the outcome of inflammation is vital to the successful development of cellular-based therapies that may prevent or retard the progression of renal disease.
Footnotes
Supported by the Kidney Health Australia and the Australian Stem Cell Centre.
Supplemental material for this article can be found at http://ajp.amjpathol.org or at doi: 10.1016/j.ajpath.2011.05.037.
Supplementary data
A gene network hub of glucocorticoid receptor signaling constructed with the differentially expressed genes from macrophages at day 5 with CSF-1 treatment compared with vehicle. Each node represents a gene, which is colored according to its expression; red indicates increased expression, and gray/green indicates decreased expression. Each node is organized on the basis of the gene product location within the cell and displayed with various shapes that represent the function of the gene product. The continuous line between nodes represents a direct interaction.
A gene network hub of IL-10 signaling from macrophages at day 5 with CSF-1 treatment compared with vehicle. See legend to Supplemental Figure S1 for details on the description of the gene network hub.
References
- 1.Ovchinnikov D.A. Macrophages in the embryo and beyond: much more than just giant phagocytes. Genesis. 2008;46:447–462. doi: 10.1002/dvg.20417. [DOI] [PubMed] [Google Scholar]
- 2.Pollard J.W. Trophic macrophages in development and disease. Nat Rev Immunol. 2009;9:259–270. doi: 10.1038/nri2528. [DOI] [PMC free article] [PubMed] [Google Scholar]
- 3.Rae F., Woods K., Sasmono T., Campanale N., Taylor D., Ovchinnikov D.A., Grimmond S.M., Hume D.A., Ricardo S.D., Little M.H. Characterisation and trophic functions of murine embryonic macrophages based upon the use of a Csf1r-EGFP transgene reporter. Dev Biol. 2007;308:232–246. doi: 10.1016/j.ydbio.2007.05.027. [DOI] [PubMed] [Google Scholar]
- 4.Hume D.A., Ross I.L., Himes S.R., Sasmono R.T., Wells C.A., Ravasi T. The mononuclear phagocyte system revisited. J Leukoc Biol. 2002;72:621–627. [PubMed] [Google Scholar]
- 5.Lichanska A.M., Hume D.A. Origins and functions of phagocytes in the embryo. Exp Hematol. 2000;28:601–611. doi: 10.1016/s0301-472x(00)00157-0. [DOI] [PubMed] [Google Scholar]
- 6.Sasmono R.T., Oceandy D., Pollard J.W., Tong W., Pavli P., Wainwright B.J., Ostrowski M.C., Himes S.R., Hume D.A. A macrophage colony-stimulating factor receptor-green fluorescent protein transgene is expressed throughout the mononuclear phagocyte system of the mouse. Blood. 2003;101:1155–1163. doi: 10.1182/blood-2002-02-0569. [DOI] [PubMed] [Google Scholar]
- 7.Penaloza C., Orlanski S., Ye Y., Entezari-Zaher T., Javdan M., Zakeri Z. Cell death in mammalian development. Curr Pharm Des. 2008;14:184–196. doi: 10.2174/138161208783378789. [DOI] [PubMed] [Google Scholar]
- 8.Henson P.M., Hume D.A. Apoptotic cell removal in development and tissue homeostasis. Trends Immunol. 2006;27:244–250. doi: 10.1016/j.it.2006.03.005. [DOI] [PubMed] [Google Scholar]
- 9.Smith S.J., Kotecha S., Towers N., Latinkic B.V., Mohun T.J. XPOX2-peroxidase expression and the XLURP-1 promoter reveal the site of embryonic myeloid cell development in Xenopus. Mech Dev. 2002;117:173–186. doi: 10.1016/s0925-4773(02)00200-9. [DOI] [PubMed] [Google Scholar]
- 10.Dai X.M., Ryan G.R., Hapel A.J., Dominguez M.G., Russell R.G., Kapp S., Sylvestre V., Stanley E.R. Targeted disruption of the mouse colony-stimulating factor 1 receptor gene results in osteopetrosis, mononuclear phagocyte deficiency, increased primitive progenitor cell frequencies, and reproductive defects. Blood. 2002;99:111–120. doi: 10.1182/blood.v99.1.111. [DOI] [PubMed] [Google Scholar]
- 11.Cohen P.E., Chisholm O., Arceci R.J., Stanley E.R., Pollard J.W. Absence of colony-stimulating factor-1 in osteopetrotic (csfmop/csfmop) mice results in male fertility defects. Biol Reprod. 1996;55:310–317. doi: 10.1095/biolreprod55.2.310. [DOI] [PubMed] [Google Scholar]
- 12.Van Nguyen A., Pollard J.W. Colony stimulating factor-1 is required to recruit macrophages into the mammary gland to facilitate mammary ductal outgrowth. Dev Biol. 2002;247:11–25. doi: 10.1006/dbio.2002.0669. [DOI] [PubMed] [Google Scholar]
- 13.Banaei-Bouchareb L., Gouon-Evans V., Samara-Boustani D., Castellotti M.C., Czernichow P., Pollard J.W., Polak M. Insulin cell mass is altered in Csf1op/Csf1op macrophage-deficient mice. J Leukoc Biol. 2004;76:359–367. doi: 10.1189/jlb.1103591. [DOI] [PubMed] [Google Scholar]
- 14.Cecchini M.G., Dominguez M.G., Mocci S., Wetterwald A., Felix R., Fleisch H., Chisholm O., Hofstetter W., Pollard J.W., Stanley E.R. Role of colony stimulating factor-1 in the establishment and regulation of tissue macrophages during postnatal development of the mouse. Development. 1994;120:1357–1372. doi: 10.1242/dev.120.6.1357. [DOI] [PubMed] [Google Scholar]
- 15.Ryan G.R., Dai X.M., Dominguez M.G., Tong W., Chuan F., Chisholm O., Russell R.G., Pollard J.W., Stanley E.R. Rescue of the colony-stimulating factor 1 (CSF-1)-nullizygous mouse (Csf1(op)/Csf1(op)) phenotype with a CSF-1 transgene and identification of sites of local CSF-1 synthesis. Blood. 2001;98:74–84. doi: 10.1182/blood.v98.1.74. [DOI] [PubMed] [Google Scholar]
- 16.Wiktor-Jedrzejczak W., Urbanowska E., Aukerman S.L., Pollard J.W., Stanley E.R., Ralph P., Ansari A.A., Sell K.W., Szperl M. Correction by CSF-1 of defects in the osteopetrotic op/op mouse suggests local, developmental, and humoral requirements for this growth factor. Exp Hematol. 1991;19:1049–1054. [PubMed] [Google Scholar]
- 17.Martinez F.O., Gordon S., Locati M., Mantovani A. Transcriptional profiling of the human monocyte-to-macrophage differentiation and polarization: new molecules and patterns of gene expression. J Immunol. 2006;177:7303–7311. doi: 10.4049/jimmunol.177.10.7303. [DOI] [PubMed] [Google Scholar]
- 18.Mantovani A., Sica A., Sozzani S., Allavena P., Vecchi A., Locati M. The chemokine system in diverse forms of macrophage activation and polarization. Trends Immunol. 2004;25:677–686. doi: 10.1016/j.it.2004.09.015. [DOI] [PubMed] [Google Scholar]
- 19.Martinez F.O., Helming L., Gordon S. Alternative activation of macrophages: an immunologic functional perspective. Annu Rev Immunol. 2009;27:451–483. doi: 10.1146/annurev.immunol.021908.132532. [DOI] [PubMed] [Google Scholar]
- 20.Ricardo S.D., van Goor H., Eddy A.A. Macrophage diversity in renal injury and repair. J Clin Invest. 2008;118:3522–3530. doi: 10.1172/JCI36150. [DOI] [PMC free article] [PubMed] [Google Scholar]
- 21.Wang Y., Wang Y.P., Zheng G., Lee V.W., Ouyang L., Chang D.H., Mahajan D., Coombs J., Wang Y.M., Alexander S.I., Harris D.C. Ex vivo programmed macrophages ameliorate experimental chronic inflammatory renal disease. Kidney Int. 2007;72:290–299. doi: 10.1038/sj.ki.5002275. [DOI] [PubMed] [Google Scholar]
- 22.Vinuesa E., Hotter G., Jung M., Herrero-Fresneda I., Torras J., Sola A. Macrophage involvement in the kidney repair phase after ischaemia/reperfusion injury. J Pathol. 2008;214:104–113. doi: 10.1002/path.2259. [DOI] [PubMed] [Google Scholar]
- 23.Michaelson M.D., Bieri P.L., Mehler M.F., Xu H., Arezzo J.C., Pollard J.W., Kessler J.A. CSF-1 deficiency in mice results in abnormal brain development. Development. 1996;122:2661–2672. doi: 10.1242/dev.122.9.2661. [DOI] [PubMed] [Google Scholar]
- 24.Ishida Y., Gao J.L., Murphy P.M. Chemokine receptor CX3CR1 mediates skin wound healing by promoting macrophage and fibroblast accumulation and function. J Immunol. 2008;180:569–579. doi: 10.4049/jimmunol.180.1.569. [DOI] [PubMed] [Google Scholar]
- 25.Wang H., Peters T., Kess D., Sindrilaru A., Oreshkova T., Van Rooijen N., Stratis A., Renkl A.C., Sunderkotter C., Wlaschek M., Haase I., Scharffetter-Kochanek K. Activated macrophages are essential in a murine model for T cell-mediated chronic psoriasiform skin inflammation. J Clin Invest. 2006;116:2105–2114. doi: 10.1172/JCI27180. [DOI] [PMC free article] [PubMed] [Google Scholar]
- 26.Nakamura T., Abu-Dahab R., Schafer U., Vollmar B., Wada H., Lehr C.M., Schafers H.J. Depletion of alveolar macrophages by clodronate-liposomes aggravates ischemia-reperfusion injury of the lung. J Heart Lung Transplant. 2005;24:38–45. doi: 10.1016/j.healun.2003.10.007. D. Menger M. [DOI] [PubMed] [Google Scholar]
- 27.Duffield J.S., Forbes S.J., Constandinou C.M., Clay S.A., Partolina M.A., Vuthoori S.A., Wu S.A., Lang R.A., Iredale J.P. Selective depletion of macrophages reveals distinct, opposing roles during liver injury and repair. J Clin Invest. 2005;115:56–65. doi: 10.1172/JCI22675. [DOI] [PMC free article] [PubMed] [Google Scholar]
- 28.Leor J., Rozen L., Zuloff-Shani A., Feinberg M.S., Amsalem Y., Barbash I.M., Kachel E., Holbova R., Mardor Y., Daniels D., Ocherashvilli A., Orenstein A., Danon D. Ex vivo activated human macrophages improve healing, remodeling, and function of the infarcted heart. Circulation. 2006;114(1 Suppl):I94–I100. doi: 10.1161/CIRCULATIONAHA.105.000331. [DOI] [PubMed] [Google Scholar]
- 29.Pull S.L., Doherty J.M., Mills J.C., Gordon J.I., Stappenbeck T.S. Activated macrophages are an adaptive element of the colonic epithelial progenitor niche necessary for regenerative responses to injury. Proc Natl Acad Sci U S A. 2005;102:99–104. doi: 10.1073/pnas.0405979102. [DOI] [PMC free article] [PubMed] [Google Scholar]
- 30.Ramsay R.G., Micallef S.J., Williams B., Lightowler S., Vincan E., Heath J.K., Mantamadiotis T., Bertoncello I. Colony-stimulating factor-1 promotes clonogenic growth of normal murine colonic crypt epithelial cells in vitro. J Interferon Cytokine Res. 2004;24:416–427. doi: 10.1089/1079990041535638. [DOI] [PubMed] [Google Scholar]
- 31.Bryer S.C., Fantuzzi G., Van Rooijen N., Koh T.J. Urokinase-type plasminogen activator plays essential roles in macrophage chemotaxis and skeletal muscle regeneration. J Immunol. 2008;180:1179–1188. doi: 10.4049/jimmunol.180.2.1179. [DOI] [PubMed] [Google Scholar]
- 32.Arnold L., Henry A., Poron F., Baba-Am Y., van Rooijen N., Plonquet A., Gherardi R.K., Chazaud B. Inflammatory monocytes recruited after skeletal muscle injury switch into antiinflammatory macrophages to support myogenesis. J Exp Med. 2007;204:1057–1069. doi: 10.1084/jem.20070075. [DOI] [PMC free article] [PubMed] [Google Scholar]
- 33.Arceci R.J., Shanahan F., Stanley E.R., Pollard J.W. Temporal expression and location of colony-stimulating factor 1 (CSF-1) and its receptor in the female reproductive tract are consistent with CSF-1-regulated placental development. Proc Natl Acad Sci U S A. 1989;86:8818–8822. doi: 10.1073/pnas.86.22.8818. [DOI] [PMC free article] [PubMed] [Google Scholar]
- 34.Pollard J.W., Bartocci A., Arceci R., Orlofsky A., Ladner M.B., Stanley E.R. Apparent role of the macrophage growth factor: CSF-1, in placental development. Nature. 1987;330:484–486. doi: 10.1038/330484a0. [DOI] [PubMed] [Google Scholar]
- 35.Pakkenberg B., Gundersen H.J. Total number of neurons and glial cells in human brain nuclei estimated by the dissector and the fractionator. J Microsc. 1988;150:1–20. doi: 10.1111/j.1365-2818.1988.tb04582.x. [DOI] [PubMed] [Google Scholar]
- 36.Kett M.M., Alcorn D., Bertram J.F., Anderson W.P. Glomerular dimensions in spontaneously hypertensive rats: effects of AT1 antagonism. J Hypertens. 1996;4:107–113. [PubMed] [Google Scholar]
- 37.Betram J. Analyzing renal glomeruli with the new stereology. Int Rev Cytol. 1995;161:111–172. doi: 10.1016/s0074-7696(08)62497-3. [DOI] [PubMed] [Google Scholar]
- 38.Sims-Lucas S., Caruana G., Dowling J., Kett M.M., Bertram J.F. Augmented and accelerated nephrogenesis in TGF-beta2 heterozygous mutant mice. Pediatr Res. 2008;63:607–612. doi: 10.1203/PDR.0b013e31816d9130. [DOI] [PubMed] [Google Scholar]
- 39.Cochrane A.L., Kett M.M., Samuel C.S., Campanale N.V., Anderson W.P., Hume D.A., Little M.H., Bertram J.F., Ricardo S.D. Renal structural and functional repair in a mouse model of reversal of ureteral obstruction. J Am Soc Nephrol. 2005;16:3623–3630. doi: 10.1681/ASN.2004090771. [DOI] [PubMed] [Google Scholar]
- 40.Samuel C., Butkus A., Coghlan J., Bateman J. The effect of relaxin on collagen metabolism in the nonpregnant rat pubic symphysis: the influence of estrogen and progesterone in regulating relaxin activity. Endocrinology. 1996;137:3884–3890. doi: 10.1210/endo.137.9.8756561. [DOI] [PubMed] [Google Scholar]
- 41.Gallop P.M., Paz M.A. Posttranslational protein modifications, with special attention to collagen and elastin. Physiol Rev. 1975;55:418–487. doi: 10.1152/physrev.1975.55.3.418. [DOI] [PubMed] [Google Scholar]
- 42.Sykes B., Puddle B., Francis M., Smith R. The estimation of two collagens from human dermis by interrupted gel electrophoresis. Biochem Biophys Res Commun. 1976;72:1472–1480. doi: 10.1016/s0006-291x(76)80180-5. [DOI] [PubMed] [Google Scholar]
- 43.Matigian N., Abrahamsen G., Sutharsan R., Cook A.L., Vitale A.M., Nouwens A., Bellette B., An J., Anderson M., Beckhouse A.G., Bennebroek M., Cecil R., Chalk A.M., Cochrane J., Fan Y., Feron F., McCurdy R., McGrath J.J., Murrell W., Perry C., Raju J., Ravishankar S., Silburn P.A., Sutherland G.T., Mahler S., Mellick G.D., Wood S.A., Sue C.M., Wells C.A., Mackay-Sim A. Disease-specific, neurosphere-derived cells as models for brain disorders. Dis Model Mech. 2010;3:785–798. doi: 10.1242/dmm.005447. [DOI] [PubMed] [Google Scholar]
- 44.Zhang X., Goncalves R., Mosser D.M. The isolation and characterization of murine macrophages. Curr Protoc Immunol. 2008 doi: 10.1002/0471142735.im1401s83. Chapter 14:Unit 14.1. [DOI] [PMC free article] [PubMed] [Google Scholar]
- 45.Roth P., Stanley E.R. Colony stimulating factor-1 expression is developmentally regulated in the mouse. J Leukoc Biol. 1996;59:817–823. doi: 10.1002/jlb.59.6.817. [DOI] [PubMed] [Google Scholar]
- 46.Lin S.L., Li B., Rao S., Yeo E.J., Hudson T.E., Nowlin B.T., Pei H., Chen L., Zheng J.J., Carroll T.J., Pollard J.W., McMahon A.P., Lang R.A., Duffield J.S. Macrophage Wnt7b is critical for kidney repair and regeneration. Proc Natl Acad Sci U S A. 2010;107:4194–4199. doi: 10.1073/pnas.0912228107. [DOI] [PMC free article] [PubMed] [Google Scholar]
- 47.Stein M., Keshav S., Harris N., Gordon S. Interleukin 4 potently enhances murine macrophage mannose receptor activity: a marker of alternative immunologic macrophage activation. J Exp Med. 1992;176:287–292. doi: 10.1084/jem.176.1.287. [DOI] [PMC free article] [PubMed] [Google Scholar]
- 48.Mosser D.M., Edwards J.P. Exploring the full spectrum of macrophage activation. Nat Rev Immunol. 2008;8:958–969. doi: 10.1038/nri2448. [DOI] [PMC free article] [PubMed] [Google Scholar]
- 49.Ding H., Kopple J.D., Cohen A., Hirschberg R. Recombinant human insulin-like growth factor-I accelerates recovery and reduces catabolism in rats with ischemic acute renal failure. J Clin Invest. 1993;91:2281–2287. doi: 10.1172/JCI116456. [DOI] [PMC free article] [PubMed] [Google Scholar]
- 50.Hirschberg R., Ding H. Mechanisms of insulin-like growth factor-I-induced accelerated recovery in experimental ischemic acute renal failure. Miner Electrolyte Metab. 1998;24:211–219. doi: 10.1159/000057373. [DOI] [PubMed] [Google Scholar]
- 51.Miller S.B., Martin D.R., Kissane J., Hammerman M.R. Insulin-like growth factor I accelerates recovery from ischemic acute tubular necrosis in the rat. Proc Natl Acad Sci U S A. 1992;89:11876–11880. doi: 10.1073/pnas.89.24.11876. [DOI] [PMC free article] [PubMed] [Google Scholar]
- 52.Arkins S., Rebeiz N., Brunke-Reese D., Minshall C., Kelley K. The colony-stimulating factors induce expression of insulin-like growth factor-I messenger ribonucleic acid during hematopoiesis. Endocrinology. 1995;136:1153–1160. doi: 10.1210/endo.136.3.7532579. [DOI] [PubMed] [Google Scholar]
- 53.Gow D.J., Sester D.P., Hume D.A. CSF-1, IGF-1, and the control of postnatal growth and development. J Leukoc Biol. 2010;88:475–481. doi: 10.1189/jlb.0310158. [DOI] [PubMed] [Google Scholar]
- 54.Pollard J.W. Role of colony-stimulating factor-1 in reproduction and development. Mol Reprod Dev. 1997;46:54–61. doi: 10.1002/(SICI)1098-2795(199701)46:1<54::AID-MRD9>3.0.CO;2-Q. [DOI] [PubMed] [Google Scholar]
- 55.Liu J.L., Yakar S., LeRoith D. Conditional knockout of mouse insulin-like growth factor-1 gene using the Cre/loxP system. Proc Soc Exp Biol Med. 2000;223:344–351. doi: 10.1046/j.1525-1373.2000.22349.x. [DOI] [PubMed] [Google Scholar]
- 56.Matsell D.G., Bennett T. Evaluation of metanephric maturation in a human fetal kidney explant model. In Vitro Cell Dev Biol Anim. 1998;34:138–148. doi: 10.1007/s11626-998-0096-8. [DOI] [PubMed] [Google Scholar]
- 57.Long E., Huynh H.T., Zhao X. Involvement of insulin-like growth factor-1 and its binding proteins in proliferation and differentiation of murine bone marrow-derived macrophage precursors. Endocrine. 1998;9:185–192. doi: 10.1385/ENDO:9:2:185. [DOI] [PubMed] [Google Scholar]
- 58.Kelley K.W., Arkins S., Minshall C., Liu Q., Dantzer R. Growth hormone, growth factors and hematopoiesis. Horm Res. 1996;45:38–45. doi: 10.1159/000184757. [DOI] [PubMed] [Google Scholar]
- 59.Pelosi L., Giacinti C., Nardis C., Borsellino G., Rizzuto E., Nicoletti C., Wannenes F., Battistini L., Rosenthal N., Molinaro M., Musaro A. Local expression of IGF-1 accelerates muscle regeneration by rapidly modulating inflammatory cytokines and chemokines. FASEB J. 2007;21:1393–1402. doi: 10.1096/fj.06-7690com. [DOI] [PubMed] [Google Scholar]
- 60.Menke J., Iwata Y., Rabacal W.A., Basu R., Yeung Y.G., Humphreys B.D., Wada T., Schwarting A., Stanley E.R., Kelley V.R. CSF-1 signals directly to renal tubular epithelial cells to mediate repair in mice. J Clin Invest. 2009;119:2330–2342. doi: 10.1172/JCI39087. [DOI] [PMC free article] [PubMed] [Google Scholar]
- 61.Ferenbach D., Kluth D.C., Hughes J. Inflammatory cells in renal injury and repair. Semin Nephrol. 2007;27:250–259. doi: 10.1016/j.semnephrol.2007.02.001. [DOI] [PubMed] [Google Scholar]
- 62.de Villiers W.J., Fraser I.P., Hughes D.A., Doyle A.G., Gordon S. Macrophage-colony-stimulating factor selectively enhances macrophage scavenger receptor expression and function. J Exp Med. 1994;180:705–709. doi: 10.1084/jem.180.2.705. [DOI] [PMC free article] [PubMed] [Google Scholar]
- 63.Stacey K.J., Fowles L.F., Colman M.S., Ostrowski M.C., Hume D.A. Regulation of urokinase-type plasminogen activator gene transcription by macrophage colony-stimulating factor. Mol Cell Biol. 1995;15:3430–3441. doi: 10.1128/mcb.15.6.3430. [DOI] [PMC free article] [PubMed] [Google Scholar]
- 64.Yamaguchi I., Lopez-Guisa J.M., Cai X., Collins S.J., Okamura D.M., Eddy A.A. Endogenous urokinase lacks antifibrotic activity during progressive renal injury. Am J Physiol Renal Physiol. 2007;293:F12–F19. doi: 10.1152/ajprenal.00380.2006. [DOI] [PubMed] [Google Scholar]
- 65.Zhang G., Kim H., Cai X., Lopez-Guisa J.M., Carmeliet P., Eddy A.A. Urokinase receptor modulates cellular and angiogenic responses in obstructive nephropathy. J Am Soc Nephrol. 2003;14:1234–1253. doi: 10.1097/01.asn.0000064701.70231.3f. [DOI] [PubMed] [Google Scholar]
- 66.Hume D.A., Pavli P., Donahue R.E., Fidler I.J. The effect of human recombinant macrophage colony-stimulating factor (CSF-1) on the murine mononuclear phagocyte system in vivo. J Immunol. 1988;141:3405–3409. [PubMed] [Google Scholar]
- 67.Macdonald K.P., Palmer J.S., Cronau S., Seppanen E., Olver S., Raffelt N.C., Kuns R., Pettit A.R., Clouston A., Wainwright B., Branstetter D., Smith J., Paxton R.J., Cerretti D.P., Bonham L., Hill G.R., Hume D.A. An antibody against the colony-stimulating factor 1 receptor (CSF1R) depletes the resident subset of monocytes and tissue and tumor-associated macrophages but does not inhibit inflammation. Blood. 2010;116:3955–3963. doi: 10.1182/blood-2010-02-266296. [DOI] [PubMed] [Google Scholar]
Associated Data
This section collects any data citations, data availability statements, or supplementary materials included in this article.
Supplementary Materials
A gene network hub of glucocorticoid receptor signaling constructed with the differentially expressed genes from macrophages at day 5 with CSF-1 treatment compared with vehicle. Each node represents a gene, which is colored according to its expression; red indicates increased expression, and gray/green indicates decreased expression. Each node is organized on the basis of the gene product location within the cell and displayed with various shapes that represent the function of the gene product. The continuous line between nodes represents a direct interaction.
A gene network hub of IL-10 signaling from macrophages at day 5 with CSF-1 treatment compared with vehicle. See legend to Supplemental Figure S1 for details on the description of the gene network hub.