

Abstract
The switch of cellular metabolism from mitochondrial respiration to glycolysis is the hallmark of cancer cells and is associated with tumor malignancy. Pyruvate dehydrogenase kinase-1 (PDK1) and PDK3 participate in the metabolic switch of cancer cells; however, the medical significance of PDK1 and PDK3 in cancer progression is not known. Here, we assessed the expression profiles of PDK1 and PDK3 in colorectal cancer. Western blot analysis (n = 74) demonstrated that PDK3 was markedly increased in colon cancer compared to that in adjacent normal tissues, whereas PDK1 was decreased in cancer cells. In addition, PDK3 expression was positively correlated with that of hypoxia inducible factor-1α (HIF-1α) in cancer cells. Further analysis using immunohistochemical staining revealed that PDK3 levels were positively associated with severity of cancer and negatively associated with disease-free survival. In vitro studies using several colon cancer cell lines showed that PDK3 expression was controlled by HIF-1α and contributed to hypoxia-induced increased drug resistance, perhaps explaining why patients with PDK3 overexpression have a greater incidence of treatment failure. Taken together, our findings suggest that PDK3 plays an important role in the metabolic switch and drug resistance of colon cancer and is potentially a novel target for cancer therapy.
Colorectal cancer is the second leading cause of cancer-related death in both males and females worldwide.1 Despite screening and advances in treatment, 50% of patients with colon cancer ultimately die from their disease. The major hurdle of treating colon cancer is its high recurrence. One possible mechanism is the resistance to anticancer therapy of the hypoxic tumor in which metabolic switch confers a survival advantage. The switching of cellular metabolism from oxidative phosphorylation to aerobic glycolysis, the Warburg effect,2 is a hallmark of cancer cells. The Warburg effect is a critical cellular metabolic adaptation to cyclic hypoxia. As a result, cancer cells eventually develop a system that uses cytoplasmic glycolysis to generate ATP instead of mitochondrial oxidative respiration, even in the presence of oxygen.
Although glycolysis is a less efficient process, which produces only two ATPs per glucose molecule (compared to 38 by mitochondrial respiration), it is a beneficial tradeoff for cancer cells. Hypoxic cancer cells have increased chemo- and radio-resistance, increased mutation rate, and increased invasion and metastatic ability.3 In addition, the end product of cytoplasmic glycolysis is lactic acid. Accumulation of lactic acid results in acute and chronic acidification of the local environment. Indeed, the extracellular pH of human and animal tumors is consistently acidic, and the pH value can be as low as 6.0.4,5 This low-pH environment is toxic to normal cells, which lack a mechanism to adapt to extracellular acidosis. In contrast, cancer cells can survive under such acidic conditions through as yet uncharacterized mechanisms. In addition, acidosis itself is mutagenic, which results in increased phenotypic diversity and enhanced evolutionary potential of cancer cells.
Recent studies by our group6 and others7,8 have demonstrated that metabolic switch in cancer cells is regulated by pyruvate dehydrogenase kinase (PDK). PDK is one component of the pyruvate dehydrogenase metabolon, which contains several catalytic and regulatory enzymes responsible for the conversion of pyruvate into acetyl-CoA. Pyruvate dehydrogenase (PDH) controls the rate-limiting step of this conversion. The activity of PDH is determined by its phosphorylation status. Phosphorylation of PDH by PDK inhibits its catalytic activity9–11 and causes the metabolic switch from mitochondrial respiration to cytoplasmic glycolysis.10,11
The expression patterns of the four PDK isotypes in human tissues (PDK1, -2, -3, and -4) are different, suggesting they regulate different physiological and pathological functions.12,13 For example, PDK4 is responsible for the metabolic change in high-fat diets and diabetes,14–16 whereas PDK1 and PDK3 are involved in hypoxia-induced metabolic switch and cell survival.6–8 Inhibition of PDK1 expression impairs cell growth and increases oxygen consumption and cell death under hypoxia in human cancer cell lines.7,8,17 Knocking down PDK3 expression also reduces cell survival under hypoxia and decreases hypoxia-induced lactate production and drug resistance.6 These data suggest that PDK1 and PDK3 are potential targets for cancer therapy. Therefore, it is important to evaluate the expression profiles and medical implications of PDK1 and PDK3 in human cancer. In this study, we assessed the expression levels of PDK1 and PDK3 in colorectal cancer and determined their functional roles in promoting tumor progression and drug resistance.
Materials and Methods
Clinical Cancer Tissues
Samples from 349 patients with a diagnosis of colon cancer in National Cheng Kung University Hospital were included in this study, containing tissues from patients in all four stages, with or without recurrence or progression. Seventy-four of the samples (collected from 2008 to 2010) were used for Western blot detection of protein levels, and 275 (derived from the tissue bank of National Cheng Kung University Hospital, collected from 2004 to 2008) were used for immunohistochemical staining. Samples were taken from four regions: the tumor itself, 1 cm and 5 cm proximal to the tumor site, and 5 cm distal to the tumor site, as described previously18 for Western blot analysis. For immunohistochemical staining, paired normal and cancer tissues were used for comparison. For the survival assay, those patients who died from other causes, had a second cancer, incomplete treatment (the tumor was not completely removed after surgery), or with a survival duration less than 36 months for disease-free survival were excluded. Therefore, the total number of patients in the disease-free survival analysis was 206 (85 with recurrence and 121 without recurrence), including 31 in stage I, 59 in stage II, 79 in stage III, and 37 in stage IV. The postsurgical stage of each tumor was classified and histologically confirmed by pathologists. Human ethics approval was obtained from the clinical research ethics committee at the National Cheng Kung University Medical Center, and informed consent was given by all patients.
Isolation of Tissue Protein
Frozen tissues were ground into power in liquid nitrogen. The ground tissues were then homogenized at the highest speed in 500 μL of radioimmunoprecipitation assay lysis buffer containing protease inhibitor at 4°C for 1 minute. The solution was transferred to a 1.5-mL microcentrifuge tube and centrifuged at 12,000 × g for 10 minutes at 4°C. The supernatant was transferred to a new 1.5-mL tube, stored at −80°C, and subjected to Western blot determination.
Western Blot Analysis
An equal amount of protein was loaded into each well, separated by SDS-PAGE, and then transferred to a polyvinylidene difuoride membrane (Millipore, Billerica, MA). After transfer, the membrane was blocked with 5% skim milk at room temperature for 1 hour. The membrane was incubated with a specific antibody at 4°C overnight. After washing with washing buffer (10 mmol/L Tris-HCl, 150 mmol/L NaCl, and 0.05% Tween 20), the membrane was further incubated with horseradish peroxidase–conjugated goat anti-mouse IgG (Sigma, St Louis, MO) at 1:10,000 dilution for 1 hour at room temperature. The membrane was washed again for 1 hour with washing buffer and detected by enhanced chemiluminescence (Perkin Elmer, Boston, MA). The blots were then stripped with stripping buffer and redetected as described above using different antibodies. Specific antibodies, including anti-PDK3, anti-HIF-1α (Novus Biologicals, Littleton, CO), anti-HIF-1β (BD Biosciences, Franklin Lakes, NJ), anti-PDK1 (Stressgen, Ann Arbor, MI), and anti-vinculin (Santa Cruz Biotechnology, Santa Cruz, CA) were used in this study.
Immunohistochemistry
The procedure used was described previously.18 Anti-PDK3 antibody (Novus Biologicals) and normal rabbit IgG (Upstate Biotechnology, Lake Placid, NY) were used. After staining, the staining intensity of PDK3 was scored from 0 to 2. Each score represents a different staining result: zero, no positive signal; one, >50% of cells with weak staining; and two, >50% of cells with strong staining. All samples were independently scored by two experienced persons.
Cell Culture and Hypoxic Treatment
Human colorectal cancer cell lines (Colo320DM, HT29, and HCT116) were cultured following the suggestions by the American Type Culture Collection (Manassas, VA). After serum starvation for 16 to 18 hours, cells were cultured in fresh medium containing 10% fetal bovine serum (Biological Industries, Kibbutz Beit-Haemek, Israel) and then exposed to hypoxia in an incubator with 1% O2, 5% CO2, and 94% N2 at 37°C. The oxygen concentration was monitored with an oxygen electrode.
RNA Isolation and Real-Time RT–PCR
Total RNA was isolated from cells with TRIzol reagent (Invitrogen Life Technologies, Carlsbad, CA) according to the manufacturer's protocol. After RNA isolation, the RNA concentration was determined by the optical density at 260 nm, then 0.5 μg of total RNA was subjected to reverse transcription at 42°C for 1 hour followed by real-time PCR amplification using a thermocycler (ABI 7900; Applied Biosystems, Carlsbad, CA) as previously described.19 The data were analyzed by the program SDS 2.2 (Applied Biosystems), and human 18s rRNA was used as the internal control.
Plasmids, Transfection, and Promoter Activity Assay
The cloning of human pdk promoters and promoter activity assays were performed as described previously.6 Briefly, human pdk promoters and an internal control plasmid, pCMV-β-gal, were cotransfected into cells by Lipofectamine 2000 (Invitrogen Life Technologies) according to the manufacturer's protocol. After transfection, cells were cultured under normoxia or hypoxia for another 24 hours. Finally, cells were lysed by 100 μL of Cell Culture Lysis Reagent (Promega, Madison, WI) per well after washing twice with 1× PBS. The luciferase activity was determined according to the manufacturer's protocol with the luciferase assay system kit (Promega).
Site-Directed Mutagenesis
The wild-type HIF-1α expression vector20 was used as the template for site-directed mutagenesis to generate double-mutated and triple-mutated HIF-1α expression vectors. In double-mutated HIF-1α, proline at the 402 and 564 positions was changed to alanine, making it insensitive to oxygen-mediated proteasomal degradation, which enables this HIF-1α variant to accumulate in the nucleus even under normoxic condition. In triple-mutated HIF-1α, a third amino acid, asparagine at position 803, was also changed to alanine, which enhances transcriptional activity under normoxia. The reaction for mutagenesis contained 6 nmol of dNTP, 50 ng of human wild-type HIF-1α plasmid, 80 pmol of specific primers, and 3.75 U of pfuTurbo DNA polymerase (Stratagene, Cedar Creek, TX). The thermal cycle was 95°C for 2 minutes followed by 18 cycles of 95°C for 30 seconds, 58°C for 1 minute, and 68°C for 9 minutes. After amplification, 12 U of DpnI (New England BioLabs, Ipswich, MA) were added to the PCR product and incubated at 37°C for 3 hours. Finally, the DpnI activity was removed by heating the sample at 80°C for 20 minutes.
siRNAs
The commercial small interfering RNAs (siRNAs) against human PDK3, HIF-1α, HIF-2α, and GC content–matched scrambled control (Invitrogen Life Technologies) used in this study were the same as described previously.6 After plating, colo320DM cells were transfected with different siRNAs at a final concentration of 40 nmol/L by Lipofectamine 2000 (Invitrogen Life Technologies) according to the manufacturer's protocol.
TUNEL Assay
TUNEL assay was performed followed the procedure described previously.6 After staining, the numbers of apoptotic and nonapoptotic cells in nine randomly chosen microscope fields in each sample were counted. In each experiment, at least 1000 cells were counted to determine the percentage of apoptotic nuclei.
Statistical Analysis
Data are shown as mean ± SEM. All statistical analysis was performed by GraphPad Prism 4.02 (GraphPad Software, La Jolla, CA). Student's t-test was used to compare differences between normal and tumor groups. Differences between cell-line treatment groups were analyzed using one-way or two-way analysis of variance followed by post-test analysis. The relationship of PDK3 expression to various prognostic factors was analyzed by the Pearson χ2 test. Survival analysis was performed by the method of Kaplan and Meier. Significant difference was set at P < 0.05.
Results
PDK3, but Not PDK1, Levels Are Increased in Colorectal Cancer
To evaluate the role of PDK1 and PDK3 in cancer progression, we first assessed the PDK1 and PDK3 levels in paired normal and colorectal cancer tissues (n = 74) by Western blot analysis. Samples from cancer, normal tissues at 5 and 1 cm proximal to the cancer (P5 and P1, respectively), and 5 cm distal to the cancer (D5) were analyzed. We found that the levels of PDK1 and PDK3 in the three normal regions did not differ (Figure 1A). Therefore, only the levels in D5 normal tissue and cancer were compared. The PDK3 level was low in D5 but was increased in cancer (Figure 1, A and B). Surprisingly, the PDK1 level was decreased in the cancer compared to the normal counterparts (Figure 1, A and B).
Figure 1.
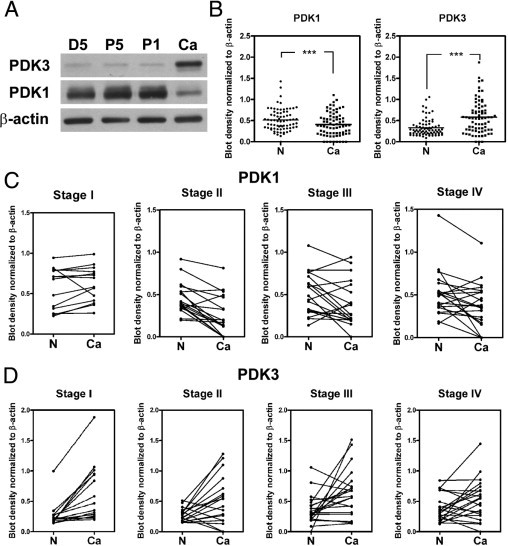
PDK3 is overexpressed in colon cancer. A: Representative Western blot shows the levels of PDK1 and PDK3 in four different tissues collected from the same individual. D5: 5 cm distal of tumor; P5 and P1: 5 cm and 1 cm proximal of tumor, respectively; Ca, cancer. B: Levels of PDK1 and PDK3 in 74 paired normal (N) and colon cancer (Ca) tissues detected by Western blot analysis. The bar indicates the medium of the ratio. ***P < 0.001. C and D: The levels of PDK1 (C) and PDK3 (D) in paired normal (N) and cancer regions in each stage of cancer. Stage I, n = 15; stage II, n = 18; stage III, n = 20; stage IV, n = 21. P values were calculated by paired t-test. For PDK1, stage I: P = 0.2514; stage II: P < 0.001; stage III: P = 0.037; stage IV: P = 0.024. For PDK3, stage I: P < 0.001; stage II: P = 0.014; stage III: P = 0.012; stage IV: P = 0.049.
The levels of PDK1 and PDK3 were further analyzed according to the stage of cancer. The PDK1 levels did not differ between normal and stage I cancer but were decreased in stages II, III, and IV (Figure 1C). In contrast, the PDK3 levels were up-regulated in cancers of all stages (Figure 1D).
PDK3 Levels Positively Associate with Malignancy
Having shown that the level of PDK1 was decreased in most cancer samples, we then focused on characterizing the PDK3 level in normal and cancer tissues. Another set of samples consisting of 275 paired normal and cancerous samples was assessed by immunohistochemical staining and analyzed. The expression of PDK3 did not differ in the stromal cells of normal and cancerous colon tissues (Figure 2A). In contrast, PDK3 levels in the epithelial cells were higher in cancer than in normal samples. Among the 275 samples, 185 (67.3%) were PDK3-negative in normal epithelial cells, and 65 (23.6%) were negative in cancer cells (Figure 2, A and B). When PDK3 levels were compared within the same individual, 169 (61.5%) samples showed an increase in immunoreactivity in cancer cells compared to their normal counterparts (Figure 2, A and B). The up-regulation of PDK3 was evident in sections containing both normal and cancer cells (Figure 2C). When data were further analyzed according to the cancer stage, the positive rates of PDK3 immunoreactivity were 70.5% (stage I), 77.9% (stage II), 75.3% (stage III), and 81.3% (stage IV) (Figure 2D). More importantly, the percentage of cancer cells with strong immunoreactivity increased from 27.3% in stage I to 45.8% in stage IV (Figure 2D).
Figure 2.
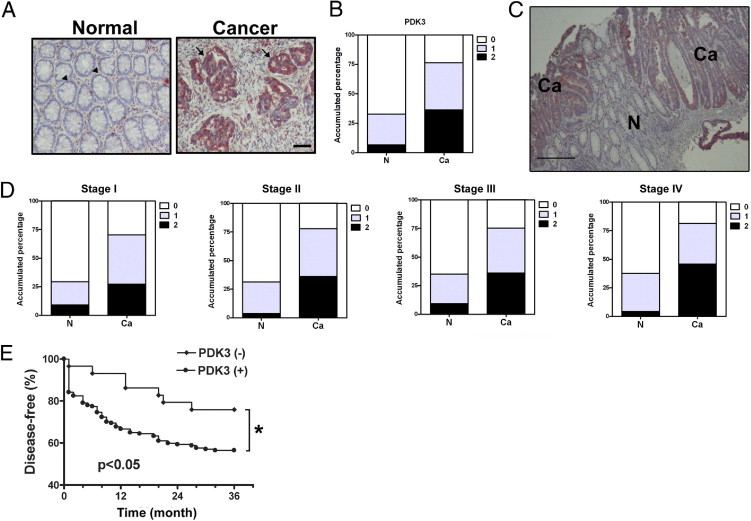
Overexpression of PDK3 in colon cancer is associated with early recurrence. The level of PDK3 in 275 patients' tissues was evaluated by immunohistochemical staining. A: Representative pictures show immunoreactivity of PDK3 in normal (N) and cancerous (Ca) of tissues from one patient. Scale bar = 100 μm. Arrowheads indicate normal epithelial cells with PDK3-negative staining; Arrows indicate cancerous epithelial cells with PDK3 positive staining. B: Accumulated percentage of PDK3 immunoreactivity in normal or cancer regions of 275 samples. The staining intensity of PDK3 was scored from 0 to 2. 0: no positive signal; 1: >50% of cells with weak staining; and 2: >50% of cells with strong staining. C: A representative figure shows the staining of PDK3 in the normal (N) and cancerous (Ca) part within the same tissue section. Scale bar = 200 μm. D: Percentage of PDK3 staining intensity in each stage. Stage I, n = 44; stage II, n = 86; stage III, n = 97; stage IV, n = 48. E: Figure shows percentage of patients with recurrent cancer after surgery and treatment within 3 years. Only patients who had been followed up for at least 36 months were included in this analysis. Numbers of patients analyzed were: PDK3 (+): 177, PDK3 (−): 29. *P < 0.05 by Kaplan-Meier analytic method.
Next, we analyzed the clinical impact of PDK3 on disease severity and time to recurrence. The results showed that the PDK3 level was positively correlated with the tumor stage (see Supplemental Table S1 at http://ajp.amjpathol.org). In addition, patients with PDK3 expression relapsed earlier than those without PDK3 expression (Figure 2E).
PDK3 Expression in Colon Cancer Positively Associates with HIF-1α Level
HIF-1α is elevated in many solid cancers; therefore, we aimed to characterize whether there is a correlation between HIF-1α and aberrant expression of PDK3 in colon cancer. First, the protein levels of HIF-1α in colorectal cancer tissue were determined by Western blot analysis (n = 74). The expression of HIF-1α was much higher in the tumor than in the normal tissue, whereas HIF-1β expression did not differ between normal and tumor tissues (Figure 3, A and B). Moreover, we found that the HIF-1α level was greater in the tumor than in the normal tissue at all four stages (Figure 3C).
Figure 3.
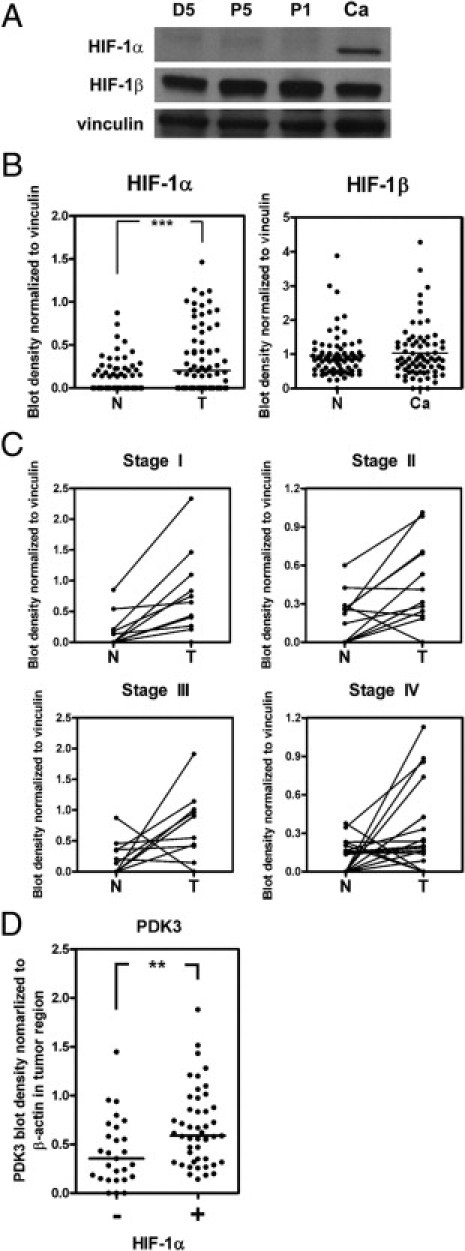
Elevation of PDK3 is positively correlated with increased HIF-1α level in colon cancer. A: Representative Western blot shows the levels of HIF-1α, HIF-1β, and vinculin in four different tissues collected from the same individual. D5: 5 cm distal of cancer region; P5 and P1: 5 cm and 1 cm proximal of cancer, respectively; Ca, cancer. B:Levels of HIF-1α and HIF-1β in 74 paired normal (N) and colon cancer (Ca) tissues detected by Western blot analysis. The bar indicates the medium of blot density. ***P < 0.001. C: The levels of HIF-1α in paired normal (N) and cancer (Ca) regions in each stage of cancer. Stage I, n = 15; stage II, n = 18; stage III, n = 20; stage IV, n = 21. P values were calculated by paired t-test. Stage I: P = 0.01; stage II: P = 0.013; stage III: P = 0.037; stage IV: P = 0.029. D: The ratios (cancer to normal) of PDK3 determined by Western blot analysis were shown according to the presence or absence of HIF-1α. Forty-seven HIF-1α–positive (+) and 27 HIF-1α–negative (−) samples were analyzed. **P < 0.01, calculated by paired t-test.
Next, we analyzed the correlation between HIF-1α and PDK3 expression in the same patient. Because 36.5% of cancer cells had no detectable HIF-1α levels, samples were therefore grouped according to the presence or absence of HIF-1α. Results demonstrated that the increase of PDK3 was greater in HIF-1α–positive cancer cells (Figure 3D), suggesting that elevated expression of PDK3 in colorectal cancer may be mediated by HIF-1α.
PDK1 and PDK3 Expression Is Induced by HIF-1α in Colorectal Cancer Cell Lines
Previous data demonstrated that both PDK1 and PDK3 are induced by hypoxia in a HIF-1α–dependent manner in other cancer cell lines.6–8 Since we observed an elevation of PDK3, but not PDK1, in colon cancer samples, we then tested the effects of HIF-1α on both PDK1 and PDK3 in colon cancer cell lines. In agreement with a previous report,6 promoter activity assays demonstrated that hypoxia markedly induced the transcription of PDK1 and PDK3, but not PDK2 and PDK4 (Figure 4A). In addition, both PDK1 and PDK3 mRNAs were up-regulated by hypoxia in the three colon cancer cell lines tested (Figure 4B). To demonstrate that hypoxia-mediated PDK1 and PDK3 up-regulation is HIF-dependent, desferroxamine (DFO), a chemical that inhibits HIF-1α protein degradation, was added to culture medium. As shown in Figure 4C, treatment with DFO markedly induced PDK1 and PDK3 mRNA expression in colo320DM cells.
Figure 4.
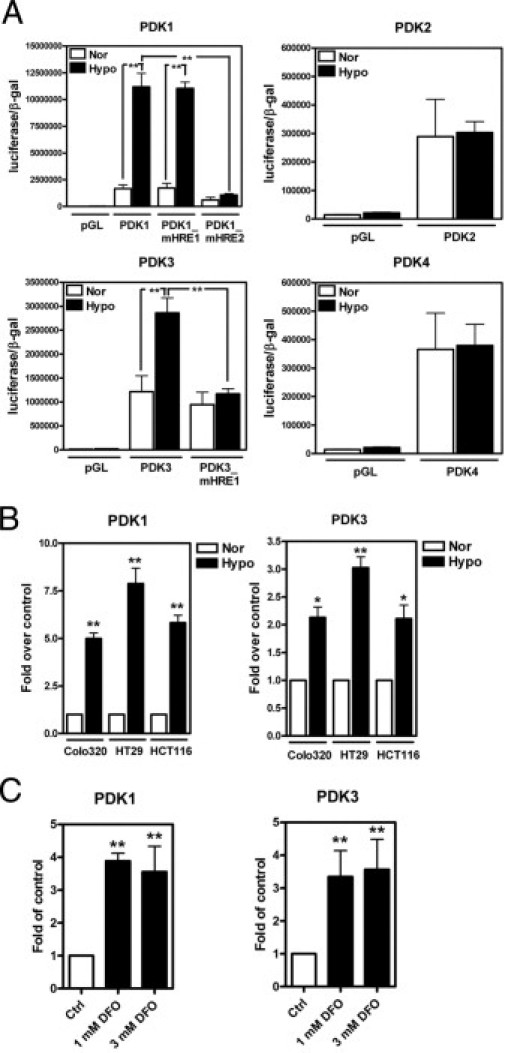
PDK1 and PDK3 are induced by hypoxia in colorectal cancer cell lines. A: Colo320DM cells were transiently transfected with control plasmid (pGL), one of the PDK1, -2, -3, and -4 promoter reporter constructs, and an internal control plasmid containing β-galactosidase (β-gal) and then cultured under normoxia (21% O2, Nor) or hypoxia (1% O2, Hypo) for 24 hours. The promoter activity was shown as luciferase activity normalized to the β-gal. Data are shown as the mean and SEM from three independent experiments performed in duplicate. HRE, hypoxia response element; mHRE, mutant HRE that prevents HIF-1 binding. B and C: Colorectal cancer cell lines were cultured under normoxic or hypoxic condition (B) or treated with different doses of desferrioxamine (DFO) under normoxic condition (C) for 16 hours. The levels of PDK1 and PDK3 were determined by real-time RT-PCR, and all values were normalized to the control normoxic group. Data show mean and SEM from three independent experiments. *P < 0.05, **P < 0.01.
Although HIF-1α and HIF-2α both recognize the same binding element, they regulate distinct sets of gene expression. To understand which HIF is responsible for up-regulating PDK1 and PDk3 expression in colon cancer cells, colo320DM cells were transiently transfected with siRNA to knock down HIF-1α and/or HIF-2α and then incubated under normoxia or hypoxia for 24 hours. Results showed that knockdown of HIF-1α reversed the hypoxia-induced PDK1 and PDK3 expression, whereas knockdown of HIF-2α had no effect (Figure 5, A and B). To further confirm this result, colo320DM, HT29, and HCT116 cells were transiently transfected with wild-type (wt), P402A/P564A double-mutated (dm), or P402A/P564A/N803A triple-mutated (tm) HIF-1α under normoxia. The results showed that levels of PDK1 and PDK3 were increased in cells transfected with the wild type under normoxia (Figure 5C). However, since the HIF-1α-dm and HIF-1α-tm proteins are oxygen insensitive, the transfected cells showed greater PDK induction than HIF-1α-wt (Figure 5C). Taken together, these data demonstrate that both PDK1 and PDK3 are induced by HIF-1α in colorectal cancer cells.
Figure 5.
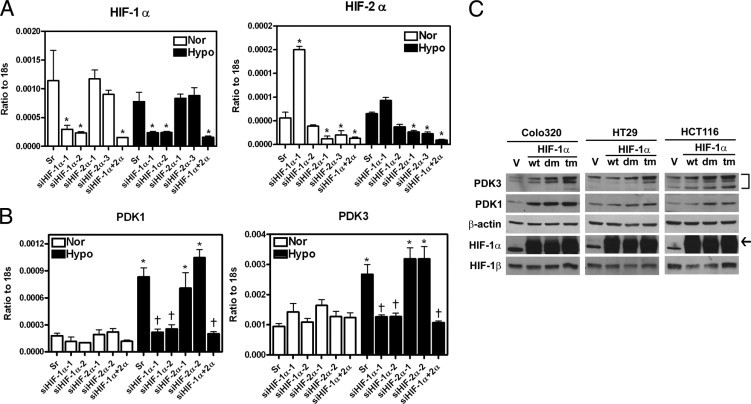
Expression of PDK1 and PDK3 are up-regulated by HIF-1α, but not HIF-2α. A: Several different siRNAs against HIF-1α (siHIF-1α-1 and -2) or HIF-2α (siHIF-2α-1 and -3) and GC content–matched scramble control (Sr) were transiently transfected into colo320 DM cells. After 6 hours, cells were incubated at normoxic or hypoxic condition for 24 hours. The levels of HIF-1α and HIF-2α were quantified by real-time RT-PCR, and all values were normalized to 18s ribosomal RNA (18s). Data show mean and SEM for three independent experiments. B: Data show means and SEM of PDK1 and PDK3 transcripts in HIF-1α and/or HIF-2α knockdown cells from three independent experiments. *P < 0.05 compared to the same siRNA-treated normoxia group, †P < 0.05 compared to hypoxia scramble siRNA-treated group. C: Three colon cancer cell lines, colo320DM, HT29, and HCT116, were force expressed with pcDNA control vector (V), wild type (wt), double-mutated (dm, P402A/P564A), and triple-mutated (tm, P402A/P564A/N803A) HIF-1α expression plasmids and incubated in normoxia for 24 hours. The levels of PDK3, PDK1, HIF-1α, and HIF-1β were determined by Western blot analysis. Arrow indicates the specific HIF-1α band.
Elevated Expression of PDK3 by Hypoxia Inhibits Drug-Induced Apoptosis in Colorectal Cancer Cells
So far, we have demonstrated that PDK3 was up-regulated in colon cancer and this elevation may be associated with the cancer stage. To characterize the potential mechanism of PDK3-mediated malignancy, we tested whether increased expression of PDK3 by hypoxia contributes to drug resistance and cell survival. Treatment with cisplatin, oxaliplatin, and paclitaxel dose-dependently killed colo320DM cells; however, the toxic effect was reduced when the cells were exposed to hypoxia (Figure 6A). Similar results were also seen in the other colon cancer cell lines (Figure 6B). To test whether the increased drug resistance induced by hypoxia is mediated by up-regulation of PDK3, siRNA was used to knock down PDK3 (Figure 6C). TUNEL assay demonstrated that treatment with anticancer drugs induced apoptosis (Figure 6D); however, the number of apoptotic cells was decreased when they were cultured under hypoxia (Figure 6, D and E). This protective effect of hypoxia was abolished when PDK3 was knocked down by siRNA (Figure 6, D and E). Taken together, these data demonstrate that up-regulation of PDK3 by hypoxia increased drug resistance in colorectal cancer cells.
Figure 6.
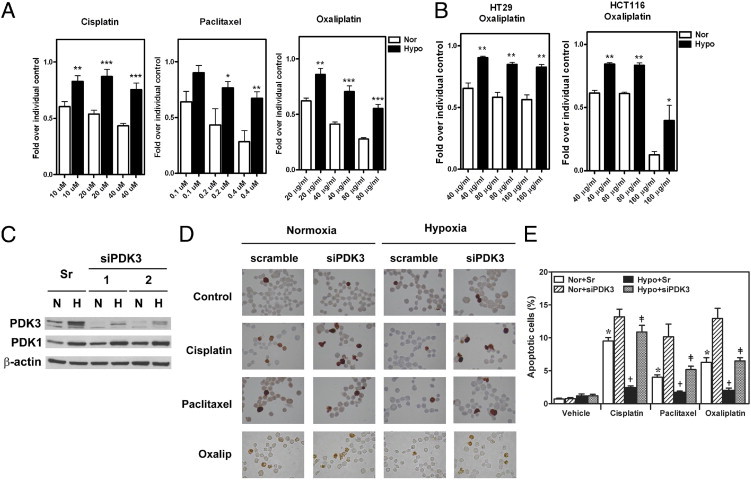
PDK3 mediates HIF-1α–induced drug resistance in colon cancer cells. A: Colo320DM cells were cultured under normoxic (Nor) or hypoxic (Hypo) condition with different doses of cisplatin, paclitaxel, or oxaliplatin as indicated for 24 hours. Cell numbers were determined by crystal violet staining. Data show means and SEM of three independent experiments. *P < 0.05; **P < 0.01; ***P < 0.001. B: HCT116 and HT29 cells were cultured under normoxic (Nor) or hypoxic (Hypo) condition and treated with different doses of oxaliplatin for 24 hours as described in panel A. *P < 0.05, **P < 0.01. C: Representative Western blot shows the knockdown effect of siRNA against PDK3. Levels of PDK1 and β-actin were also detected to demonstrate the specificity of siRNA. sr: GC content–matched scramble siRNA. hypoxia, H; N, normoxia. D and E: Colo320DM cells were transiently transfected with siPDK3 or GC content–matched scramble siRNA (Sr) and followed by treatment with 40 μmol/L cisplatin, 0.4 μmol/L paclitaxel, or 40 μg/mL oxaliplatin under normoxic or hypoxic condition for 24 hours. Representative figures of TUNEL assay results were shown in panel D and the percentages of apoptotic cells in each treatment were shown in panel E. *P < 0.05 compared to normoxia, scramble RNAi, and vehicle-treated groups; †P < 0.05 compared to normoxia, scramble RNAi, and drug-treated groups; ‡P < 0.05 compared to hypoxia, scramble RNAi, and drug-treated groups.
Discussion
The switch of glucose metabolism from oxidative phosphorylation to aerobic glycolysis is a hallmark of cancer, which plays an important role in the survival of cancer cells and the malignancy of cancer. However, the factors contributing to this metabolic switch remain largely uncharacterized. Herein, we found the level of PDK3, the enzyme that controls the switch of glucose metabolism by phosphorylation, and thus inactivation of PDH, was overexpressed in colorectal cancers and was positively correlated with the HIF-1α level. Further analysis revealed that PDK3 expression was positively correlated with disease severity and early recurrence. In vitro assay demonstrated that PDK3 expression was induced by HIF-1α and that increased PDK3 expression contributed to the hypoxia-induced drug resistance in cancer cells. These data provide novel information for dissecting the molecular mechanism responsible for the metabolic switch and increased drug resistance during cancer progression, and suggest that PDK3 is a potential therapeutic target for colorectal cancer.
Metabolic switch is a critical step to acquire survival advantage under hypoxic conditions. Previous studies identified that expression of PDK1 and PDK3 were induced by hypoxia, and both PDK1 and PDK3 were important for induction of the metabolic switch and increased drug resistance in cancer cell lines.6–8 These results suggest that HIF-1–induced PDK1 and PDK3 expression may be essential for tumorigenesis. However, the functional role of PDK1 and PDK3 in clinical cancer tissues has not been clearly characterized before. The expression profile of PDK1 in cancer samples has been evaluated in two independent studies, but the results were not correlated well with HIF-1α level or the cancer stages.21,22 In head and neck squamous cell cancer, expression of PDK1 was increased in cancer cells but was not associated with HIF-1α level.22 In non-small cell lung cancer, the expression of PDK1 was even lower compared to its normal counterpart.21 By using paired normal and cancer samples, our data demonstrated that PDK1 was usually down-regulated in colorectal carcinoma. When samples were further grouped according to the pathological stages, we found that the level of PDK1 was not different between normal and cancer tissues in stage I but was significantly decreased in cancer cells in more advanced stages. Considering that aerobic glycolysis is more evident in malignant cancer, the decrease of PDK1 in cancer cells of severe stages suggests that PDK3 may play an important role in controlling metabolic switch during cancer progression.
The mechanism responsible for down-regulation of PDK1 in cancer cells of more advanced stages is not known. The levels of HIF-1α protein were elevated in cancer tissues of all stages. In vitro study using several colon cancer cell lines also demonstrated that hypoxia and overexpression of HIF-1α markedly up-regulated PDK1 gene expression. These results provided evidence to demonstrate that reduced expression of PDK1 in colon cancer was not due to lack of HIF-1α expression in cancer cells or unresponsiveness of PDK1 to HIF-1α activation. Our current results and findings from previous studies21,22 suggest that the regulation of PDK1 expression in human cancer is much more complex than in the cell culture system, and more investigations are needed to explore the pathological effect of PDK1 in human cancer.
In contrast to PDK1, the expression pattern of PDK3 was consistent with its functional role. PDK3 can be detected in >76% of cancer cells with the expression level increased along with the severity of cancer stage. When compared to the normal counterpart, PDK3 levels were up-regulated in cancer cells of all stages. In addition, the PDK3 level in colon cancer samples was highly correlated with the HIF-1α level, which is consistent with the results observed in the in vitro study that PDK3 expression was induced by HIF-1α. The up-regulation of PDK3 by HIF-1α has two beneficial effects for cancer cells. First, the kinase activity and binding affinity of PDK3 is greatest among PDKs.12,23 Induction of PDK3 by HIF-1α would efficiently block the conversion of pyruvate to acetyl-CoA and reduce oxygen consumption. Thus, PDK3 serves as a gatekeeper to ensure an efficient metabolic switch. Second, it is known that a high concentration of pyruvate inhibits the activity of PDK1, -2, and -4, but not PDK3.12,24 In HIF-1α–overexpressed cancer cells, inactivation of PDH by HIF-induced up-regulation of PDKs would result in the accumulation of pyruvate, and the accumulated pyruvate would inactivate the enzymatic activities of PDK1, -2, and -4, but not PDK3. Therefore, up-regulation of PDK3 guarantees the continuous inhibition of mitochondrial respiration.
It has been known for over a decade that overexpression of HIF-1α is a common phenomenon in solid tumors and is highly associated with poor prognosis.25 Along with the complexity of HIF-1α–mediated tumor malignancy, recent studies have revealed that HIF-1α–induced metabolic switch plays an important role in drug resistance.6–8 Previous reports also show that the outcome of tumors with increased lactate production is poor,26,27 suggesting that the switch from mitochondrial oxidative respiration to cellular glycolysis plays a pivotal role in increased drug resistance. We previously demonstrated that PDK3 mediates hypoxia-induced lactate production in HeLa cells.6 In this study, we demonstrated that HIF-1α–induced PDK3 up-regulation is an important defense mechanism of colon cancer cells against anticancer drug-induced apoptosis. The in vitro data provide supportive information to explain the phenomenon seen in clinical observation that patients with positive PDK3 expression have a greater relapse incidence than those without PDK3 expression. Taken together, PDK3 represents the critical molecule that controls the metabolic switch and drug resistance in colon cancer cells.
In conclusion, given that PDK3 possesses high enzymatic activity and that high concentrations of pyruvate do not inhibit its activity,12,24 these unique features implicate the potential importance of PDK3 in the metabolic switch of cancer cells and make it a good candidate as a target for cancer therapy. Our current findings that the expression of PDK3 is increased in a great majority of colon cancer cells and that this increased PDK3 contributes to HIF-1α–induced drug resistance, provide novel insights about pathological processes of cancer cells and suggest that PDK3 may be a new and useful target for cancer therapy.
Acknowledgments
We thank the Bioinformatics Center at the National Cheng Kung University for assistance in identifying the HIF-1α binding site, Yi-Shan Yeh for the great technical assistance, and Dr. Ian Bruce for critical reading and editing of the manuscript.
Footnotes
Supported by a grant from National Research Program of Genome Medicine (NSC99-3112-B-006-010) and in part by a Top University grant of NCKU (A0123).
Supplemental material for this article can be found at http://ajp.amjpathol.org or at doi:10.1016/j.ajpath.2011.05.050.
Contributor Information
Jenq-Chang Lee, Email: jclee@mail.ncku.edu.tw.
Shaw-Jenq Tsai, Email: seantsai@mail.ncku.edu.tw.
Supplementary data
References
- 1.Wolpin B.M., Mayer R.J. Systemic treatment of colorectal cancer. Gastroenterology. 2008;134:1296–1310. doi: 10.1053/j.gastro.2008.02.098. [DOI] [PMC free article] [PubMed] [Google Scholar]
- 2.Warburg O. The Metabolism of Tumours: Investigations from the Kaiser Wilhelm Institute for Biology. In: Warburg O., editor. Constable & Co., Ltd; London: 1930. p. 327. [Google Scholar]
- 3.Kondoh H. Cellular life span and the Warburg effect. Exp Cell Res. 2008;314:1923–1928. doi: 10.1016/j.yexcr.2008.03.007. [DOI] [PubMed] [Google Scholar]
- 4.Gillies R.J., Raghunand N., Garcia-Martin M.L., Gatenby R.A. pH imaging: A review of pH measurement methods and applications in cancers. IEEE Eng Med Biol Mag. 2004;23:57–64. doi: 10.1109/memb.2004.1360409. [DOI] [PubMed] [Google Scholar]
- 5.Gillies R.J., Raghunand N., Karczmar G.S., Bhujwalla Z.M. MRI of the tumor microenvironment. J Magn Reson Imaging. 2002;16:430–450. doi: 10.1002/jmri.10181. [DOI] [PubMed] [Google Scholar]
- 6.Lu C.W., Lin S.C., Chen K.F., Lai Y.Y., Tsai S.J. Induction of pyruvate dehydrogenase kinase-3 by hypoxia-inducible factor-1 promotes metabolic switch and drug resistance. J Biol Chem. 2008;283:28106–28114. doi: 10.1074/jbc.M803508200. [DOI] [PMC free article] [PubMed] [Google Scholar]
- 7.Kim J.W., Tchernyshyov I., Semenza G.L., Dang C.V. HIF-1-mediated expression of pyruvate dehydrogenase kinase: a metabolic switch required for cellular adaptation to hypoxia. Cell Metab. 2006;3:177–185. doi: 10.1016/j.cmet.2006.02.002. [DOI] [PubMed] [Google Scholar]
- 8.Papandreou I., Cairns R.A., Fontana L., Lim A.L., Denko N.C. HIF-1 mediates adaptation to hypoxia by actively downregulating mitochondrial oxygen consumption. Cell Metab. 2006;3:187–197. doi: 10.1016/j.cmet.2006.01.012. [DOI] [PubMed] [Google Scholar]
- 9.Kato M., Wynn R.M., Chuang J.L., Tso S.C., Machius M., Li J., Chuang D.T. Structural basis for inactivation of the human pyruvate dehydrogenase complex by phosphorylation: role of disordered phosphorylation loops. Structure. 2008;16:1849–1859. doi: 10.1016/j.str.2008.10.010. [DOI] [PMC free article] [PubMed] [Google Scholar]
- 10.Patel M.S., Korotchkina L.G. Regulation of mammalian pyruvate dehydrogenase complex by phosphorylation: complexity of multiple phosphorylation sites and kinases. Exp Mol Med. 2001;33:191–197. doi: 10.1038/emm.2001.32. [DOI] [PubMed] [Google Scholar]
- 11.Roche T.E., Hiromasa Y. Pyruvate dehydrogenase kinase regulatory mechanisms and inhibition in treating diabetes, heart ischemia, and cancer. Cell Mol Life Sci. 2007;64:830–849. doi: 10.1007/s00018-007-6380-z. [DOI] [PMC free article] [PubMed] [Google Scholar]
- 12.Bowker-Kinley M.M., Davis W.I., Wu P., Harris R.A., Popov K.M. Evidence for existence of tissue-specific regulation of the mammalian pyruvate dehydrogenase complex. Biochem J. 1998;329(Pt 1):191–196. doi: 10.1042/bj3290191. [DOI] [PMC free article] [PubMed] [Google Scholar]
- 13.Gudi R., Bowker-Kinley M.M., Kedishvili N.Y., Zhao Y., Popov K.M. Diversity of the pyruvate dehydrogenase kinase1 gene family in humans. J Biol Chem. 1995;270:28989–28994. doi: 10.1074/jbc.270.48.28989. [DOI] [PubMed] [Google Scholar]
- 14.Wu P., Inskeep K., Bowker-Kinley M.M., Popov K.M., Harris R.A. Mechanism responsible for inactivation of skeletal muscle pyruvate dehydrogenase complex in starvation and diabetes. Diabetes. 1999;48:1593–1599. doi: 10.2337/diabetes.48.8.1593. [DOI] [PubMed] [Google Scholar]
- 15.Holness M.J., Kraus A., Harris R.A., Sugden M.C. Targeted upregulation of pyruvate dehydrogenase kinase (PDK)-4 in slow-twitch skeletal muscle underlies the stable modification of the regulatory characteristics of PDK induced by high-fat feeding. Diabetes. 2000;49:775–781. doi: 10.2337/diabetes.49.5.775. [DOI] [PubMed] [Google Scholar]
- 16.Holness M.J., Sugden M.C. Regulation of pyruvate dehydrogenase complex activity by reversible phosphorylation. Biochem Soc Trans. 2003;31:1143–1151. doi: 10.1042/bst0311143. [DOI] [PubMed] [Google Scholar]
- 17.McFate T., Mohyeldin A., Lu H., Thakar J., Henriques J., Halim N.D., Wu H., Schell M.J., Tsang T.M., Teahan O., Zhou S., Califano J.A., Jeoung N.H., Harris R.A., Verma A. Pyruvate dehydrogenase complex activity controls metabolic and malignant phenotype in cancer cells. J Biol Chem. 2008;283:22700–22708. doi: 10.1074/jbc.M801765200. [DOI] [PMC free article] [PubMed] [Google Scholar]
- 18.Chien C.W., Lin S.C., Lai Y.Y., Lin B.W., Lee J.C., Tsai S.J. Regulation of CD151 by hypoxia controls cell adhesion and metastasis in colorectal cancer. Clin Cancer Res. 2008;14:8043–8051. doi: 10.1158/1078-0432.CCR-08-1651. [DOI] [PubMed] [Google Scholar]
- 19.Chuang P.C., Sun H.S., Chen T.M., Tsai S.J. Prostaglandin E2 induces fibroblast growth factor 9 via EP3-dependent protein kinase Cdelta and Elk-1 signaling. Mol Cell Biol. 2006;26:8281–8292. doi: 10.1128/MCB.00941-06. [DOI] [PMC free article] [PubMed] [Google Scholar]
- 20.Chen K.F., Lai Y.Y., Sun H.S., Tsai S.J. Transcriptional repression of human cad gene by hypoxia inducible factor-1alpha. Nucleic Acids Res. 2005;33:5190–5198. doi: 10.1093/nar/gki839. [DOI] [PMC free article] [PubMed] [Google Scholar]
- 21.Koukourakis M.I., Giatromanolaki A., Sivridis E., Gatter K.C., Harris A.L. Pyruvate dehydrogenase and pyruvate dehydrogenase kinase expression in non small cell lung cancer and tumor-associated stroma. Neoplasia. 2005;7:1–6. doi: 10.1593/neo.04373. [DOI] [PMC free article] [PubMed] [Google Scholar]
- 22.Wigfield S.M., Winter S.C., Giatromanolaki A., Taylor J., Koukourakis M.L., Harris A.L. PDK-1 regulates lactate production in hypoxia and is associated with poor prognosis in head and neck squamous cancer. Br J Cancer. 2008;98:1975–1984. doi: 10.1038/sj.bjc.6604356. [DOI] [PMC free article] [PubMed] [Google Scholar]
- 23.Tuganova A., Boulatnikov I., Popov K.M. Interaction between the individual isoenzymes of pyruvate dehydrogenase kinase and the inner lipoyl-bearing domain of transacetylase component of pyruvate dehydrogenase complex. Biochem J. 2002;366(Pt 1):129–136. doi: 10.1042/BJ20020301. [DOI] [PMC free article] [PubMed] [Google Scholar]
- 24.Baker J.C., Yan X., Peng T., Kasten S., Roche T.E. Marked differences between two isoforms of human pyruvate dehydrogenase kinase. J Biol Chem. 2000;275:15773–15781. doi: 10.1074/jbc.M909488199. [DOI] [PubMed] [Google Scholar]
- 25.Zhong H., De Marzo A.M., Laughner E., Lim M., Hilton D.A., Zagzag D., Buechler P., Isaacs W.B., Semenza G.L., Simons J.W. Overexpression of hypoxia-inducible factor 1alpha in common human cancers and their metastases. Cancer Res. 1999;59:5830–5835. [PubMed] [Google Scholar]
- 26.Brizel D.M., Schroeder T., Scher R.L., Walenta S., Clough R.W., Dewhirst M.W., Mueller-Klieser W. Elevated tumor lactate concentrations predict for an increased risk of metastases in head-and-neck cancer. Int J Radiat Oncol Biol Phys. 2001;51:349–353. doi: 10.1016/s0360-3016(01)01630-3. [DOI] [PubMed] [Google Scholar]
- 27.Walenta S., Salameh A., Lyng H., Evensen J.F., Mitze M., Rofstad E.K., Mueller-Klieser W. Correlation of high lactate levels in head and neck tumors with incidence of metastasis. Am J Pathol. 1997;150:409–415. [PMC free article] [PubMed] [Google Scholar]
Associated Data
This section collects any data citations, data availability statements, or supplementary materials included in this article.