

Abstract
In our previous studies, resolution of granulomatous experimental autoimmune thyroiditis (G-EAT) was promoted when thyroid epithelial cells were protected from Fas-mediated apoptosis due to transgenic overexpression of FLIP. We hypothesized that if FLIP were overexpressed on lymphocytes, CD4+ effector cells would be protected from Fas-mediated apoptosis, and resolution would be delayed. To test this hypothesis, we generated transgenic (Tg) mice overexpressing FLIP under the CD2 promoter. Transgenic FLIP was expressed on CD4+ and CD8+ T cells and B cells. Transgenic overexpression of FLIP protected cultured splenocytes from Fas-mediated, but not irradiation-induced, apoptosis in vitro. Unexpectedly, Tg+ donor cells transferred minimal G-EAT, which was partially overcome by depleting donor CD8+ T cells. When Tg+ and Tg− donors transferred equivalent disease, G-EAT resolution was delayed in FLIP transgenic mice. However, CD2-FLIP Tg+ donors often transferred less severe G-EAT, even after depletion of CD8+ T cells. This influenced the rate of G-EAT resolution, resulting in little difference in G-EAT resolution between groups. Tg+ mice always had reduced anti-mouse thyroglobulin autoantibody responses, compared with Tg− littermates, presumably because of FLIP overexpression on B cells. These results suggest that effects of transgenic FLIP on a particular autoimmune disease vary, depending on what cells express the transgene and whether those cells are effector cells or if they function to modulate disease.
Experimental autoimmune thyroiditis (EAT) is a chronic inflammatory autoimmune disease that can be induced in genetically susceptible strains of mice by injecting mouse thyroglobulin (MTg) and adjuvant1,2 or by transferring MTg-primed donor spleen cells activated with MTg in vitro.2,3 A severe granulomatous form of EAT (G-EAT) is induced when MTg-sensitized donor spleen cells are activated in vitro with MTg and IL-124,5 or with MTg and IL-23 (unpublished data). Thyroid lesions in G-EAT are characterized by infiltration of inflammatory cells and destruction of thyroid epithelial cells.4–7 DBA/1 and CBA/J mice, used in most G-EAT experiments in our laboratory, develop severe G-EAT when donor cells are activated with MTg and IL-12.3–7 Thyroid lesions reach maximal severity 20 days after cell transfer, and inflammation either resolves or progresses to fibrosis at day 50 to day 60, depending on the extent of damage at day 20.3–7 DBA/1 recipients typically develop very severe thyroid lesions (5+ severity score) by day 20, with few or no remaining intact follicles, and inflammation and fibrosis persist 60 days after cell transfer.4–7 CBA/J recipients also develop very severe G-EAT, but there are usually some intact thyroid follicles, less neutrophil infiltration, and less fibrosis at day 20, compared with lesions in DBA/1 mice. Thyroid lesions in CBA/J mice usually resolve by 50 to 60 days after cell transfer.8 CD4+ T cells are the primary effector cells for G-EAT.4
The Fas/FasL apoptotic pathway plays an important role in many human and murine autoimmune diseases, including Graves' disease, Hashimoto's thyroiditis, and EAT or G-EAT in mice.9–17 The anti-apoptotic molecule FLIP (FLICE inhibitory protein FLIP; FLICE is the Fas-associated death domain-like IL-1β-converting enzyme) inhibits Fas-mediated apoptosis by blocking activation of caspase-8.18,19 The Fas/FasL pathway can function to both induce autoimmune damage13,14 and reduce autoimmune responses.11,12,17
Our previous studies showed that resolution of G-EAT involves apoptosis of CD4+ effector cells mediated, at least in part, through the Fas/FasL pathway by FasL expressing thyrocytes.17 Expression of transgenic FLIP on thyroid epithelial cells promotes earlier resolution of G-EAT by protecting thyroid epithelial cells from Fas-mediated apoptosis.20,21 Because CD4+ T cells are the primary effector cells for G-EAT, we hypothesized that if transgenic FLIP were expressed on lymphocytes, CD4+ effectors would be protected from Fas-mediated apoptosis, and resolution would be inhibited, resulting in chronic inflammation. Transgenic (Tg) mice overexpressing FLIP under the CD2 promoter were generated to test this hypothesis.
Materials and Methods
Generation of cFLIPL Transgenic DBA/1 and DBA/CBA F1 Mice
The plasmid containing the recombinant FLIP-CD2 construct was provided by Dr. Ralph Budd (University of Vermont).22 The recombinant construct was constructed by inserting FLAG-tagged mouse cFLIPL cDNA into pBSK II vector containing the β-globin promoter and a downstream human CD2 locus enhancer element. The plasmid was amplified in Escherichia coli and digested using KpnI and NotI (Invitrogen, Carlsbad, CA). The 8.55-kb recombined construct fragment containing FLAG-tagged mouse cFLIPL cDNA, β-globin, and CD2 enhancer was microinjected into fertilized oocytes from FVB female mice (Transgenic Core Facility, University of Missouri, Columbia, MO). Transgenic founders were screened by PCR amplification of tail DNA using the following primers: sense, 5′-TCAAGAGTGAGGAGGTTTGACC-3′; antisense, 5′-TCCGATTCCTGGATGGATGTC-3′. Two FVB transgenic founders were obtained (one male and one female). FVB mice, like DBA/1 mice, express the H-2q major histocompatibility complex, but are less susceptible to EAT.21 The transgenic female FVB founder was therefore crossed with an EAT-susceptible DBA/1 male, and Tg+ F1 offspring were selected by PCR amplification of tail DNA. Tg+ F1 mice were backcrossed six times to DBA/1 mice, and offspring were selected at each generation for expression of the transgene and the DBA/1 coat color. In all experiments, Tg+ mice and their Tg− littermates were used as donors and recipients of sensitized donor splenocytes. In the experiments reported here, CD2 FLIP DBA/CBA F1 mice were used as donors and recipients, because their thyroid lesions are less severe than in DBA/1 mice and their thyroid lesions generally begin to resolve 50 to 60 days after cell transfer (unpublished data). Immunohistochemistry (IHC) using rabbit anti-FLIP polyclonal antibody (Abcam, Cambridge, MA) and anti-FLAG polyclonal antibody (Abcam) and Western blot using anti-FLIP monoclonal antibody (Dave-2; Alexis Biochemicals–Enzo Life Sciences, San Diego, CA) were used to confirm that the transgene was expressed on lymphocytes, but not other cell types.
Western Blot Analysis
Western blotting was performed as described previously,21 using 30 μg of protein loaded on a 10% SDS-PAGE gel.
Confocal Laser Scanning Double-Immunofluorescence Microscopy
To detect expression of transgenic FLIP by CD4+ and CD8+ T cells and B cells and expression of active capase-3, a marker for apoptosis, dual-color immunofluorescence and confocal laser scanning microscopy were performed as described previously.21,23 Polyclonal anti-FLIP, anti-FLAG (Abcam), and active caspase-3 (BD Pharmingen, San Diego, CA) antibodies, together with rat anti-CD4, anti-CD8 or anti-B220 monoclonal antibody, were used on frozen sections of spleens. FLAG, FLIP, and active caspase-3 were visualized with Alexa Fluor 568 (red; Molecular Probes-Invitrogen, Eugene, OR). CD4, CD8, and B220 molecules were visualized by Alexa Fluor 488 (green). Slides were examined under a Radiance 2000 confocal system (Bio-Rad, Hercules, CA) coupled to an IX70 inverted microscope (Olympus, Tokyo, Japan).
Isolation of Splenic CD4+ and CD8+ T Cells and B Cells
To quantify expression of transgenic FLIP by CD4+ and CD8+ T cells and B cells, cells were isolated from spleens of Tg+ mice using phycoerythrin-labeled anti-CD4, anti-CD8, and anti-B220 monoclonal antibody (eBioscience, San Diego, CA) and an EasySep PE selection kit (STEMCELL Technologies, Vancouver, BC, Canada), as described previously.20,24 The isolated subsets of splenocytes were 90% to 95% pure, as analyzed by flow cytometry.
Sensitivity of Splenocytes to Fas-Mediated and Irradiation-Induced Apoptosis
Splenocytes from CD2 FLIP Tg+ mice and Tg− littermates were plated in 1 mL complete RPMI 1640 medium3,5 at 2 × 10⁶ cells/well in 24-well plates. In some experiments, splenocytes were irradiated at 30 Gy to induce apoptosis.25 In other experiments, splenocytes were cultured and treated with 1 μg/mL agonist anti-Fas antibody (Jo-2; BD Pharmingen) for 8, 16, and 24 hours. The amount of anti-Fas was determined to be optimal based on our preliminary studies and studies by others.26,27 Apoptosis of cultured splenocytes was determined by TUNEL assay using an ApopTag kit (Chemicon International, Temecula, CA), as described previously.23,24,26 NovaRED substrate (Vector Laboratories, Burlingame, CA) was used for color development, and slides were counterstained with hematoxylin. To quantify apoptotic cells, all cells in five or six randomly selected high-power fields (magnification, ×400) were manually counted and positive cells were expressed as a percentage of total cells.
Induction of G-EAT
DBA/CBA F1 Tg+ and Tg− littermates generated in our breeding colony were used as donors and recipients for all experiments. Donor mice were injected intravenously twice at 10-day intervals with 150 μg MTg, prepared as described previously,3 and with 15 μg lipopolysaccharide (Sigma-Aldrich, St. Louis, MO). One week later, donor spleen cells were activated in vitro with 25 μg/mL MTg and 5 ng/mL IL-12 (PeproTech, Rocky Hill, NJ) or 20 ng/mL IL-23 (eBioscience) as described previously.5 After 72 hours, cells were harvested, and 3 × 10⁷ cells were transferred intravenously syngeneic FLIP Tg+ or Tg− littermate recipients irradiated with 5 Gy. Recipient thyroids were evaluated at 19 to 21 days (the time of maximal disease severity and at 50 to 60 days after cell transfer (the time of disease resolution).5,17 All mice were bred and maintained in accordance with University of Missouri institutional guidelines for animal care. In most experiments, donors were given 300 μg anti-CD8 monoclonal antibody (ATCC HB129; American Type Culture Collection, Manassas, VA) 4 days after the second immunization with MTg and lipopolysaccharide, to deplete donor CD8+ T cells.8,28
Determination of Anti-MTg Autoantibody Responses
MTg-specific autoantibodies were determined by enzyme-linked immunosorbent assay using serum from individual mice, as described previously.3–7 Serum dilution is reported in Table 1. Normal mouse serum used at the same dilutions always gave an optical density value of OD < 0.05.
Table 1.
Lower Levels of Anti-MTg IgG Autoantibodies in Serum from Tg+ Mice Than from Tg− Littermates
| ELISA OD410 (mean ± SEM) |
||||
|---|---|---|---|---|
| Day 20 |
Day 50 |
|||
| Mice⁎ | 1/800 | 1/3200 | 1/800 | 1/3200 |
| Tg− | 1.405 ± 0.281 | 0.830 ± 0.294 | 0.604 ± 0.126 | 0.570 ± 0.155 |
| Tg+ | 0.781 ± 0.056 | 0.351 ± 0.052 | 0.412 ± 0.08 | 0.229 ± 0.060 |
| Tg− | 1.865 ± 0.172 | 0.358 ± 0.149 | 1.715 ± 0.139 | 0.265 ± 0.086 |
| Tg+ | 0.872 ± 0.274 | 0.086 ± 0.036 | 0.902 ± 0.193 | 0.188 ± 0.074† |
Evaluation of G-EAT Histopathology and Fibrosis
Thyroids were harvested from groups of six to eight FLIP Tg+ or Tg− recipients at 19 to 21 or 50 to 60 days after cell transfer. One lobe of each thyroid was fixed in formalin, and paraffin-embedded sections were stained with H&E. Thyroids were scored quantitatively for G-EAT severity, defined as the extent of thyroid follicle destruction, as described in detail elsewhere.4,5 Briefly, thyroiditis scoring was as follows: 1+, an infiltrate of at least 125 cells in one or several foci; 2+, from 10 to 20 foci of cellular infiltration involving ≤25% of the gland; 3+, from 25% to 50% of the gland is infiltrated; 4+, destruction of >50% of the gland; and 5+, virtually complete destruction of the gland, with few or no remaining follicles. Thyroid lesions were also evaluated qualitatively.23 For evaluation of collagen deposition, thyroid sections from some FLIP Tg− and Tg+ recipients were stained using Masson's trichrome.29 All slides were evaluated by at least two investigators, one of whom had no knowledge of the experimental groups. Differences in interpretation were very rare.
RT-PCR
RNA was extracted from frozen thyroid lobes from individual mice obtained 20 days after cell transfer, or from 5 × 10⁶ splenocytes cultured for 72 hours, and was reverse transcribed as described previously.21,23,24 To determine the relative initial amounts of target cDNA, each cDNA sample was serially diluted 1/5 and 1/25.21,23,24 PCR products were electrophoresed in 2% agarose gel, visualized by UV light after staining with ethidium bromide, and normalized between samples relative to levels of hypoxanthine phosphoribosyltransferase (HPRT) or β-actin using IS-1000 digital imaging system software (Alpha Innotech–Cell Biosciences, Santa Clara, CA). Primer sequences were as described previously.21,23,24
Cytokine Determination by ELISA
Culture supernatants from 72-hour cultured splenocytes were collected and frozen at −20°C. IFN-γ, IL-17, TNF-α, and IL-10 concentrations in supernatants were determined by enzyme-linked immunosorbent assay (ELISA) using mouse Ready-Set-Go ELISA kits (eBioscience), according to the manufacturer's instructions.
IHC
IHC staining for IFN-γ, TNF-α, IL-10, IL-5, and CD4 was performed as described previously.23 After fixation and blocking, frozen thyroid sections were incubated with rat anti-IFN-γ (XMG1.2; ATCC), rabbit anti-TNF-α (Santa Cruz Biotechnology, Santa Cruz, CA), goat anti-IL-10 (Santa Cruz Biotechnology), rabbit anti-IL-5 (Santa Cruz Biotechnology), rat anti-CD4 (GK1.5; ATCC), and rat anti-CD8 (53.6; ATCC) antibodies for 60 minutes at room temperature. After incubation with the corresponding secondary biotinylated antibody (Jackson ImmunoResearch, West Grove, PA), immunoreactivity was demonstrated using the avidin-biotin complex immunoperoxidase system (Vector Laboratories) and developed using NovaRED substrate (Vector Laboratories) as the chromogen. Slides were counterstained with hematoxylin. As a negative control, primary antibody was replaced with an equal amount of normal rabbit, rat, or goat IgG; these controls were always negative. Positive cells were counted using MetaMorph software version 6.3r6 (Molecular Devices, Sunnyvale, CA) and expressed as a percentage of total cells.
Statistical Analysis
All experiments were repeated at least twice. Statistical analysis of data were performed using an unpaired two-tailed Student's t-test or Wilcoxon rank sum test. A P value of <0.05 was considered significant.
Results
Generation of FLIP Transgenic Mice and Expression of FLIP by CD4+ and CD8+ T Cells and B Cells
Our earlier studies showed that transgenic overexpression of FLIP by thyroid epithelial cells promotes early resolution of G-EAT. Based on these and other results, we hypothesized that overexpression of FLIP by lymphocytes would inhibit G-EAT resolution resulting in chronic inflammation.20,21 To test this hypothesis, transgenic mice expressing mouse cFLIPL under the control of a β-globin promoter and the downstream human CD2 enhancer element were generated (Figure 1A). A single FVB transgenic founder female was crossed with a major histocompatibility complex-compatible EAT-susceptible DBA/1 male, and the Tg+ offspring were backcrossed to DBA/1 for six generations, as described under Materials and Methods. Western blot analysis (Figure 1B) indicated that FLIP transgenic mice expressed the transgene at levels more than fivefold higher than endogenous FLIP. Previous studies with CD2 FLIP transgenic C57BL/6 mice generated using the same construct as used here22 or a similar construct27 showed that transgenic FLIP is overexpressed by T cells, but is not expressed by B cells, even though CD2 is expressed by both T and B cells.30,31 To determine which cells express the transgene in DBA/1 CD2 FLIP transgenic mice, FLIP expression levels (endogenous and/or transgenic) of isolated CD4+ and CD8+ T cells and B cells from spleens of transgenic mice were examined by confocal microscopy, RT-PCR, and Western blot. FLAG-tagged FLIP (transgenic) was expressed in both CD4+ and CD8+ T cells, and also in B cells (Figure 1, C–E), and the level of expression of the transgene was similar for all three cell types (Figure 1, D and E). Splenic B cells in FLIP transgenic mice also expressed endogenous FLIP (Figure 1E), whereas endogenous FLIP was not detected in normal CD4+ or CD8+ T cells. Neither FLIP nor FLAG was detected in thyroids of naïve Tg− mice by IHC staining (data not shown).
Figure 1.
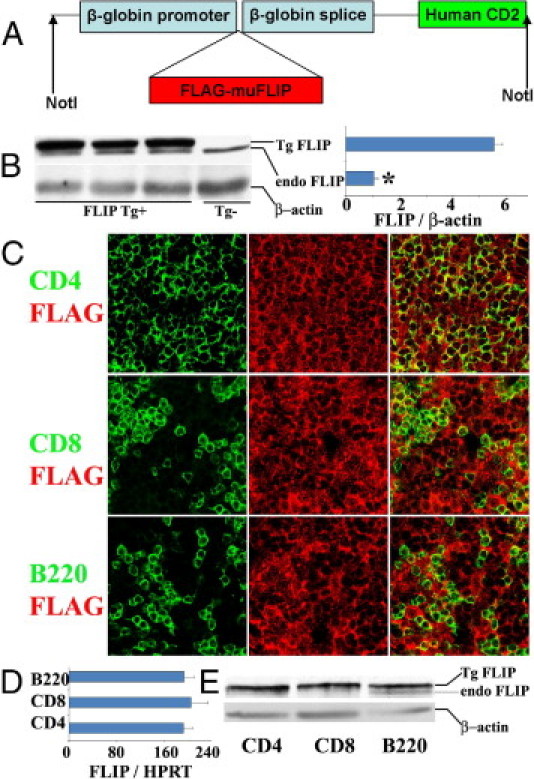
Generation of FLIP transgenic mice and expression of FLIP in CD4+ and CD8+ T cells and B cells. A: Map of the cFLIP transgene. 1.5-kb FLAG-tagged mouse cFLIPL was cloned into a targeting vector (pBSK II), driven by β-globin promoter and the downstream human CD2 enhancer element. B: Western blot analysis of expression of endogenous and transgenic expression of FLIP in spleens of FLIP Tg+ mice and their littermates (left) and relative expression level of transgenic FLIP to endogenous FLIP (right). C: Confocal microscopy analysis of expression of FLAG on CD4+ and CD8+ T cells and B220+ B cells on frozen sections of spleens from Tg+ mice. Original magnification, ×800. D: mRNA analysis of FLIP expression on CD4+ and CD8+ T cells and B220+ B cells. Spleen cell subsets were isolated using magnetic beads, as described under Materials and Methods; purity was >95%, determined by flow cytometry. Results are expressed as the mean ratio FLIP densitometric U/HPRT ± SEM (×100) of four individual mice/group. E: Protein analysis of FLIP expression on CD4+ and CD8+ T cells and B220+ B cells. Protein was pooled from individual mice (n = 6 per group). For protein analysis, 30 μg protein was loaded in each lane. All results are representative of two or three experiments. *P < 0.05.
Transgenic Overexpression of FLIP Protects Cultured Splenocytes from Fas-Mediated Apoptosis
To determine whether transgenic overexpression of FLIP protected lymphocytes from Fas-mediated apoptosis in vitro, splenocytes from FLIP Tg− and Tg+ mice were treated with agonist anti-Fas (1 μg/mL). Apoptosis was detected by TUNEL staining (Figure 2, A–L), as described under Materials and Methods. TUNEL-positive cells in five or six randomly selected fields were manually counted and expressed as a percentage of total cells (Figure 2M). Essentially no TUNEL-positive cells were detected in splenocytes from FLIP Tg− or Tg+ mice cultured for 8 or 16 hours in the absence of anti-Fas (Figure 2, A, B, E, F, and M). Spontaneous apoptosis was detected in 15% of splenocytes from Tg− mice after 24 hours (Figure 2, I and M), but in <5% of splenocytes from Tg+ mice (Figure 2, J and M). Few TUNEL-positive cells were detected in splenocytes from FLIP Tg− or Tg+ mice after 8 hours of stimulation with anti-Fas (Figure 2, C, D, and M). After 16 to 24 hours, 30% to 40% of splenocytes from Tg− mice were TUNEL-positive (Figure 2, G, K, and M), whereas few or no TUNEL-positive cells were detected in splenocytes from FLIP Tg+ mice cultured for up to 24 hours with anti-Fas (Figure 2, H, L, and M). These results indicate that Fas-mediated apoptosis is inhibited by transgenic overexpression of FLIP on splenocytes, directly demonstrating that transgenic FLIP is functional and that FLIP overexpression protects splenocytes from Fas-mediated apoptosis in vitro. In contrast to apoptosis induced by anti-Fas, death receptor-independent apoptosis induced by irradiation was unaffected by transgenic overexpression of FLIP (see Supplemental Figure S1 at http://ajp.amjpathol.org).
Figure 2.
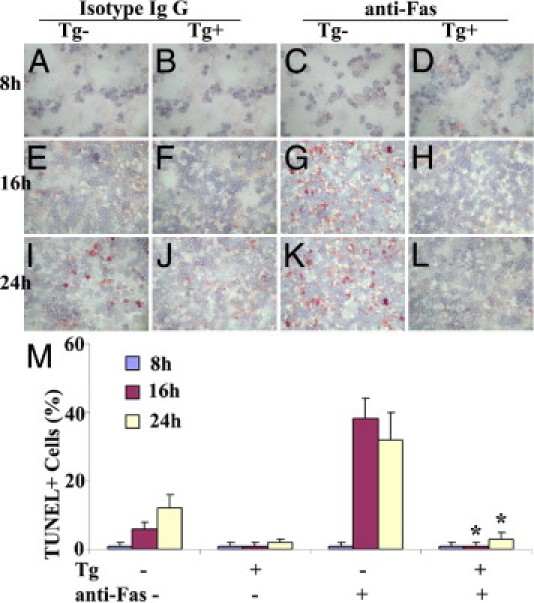
Transgenic overexpression of FLIP protects cultured splenocytes from Fas-mediated apoptosis. A–L: Splenocytes from FLIP Tg− and Tg+ mice were cultured and treated with agonist anti-Fas (1 μg/mL) or isotype IgG at 8, 16, and 24 hours. Apoptosis was detected by TUNEL staining (red), as described under Materials and Methods. Original magnification, ×400. M: TUNEL-positive cells in five or six randomly selected fields were manually counted and expressed as a percentage of total cells. All results are representative of two or three experiments. *P < 0.05, significant difference between Tg− and Tg+ groups in the presence of anti-Fas.
Donor Cells from CD2 FLIP Transgenic Mice Transfer Less Severe G-EAT than Donor Cells from Transgene-Negative Littermates
When MTg-sensitized splenocytes from transgene-negative donors were activated with MTg and IL-12 in vitro, thyroid lesions were severe and were similar in both FLIP Tg+ and Tg− recipients 20 days after cell transfer, indicating that expression of transgenic FLIP in recipients had no effect on development of G-EAT (Figure 3). However, when CBA/DBA F1 (Figure 3) or DBA/1 (data not shown) FLIP-Tg+ mice were used as donors, severity scores in both FLIP Tg+ and Tg− littermate recipients were much lower than those induced by cells from Tg− littermates. These results were unexpected, and suggest that sensitization of donor cells able to transfer G-EAT is inhibited by transgenic overexpression of FLIP. Similar results were observed when donor splenocytes were activated under Th17 polarization conditions (eg, with MTg and IL-23; data not shown). Cells from MTg-sensitized donors cultured with MTg alone or MTg and IL-4 (Th2 conditions) transferred minimal disease, whether they were from Tg− or Tg+ donors (data not shown). Because the rate of resolution of G-EAT is strongly influenced by disease severity scores at 20 days after cell transfer,3–8 the lower level of sensitization of splenocytes from Tg+ donors did not allow appropriate testing of our hypothesis.
Figure 3.
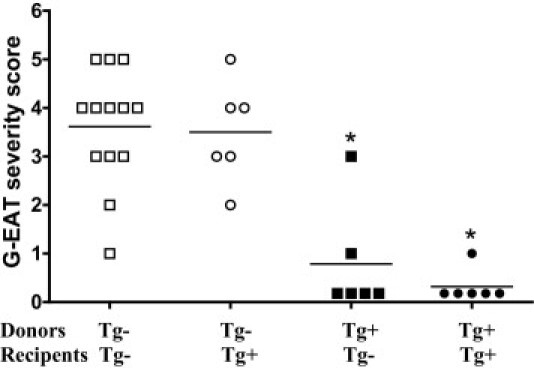
Splenocytes from CD2 FLIP Tg+ donors transfer minimal G-EAT to recipients, and expression of transgenic FLIP in recipients is irrelevant. G-EAT severity scores of individual Tg+ and Tg− recipients of Tg+ and Tg− donor cells activated with MTg and IL-12 at 20 days after cell transfer. Results are representative of three independent experiments. *P < 0.05, significant difference between Tg+ and Tg− recipients. Horizontal bar indicates the average severity score for each group.
Effect of Depletion of Donor CD8+ T Cells on Development of G-EAT in Recipients of Splenocytes from Tg+ and Tg− Donors
We previously showed that transfer of G-EAT by in vitro activated splenocytes was improved by depletion of donor CD8+ T cells.8 To determine whether in vitro activated splenocytes from CBA/DBA F1 CD2 FLIP Tg+ donors could transfer more severe G-EAT if donor CD8+ T cells were depleted, Tg+ and Tg− donors were given anti-CD8 monoclonal antibody 4 days after the second immunization with MTg and lipopolysaccharide.8 Recipients of splenocytes from both Tg+ and Tg− CD8-depleted donors had developed severe G-EAT (4+ to 5+) at 20 days after cell transfer (Figure 4). Although at 20 days after cell transfer G-EAT severity scores in recipients of Tg+ donor cells were similar to those in recipients of cells from similarly immunized and activated Tg− littermates (Figure 4A), thyroid lesions in most recipients of splenocytes from Tg− donors were beginning to resolve 50 days after cell transfer, whereas thyroids in most recipients of splenocytes from Tg+ donors had more inflammation (Figure 4A). These results are consistent with our hypothesis that overexpression of FLIP on T cells should result in more chronic inflammation, delaying G-EAT resolution.
Figure 4.
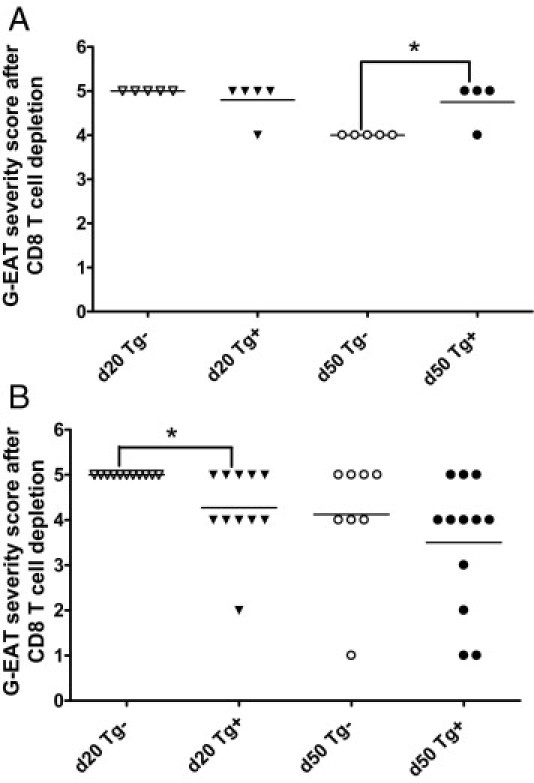
Effect of depletion of donor CD8+ T cells on development of G-EAT in recipients of splenocytes from Tg+ and Tg− donors. A: Representative G-EAT severity scores of individual recipients of Tg+ and Tg− donor cells at 20 days (P = 0.347, Tg+ versus Tg− donors) and 50 days (P = 0.011, Tg+ versus Tg− donors) after cell transfer in some experiments. B: Representative G-EAT severity scores of individual recipients of Tg+ and Tg− donor cells at day 20 (P = 0.015, Tg+ versus Tg− donors) and day 50 (P = 0.345, Tg+ versus Tg− donors) in most experiments. Donor CD8+ T cells were depleted in both A and B. *P < 0.05, significant difference between Tg+ and Tg− donors. Horizontal bar indicates the average severity score for each group.
Nonetheless, in most experiments the recipients of splenocytes from CD8-depleted Tg+ donors had slightly less severe G-EAT 20 days after cell transfer, compared with recipients of splenocytes from Tg− donors (Figure 4B). In these experiments, G-EAT severity scores were similar in recipients of splenocytes from FLIP Tg+ and Tg− donors at day 50 (Figure 4B). These results indicate that transgenic overexpression of FLIP on lymphocytes did not consistently lead to prolonged inflammation, possibly because splenocytes from Tg+ donors unexpectedly transferred less severe G-EAT than splenocytes from Tg− littermates. Similar results were obtained when splenocytes were activated with MTg and IL-23 (Th17 polarization conditions); that is, cells from Tg+ donors transferred slightly less severe lesions at day 20, and lesions at day 50 to day 60 were similar in recipients of both Tg+ and Tg− splenocytes (data not shown).
CD2 FLIP Transgenic Mice Produce Less Anti-MTg Autoantibody than Transgene-Negative Littermates
It is not known why overexpression of FLIP on T and B lymphocytes resulted in a reduced ability of cells from immunized donors to transfer G-EAT. The fact that depletion of donor CD8+ T cells largely negated these differences suggests that overexpression of FLIP on CD8+ T cells was one factor contributing to the lower activity of cells from Tg+ donors. In addition, recipients of splenocytes from Tg+ donors always had lower anti-MTg autoantibody responses, compared with similarly activated splenocytes from immunized Tg− littermates (Table 1), and Tg+ donors produced less anti-MTg autoantibody than their Tg− littermates (data not shown). This was true when splenocytes were activated with MTg and IL-12 (Figure 4), and also when they were activated with MTg alone or with MTg and IL-23 (data not shown). Because anti-MTg autoantibody levels generally correlate with G-EAT severity scores,4–8 the results suggest that transgenic expression of FLIP on B cells in CD2-FLIP transgenic mice might limit their ability to be activated to produce autoantibody. Splenocytes from Tg+ and Tg− littermates had similar percentages of CD4+ and CD8+ T cells and B cells, as analyzed by flow cytometry, and expression of CD2-FLIP on B cells did not influence the relative proportions of splenic B cell subsets (data not shown).
Expression of Cytokines in Cultured Splenocytes from Tg+ and Tg− Donors and in Thyroids of Recipients of Tg− and Tg+ Donor Cells
The balance between proinflammatory cytokines such as IFN-γ, IL-17 and TNF-α and anti-inflammatory cytokines such as IL-10 is important for development and progression of inflammation in autoimmune diseases, including G-EAT.7,23,29,32–34 Others have shown that immune responses in CD2-FLIP transgenic mice are biased toward Th2 responses27 although this was overcome to some extent by activating cells under Th1 polarization conditions.35 To determine whether pro- and anti-inflammatory cytokines were differentially expressed in splenocytes from CD2-FLIP Tg+ and Tg− donors after in vitro activation, mRNA expression of cytokines in splenocytes from MTg-immunized Tg+ and Tg− mice activated with MTg and IL-12 (Th1 polarization conditions) was determined by RT-PCR (Figure 5). Splenocytes from Tg+ mice always had lower expression of IFN-γ, compared with splenocytes from similarly immunized and activated Tg− littermates (Figure 5A). Although cells cultured with MTg and IL-12 had low expression of IL-17 (as expected), IL-17 was always lower in cells from Tg+ mice (Figure 5B). Expression of IL-10 was also lower in splenocytes from Tg+ donors (Figure 5C), whereas expression of IL-5 and IL-13 (Figure 5, D and E) and also FLIP (Figure 5F) was higher in splenocytes from Tg+ donors. Tg+ splenocytes also had reduced expression of IL-17 and IFN-γ mRNA when splenocytes were cultured with MTg alone (nonpolarizing conditions) or with MTg and IL-23 (Th17 polarizing conditions) (data not shown). Concentrations of IFN-γ, IL-17, and IL-10 were also lower in supernatants of cultured splenocytes from Tg+ donors (Table 2). These results are consistent with those of earlier studies27,35 demonstrating that cells from immunized CD2-FLIP transgenic mice are biased toward Th2 responses. Because splenocytes from Tg+ and Tg− donors activated under Th2 polarizing conditions (IL-4) transfer minimal G-EAT (data not shown), the Th2-biased responses in Tg+ donors might contribute to their reduced ability to transfer severe G-EAT.
Figure 5.
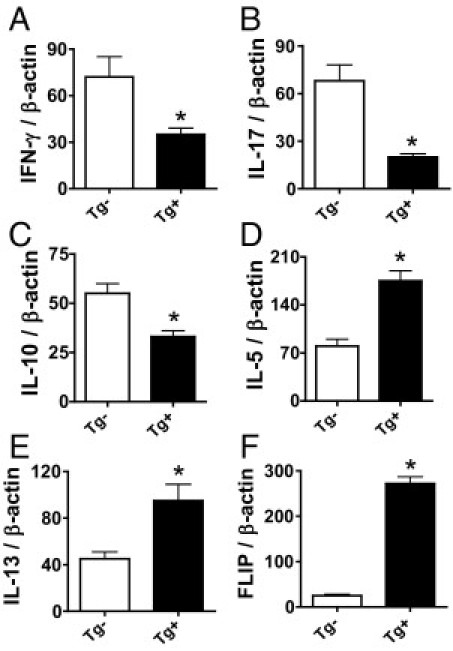
Analysis of FLIP and cytokine mRNA expression in cultured splenocytes from Tg+ and Tg− donors mRNA was isolated from splenocytes of Tg+ and Tg− donors cultured for 3 days with MTg and IL-12 and amplified as described in Materials and Methods. Shown are RT-PCR results for IFN-γ, IL-17, IL-10, IL-5, IL-13, and FLIP (A–F). Results are expressed as the mean ratio of FLIP or cytokine densitometric U/β-actin ± SEM (×100) of four to five samples per group. Results are representative of three independent experiments. *P < 0.05, significant difference between cultured splenocytes from FLIP Tg+ and Tg− donors.
Table 2.
Cytokine Concentration in Supernatants of Cultured Splenocytes
| ELISA cytokine concentration (pg/mL)† |
||||
|---|---|---|---|---|
| Supernatant source⁎ | IFN-γ | IL-17 | TNF-α | IL-10 |
| Tg− + IL-12 | 35,000 | 18 | 127 | 2216 |
| Tg+ + IL-12 | 22,350 | 9 | 128 | 1052 |
| Tg− + IL-23 | 1080 | 4520 | 26 | 987 |
| Tg+ + IL-23 | 890 | 1410 | 22 | 483 |
| Tg− + IL-12 | 30,960 | 11 | 106 | 1380 |
| Tg+ + IL-12 | 11,920 | 8 | 100 | 430 |
Supernatants were obtained at the time cells were harvested for transfer to recipient mice. Supernatants were from two different experiments, illustrated in Figure 4B (rows 1 to 4) and in Figure 4A (rows 5 and 6).
Data are reported as means of duplicate samples. Results are representative of at least three independent experiments.
Thyroids of recipients of splenocytes from FLIP Tg+ and Tg− donors with similar G-EAT severity (4+ to 5+) at day 20 were also analyzed by RT-PCR (Figure 6). FLIP mRNA was highly expressed in thyroids of recipients of splenocytes from Tg+ donors (Figure 6A), whereas much lower levels of FLIP were detected in thyroids of recipients of splenocytes from FLIP Tg− donors with severe G-EAT (Figure 6A). As shown previously,20,21,23,24 cytokine mRNA was undetectable in thyroids of normal Tg+ or Tg− mice (Figure 6, B–F). Consistent with the results shown for splenocytes, expression of IFN-γ, IL-17, and IL-10 mRNA was lower in thyroids of recipients of splenocytes from FLIP Tg+ donors (Figure 6, B–D). However, expression of IL-5 and IL-13 mRNA (Figure 6, E and F) was similar in recipient thyroids of splenocytes from FLIP Tg+ and Tg− donors. The PCR results were also supported by analysis of protein expression in thyroids by IHC. Consistent with mRNA expression patterns (Figure 6), the staining intensity for IFN-γ, IL-17, and IL-10 was weaker for FLIP Tg+, but staining for IL-5 was similar in thyroids of recipients of splenocytes from FLIP Tg+ and Tg− donors (see Supplemental Figure S2 at http://ajp.amjpathol.org), even though G-EAT severity scores were similar for both groups.
Figure 6.
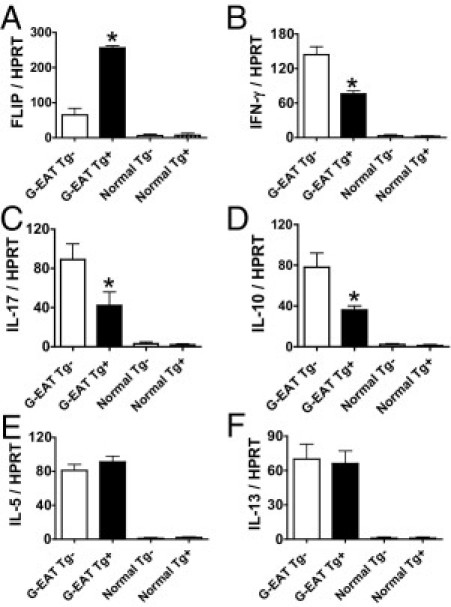
Analysis of FLIP and cytokine mRNA expression in thyroids of recipients of Tg+ and Tg− donor cells. mRNA was isolated from thyroid lobes of individual recipient mice 20 days after cell transfer and amplified as described in Materials and Methods. All recipient thyroids had similar 4+ to 5+ severity scores. mRNA of FLIP (A), IFN-γ (B), IL-17 (C), IL-10 (D), IL-5 (E), and IL-13 (F) was undetectable in thyroids of normal Tg+ or Tg− mice. FLIP and TNF-α mRNA expression was higher (A and C), IL-10 and IFN-γ mRNA expression was lower (B and D), and IL-5 and IL-13 mRNA expression was similar (E and F) in recipient thyroids of FLIP Tg+ donors, compared with Tg− donors. Results are expressed as the mean ratio of FLIP or cytokine densitometric U/HPRT ± SEM (×100) of five or six mice per group. Results are representative of three independent experiments. *P < 0.05, significant difference between recipient thyroids of FLIP Tg+ and Tg− donors.
Discussion
The present study was undertaken to test the hypothesis that transgenic overexpression of the antiapoptotic molecule FLIP on lymphocytes would result in chronic inflammation and delayed resolution of G-EAT. In contrast to our hypothesis, results of most experiments indicated little difference in the rate of resolution of G-EAT in recipients of splenocytes from CD2-FLIP Tg+ or Tg− donors (Figure 4). This can be explained, at least in part, by the unexpected finding that in vitro activated splenocytes from CD2-FLIP Tg+ donors transferred less severe G-EAT, compared with their Tg− littermates (Figure 3). The decreased ability of CD2-FLIP transgenic donors to transfer severe G-EAT to recipient mice was apparently due, in part, to suppression of effector T cell activation by CD8+ T cells, because depletion of donor CD8+ T cells increased the ability of Tg+ donor cells to transfer G-EAT (Figure 3 versus Figure 4). However, depletion of donor CD8+ T cells only partially restored the ability of donor cells to transfer G-EAT in most experiments (Figure 4B), indicating that other factors also contributed to the greater resistance of transgene-positive donors to G-EAT. After depletion of donor CD8+ T cells, CD2-FLIP transgenic mice produced less anti-MTg autoantibody than their nontransgenic littermates, and their T cells produced lower amounts of proinflammatory cytokines. These results indicate that the role of FLIP in the immune response is complex, and the effects of overexpression of a particular molecule on an immune response or autoimmune disease can be difficult to predict.
Although depletion of donor CD8+ T cells increased the ability of Tg+ donor splenocytes to transfer severe G-EAT in most experiments (Figure 4), recipients of splenocytes from Tg+ donors still had slightly lower G-EAT severity scores at day 20, compared with recipients of cells from similarly immunized and activated Tg− littermates (Figure 4B). Because the rate of resolution correlates with G-EAT severity scores at 19 to 21 days after cell transfer,4–8 effects on resolution can be determined only if the groups being compared have similar G-EAT severity scores 19 to 21 days after cell transfer. Therefore, the reduced G-EAT susceptibility of CD2-FLIP Tg+ mice compared with their Tg− littermates almost certainly contributed to results observed at 50 to 60 days. In a few experiments, recipients of Tg+ and Tg− donor cells had similar G-EAT severity scores 20 days after cell transfer. In those experiments, thyroid lesions in recipients of Tg− donor cells were beginning to resolve by day 50 to day 60 (Figure 4A), whereas lesions in most recipients of Tg+ cells were not resolving and had more fibrosis (data not shown). Although the latter results are consistent with our hypothesis that transgenic overexpression of FLIP on lymphocytes should result in delayed G-EAT resolution, the tendency for cells from Tg+ donors to transfer less severe G-EAT in most experiments prevented appropriate testing of our hypothesis.
In previous studies, others using the same CD2-FLIP construct showed that the CD2-FLIP transgene is expressed in T cells, but not in B cells.22,27 Because CD2 is expressed by both T and B cells,30,31 it is not surprising that transgenic FLIP under the promoter of CD2 was also expressed in B cells (Figure 1). It is difficult to determine whether expression of transgenic FLIP by B cells in our mice contributed to the greater resistance to G-EAT in our CD2-FLIP transgenic mice. Clearly, CD2-FLIP transgenic mice produced less anti-MTg autoantibody than their Tg− littermates (Table 1), and susceptibility to EAT and G-EAT is known to correlate with levels of anti-MTg autoantibody responses.3–8 However, it is not clear why protection of B cells from Fas-mediated apoptosis due to overexpression of FLIP would lead to reduced autoantibody responses. Further studies will be required to determine how overexpression of FLIP in B cells might contribute to the greater resistance to G-EAT in CD2-FLIP transgenic mice.
Development and resolution of inflammation is regulated by cytokines.7,21,23,32–34 Proinflammatory cytokines such as IFN-γ and TNF-α promote inflammation,32–34 and can sensitize thyroid epithelial cells to undergo Fas-mediated apoptosis,9,32–34,36 whereas anti-inflammatory cytokines such as IL-10 inhibit inflammation7,21,23,29 and promote apoptosis of inflammatory cells.9 CD2-FLIP transgenic mice produced lower levels of both proinflammatory IFN-γ and IL-17 cytokines, as well as the anti-inflammatory cytokine IL-10, compared with their Tg− littermates (Table 2 and Figures 5 and 6). This was true both for cytokines expressed or produced by activated splenocytes in vitro (Table 2 and Figure 5) and for cytokines expressed in thyroids of recipient mice (Figure 6). In our previous studies in G-EAT, IL-10 was produced mainly by CD4+ T cells, CD8+ T cells, and macrophages,23 and increased expression of IL-10 by CD8+ T cells was associated with earlier resolution of G-EAT.7,23 Production of lower amounts of IL-10 by CD2-FLIP transgenic mice would thus have been consistent with our initial hypothesis that overexpression of FLIP on T cells would promote chronic inflammation and inhibit G-EAT resolution. However, overexpression of FLIP also unexpectedly resulted in decreased susceptibility to G-EAT, which is consistent with the lower expression of proinflammatory cytokines in CD2-FLIP transgenic mice. Therefore, the decreased expression of proinflammatory cytokines in CD2-FLIP transgenic mice was apparently one major factor that resulted in their overall reduced susceptibility to G-EAT.7,21,23,24 These results would be consistent with findings by others suggesting that transgenic overexpression of FLIP in T cells results in decreased T cell activation.37
Although transgenic overexpression of FLIP in T cells may have resulted in decreased T cell activation in our CD2-FLIP transgenic mice, the fact that depletion of donor CD8+ T cells increased the ability of splenocytes from CD2-FLIP Tg+ mice to transfer G-EAT is consistent with the idea that apoptosis-resistant CD8+ T cells are, at least in part, responsible for the relative resistance to G-EAT in recipients of cells from CD2-FLIP transgenic donors. CD4+ T cells are the primary effector cells for G-EAT,4–8 and CD8+ T cells function to negatively regulate G-EAT.6–8 Previous studies by ourselves and others showed that CD8+ T cells could inhibit development of autoimmune diseases and/or promote resolution of inflammation through the Fas/FasL pathway8,17,38–40 or through the activity of IL-10-producing CD122+CD8+ T cells.23,41 Further studies are needed to address the detailed mechanisms by which transgenic overexpression of FLIP on B cells and T cells decreases the sensitivity of CD2-FLIP Tg+ mice to EAT induction.
As noted above, IFN-γ, IL-17, and IL-10 were consistently decreased in both splenocytes and recipient thyroids of CD2-FLIP transgenic mice (Table 2 and Figures 5 and 6), although there was little effect on expression of TNF-α (Table 2). Previous studies by others showed that transgenic overexpression of FLIP promotes Th2 effector responses.27,35 Our studies also demonstrated a Th2 bias in splenocytes from CD2-FLIP transgenic donors (Figure 5), although IL-5 and IL-13 (Figure 6) expression was similar in recipient thyroids of FLIP Tg+ donors, compared with Tg− donors. We previously showed that neutralization of IL-5 has little effect on G-EAT resolution,42 and our previous studies suggested that IL-13 was decreased and IFN-γ was increased in thyroid lesions that did not resolve at day 50 to day 60.7 Hence, it is reasonable to argue that no single dominant cytokine uniquely regulates the overall process of tissue damage and that it is the balance between pro- and anti-inflammatory cytokines that ultimately influences the development and/or resolution of autoimmune inflammation. Our results and previous results of others suggest that the effect of transgenic FLIP on a particular autoimmune disease will vary depending on what cells express the transgene and whether or not those cells are effector cells or whether they function to modulate the disease. Further studies may provide greater insight into the complex role of FLIP in development and resolution of inflammation.
Acknowledgments
We thank Dr. Ralph Budd (University of Vermont) for providing the CD2-FLIP construct, the staff of the Transgenic Core Facility at the University of Missouri for generating the transgenic founders, and Edward Downey and Alex Martin for their excellent technical assistance.
Footnotes
Supported by NIH grant DK35527 (H.B.-M.), by the Eastern Missouri Chapter of the Arthritis Foundation, and by the Lottie Caroline Hardy Trust (H.B.-M.).
Supplemental material for this article can be found at http://ajp.amjpathol.org or at doi: 10.1016/j.ajpath.2011.05.054.
Contributor Information
Yujiang Fang, Email: fangy@health.missouri.edu.
Helen Braley-Mullen, Email: mullenh@health.missouri.edu.
Supplementary data
Comparable sensitivity of splenocytes from Tg+ and Tg− mice to irradiation-induced apoptosis. A–L: Splenocytes from FLIP Tg− and Tg+ mice were cultured and irradiated at 30 Gy or not irradiated (control) at the times indicated. Apoptosis was detected by TUNEL staining (red), as described under Materials and Methods. Original magnification, ×400. M: TUNEL-positive cells in five or six randomly selected fields were manually counted and expressed as a percentage of total cells. Results are representative of three experiments.
Cytokine protein expression in thyroids of recipients of Tg− and Tg+ donor splenocytes. A–H: Representative frozen sections of thyroids expressing IFN-γ (A and B), IL-17 (C and D), IL-10 (E and F), and IL-5 (G and H) for recipients of Tg+ or Tg− donor cells; cytokine-positive cells stain red. All thyroids had similar 4+ to 5+ severity scores. Original magnification, ×400. I: Cytokine-positive cells in five or six randomly selected fields (were manually counted and expressed as a percentage of total cells (I). *P < 0.05, Tg+ versus Tg−. All results are representative of at least two experiments.
References
- 1.Charreire J. Immune mechanisms in autoimmune thyroiditis. Adv Immunol. 1989;46:263–334. doi: 10.1016/s0065-2776(08)60656-2. [DOI] [PubMed] [Google Scholar]
- 2.Lira S.A., Martin A.P., Marinkovic T., Furtado G.C. Mechanisms regulating lymphocytic infiltration of the thyroid in murine models of thyroiditis. Crit Rev Immunol. 2005;25:251–262. doi: 10.1615/critrevimmunol.v25.i4.10. [DOI] [PubMed] [Google Scholar]
- 3.Braley-Mullen H., Johnson M., Sharp G.C., Kyriakos M. Induction of experimental autoimmune thyroiditis in mice with in vitro activated splenic T cells. Cell Immunol. 1985;93:132–143. doi: 10.1016/0008-8749(85)90394-6. [DOI] [PubMed] [Google Scholar]
- 4.Braley-Mullen H., Sharp G.C., Bickel J.T., Kyriakos M. Induction of severe granulomatous experimental autoimmune thyroiditis in mice by effector cells activated in the presence of anti-interleukin 2 receptor antibody. J Exp Med. 1991;173:899–912. doi: 10.1084/jem.173.4.899. [DOI] [PMC free article] [PubMed] [Google Scholar]
- 5.Braley-Mullen H., Sharp G.C., Tang H., Chen K., Kyriakos M., Bickel J.T. Interleukin-12 promotes activation of effector cells that induce a severe destructive granulomatous form of murine experimental autoimmune thyroiditis. Am J Pathol. 1998;152:1347–1358. [PMC free article] [PubMed] [Google Scholar]
- 6.Braley-Mullen H., Sharp G.C. Adoptive transfer murine model of granulomatous experimental autoimmune thyroiditis. Int Rev Immunol. 2000;19:535–555. doi: 10.3109/08830180009088511. [DOI] [PubMed] [Google Scholar]
- 7.Chen K., Wei Y., Sharp G.C., Braley-Mullen H. Mechanisms of spontaneous resolution versus fibrosis in granulomatous experimental autoimmune thyroiditis. J Immunol. 2003;171:6236–6243. doi: 10.4049/jimmunol.171.11.6236. [DOI] [PubMed] [Google Scholar]
- 8.Braley-Mullen H., McMurray R.W., Sharp G.C., Kyriakos M. Regulation of the induction and resolution of granulomatous experimental autoimmune thyroiditis in mice by CD8+ T cells. Cell Immunol. 1994;153:492–504. doi: 10.1006/cimm.1994.1045. [DOI] [PubMed] [Google Scholar]
- 9.Stassi G., Di Liberto D., Todaro M., Zeuner A., Ricci-Vitiani L., Stoppacciaro A., Ruco L., Farina F., Zummo G., De Maria R. Control of target cell survival in thyroid autoimmunity by T helper cytokines via regulation of apoptotic proteins. Nat Immunol. 2000;1:483–488. doi: 10.1038/82725. [DOI] [PubMed] [Google Scholar]
- 10.Tisch R., McDevitt H. Insulin-dependent diabetes mellitus. Cell. 1996;85:291–297. doi: 10.1016/s0092-8674(00)81106-x. [DOI] [PubMed] [Google Scholar]
- 11.Suvannavejh G.C., Dal Canto M.C., Matis L.A., Miller S.D. Fas-mediated apoptosis in clinical remissions of relapsing experimental autoimmune encephalomyelitis. J Clin Invest. 2000;105:223–231. doi: 10.1172/JCI8561. [DOI] [PMC free article] [PubMed] [Google Scholar]
- 12.Sabelko-Downes K.A., Cross A.H., Russell J.H. Dual role for Fas ligand in the initiation of and recovery from experimental allergic encephalomyelitis. J Exp Med. 1999;189:1195–1205. doi: 10.1084/jem.189.8.1195. [DOI] [PMC free article] [PubMed] [Google Scholar]
- 13.Itoh N., Imagawa A., Hanafusa T., Waguri M., Yamamoto K., Iwahashi H., Moriwaki M., Nakajima H., Miyagawa J., Namba M., Makino S., Nagata S., Kono N., Matsuzawa Y. Requirement of Fas for the development of autoimmune diabetes in nonobese diabetic mice. J Exp Med. 1997;186:613–618. doi: 10.1084/jem.186.4.613. [DOI] [PMC free article] [PubMed] [Google Scholar]
- 14.Kang S.M., Schneider D.B., Lin Z., Hanahan D., Dichek D.A., Stock P.G., Baekkeskov S. Fas ligand expression in islets of Langerhans does not confer immune privilege and instead targets them for rapid destruction. Nat Med. 1997;3:738–743. doi: 10.1038/nm0797-738. [DOI] [PubMed] [Google Scholar]
- 15.Batteux F., Lores P., Bucchini D., Chiocchia G. Transgenic expression of Fas ligand on thyroid follicular cells prevents autoimmune thyroiditis. J Immunol. 2000;164:1681–1688. doi: 10.4049/jimmunol.164.4.1681. [DOI] [PubMed] [Google Scholar]
- 16.Giordano C., Stassi G., De Maria R., Todaro M., Richiusa P., Papoff G., Ruberti G., Bagnasco M., Testi R., Galluzzo A. Potential involvement of Fas and its ligand in the pathogenesis of Hashimoto's thyroiditis. Science. 1997;275:960–963. doi: 10.1126/science.275.5302.960. [DOI] [PubMed] [Google Scholar]
- 17.Wei Y., Chen K., Sharp G.C., Yagita H., Braley-Mullen H. Expression and regulation of Fas and Fas ligand on thyrocytes and infiltrating cells during induction and resolution of granulomatous experimental autoimmune thyroiditis. J Immunol. 2001;167:6678–6686. doi: 10.4049/jimmunol.167.11.6678. [DOI] [PubMed] [Google Scholar]
- 18.Thome M., Tschopp J. Regulation of lymphocyte proliferation and death by FLIP. Nat Rev Immunol. 2001;1:50–58. doi: 10.1038/35095508. [DOI] [PubMed] [Google Scholar]
- 19.Budd R.C., Yeh W.C., Tschopp J. cFLIP regulation of lymphocyte activation and development. Nat Rev Immunol. 2006;6:196–204. doi: 10.1038/nri1787. [DOI] [PubMed] [Google Scholar]
- 20.Fang Y., DeMarco V.G., Sharp G.C., Braley-Mullen H. Expression of transgenic FLIP on thyroid epithelial cells inhibits induction and promotes resolution of granulomatous experimental autoimmune thyroiditis in CBA/J mice. Endocrinology. 2007;148:5734–5745. doi: 10.1210/en.2007-0939. [DOI] [PubMed] [Google Scholar]
- 21.Fang Y., Wei Y., DeMarco V., Chen K., Sharp G.C., Braley-Mullen H. Murine FLIP transgene expressed on thyroid epithelial cells promotes resolution of granulomatous experimental autoimmune thyroiditis. Am J Pathol. 2007;170:875–887. doi: 10.2353/ajpath.2007.060816. [DOI] [PMC free article] [PubMed] [Google Scholar]
- 22.Lens S.M., Kataoka T., Fortner K.A., Tinel A., Ferrero I., MacDonald R.H., Hahne M., Beermann F., Attinger A., Orbea H.A., Budd R.C., Tschopp J. The caspase 8 inhibitor c-FLIPL modulated T-cell receptor-induced proliferation but not activation-induced cell death of lymphocytes. Mol Cell Biol. 2002;22:5419–5433. doi: 10.1128/MCB.22.15.5419-5433.2002. [DOI] [PMC free article] [PubMed] [Google Scholar]
- 23.Fang Y., Sharp G.C., Braley-Mullen H. Interleukin-10 promotes resolution of granulomatous experimental autoimmune thyroiditis. Am J Pathol. 2008;172:1591–1602. doi: 10.2353/ajpath.2008.071067. [DOI] [PMC free article] [PubMed] [Google Scholar]
- 24.Fang Y., Sharp G.C., Yagita H., Braley-Mullen H. A critical role for TRAIL in resolution of granulomatous experimental autoimmune thyroiditis. J Pathol. 2008;216:505–513. doi: 10.1002/path.2428. [DOI] [PMC free article] [PubMed] [Google Scholar]
- 25.Griffith T.S., Kazama H., VanOosten R.L., Earle J.K., Jr, Herndon J.M., Green D.R., Ferguson T.A. Apoptotic cells induce tolerance by generating helpless CD8+ T cells that produce TRAIL. J Immunol. 2007;178:2679–2687. doi: 10.4049/jimmunol.178.5.2679. [DOI] [PubMed] [Google Scholar]
- 26.Fang Y., Braley-Mullen H. Cultured murine thyroid epithelial cells expressing transgenic Fas-associated death domain-like interleukin-1beta converting enzyme inhibitory protein are protected from Fas-mediated apoptosis. Endocrinology. 2008;149:3321–3329. doi: 10.1210/en.2008-0080. [DOI] [PMC free article] [PubMed] [Google Scholar]
- 27.Tseveleki V., Bauer J., Taoufik E., Ruan C., Leondiadis L., Haralambous S., Lassmann H., Probert L. Cellular FLIP (long isoform) overexpression in T cells drives Th2 effector responses and promotes immunoregulation in experimental autoimmune encephalomyelitis. J Immunol. 2004;173:6619–6626. doi: 10.4049/jimmunol.173.11.6619. [DOI] [PubMed] [Google Scholar]
- 28.Wei Y., Chen K., Sharp G.C., Braley-Mullen H. Fas ligand is required for resolution of granulomatous experimental autoimmune thyroiditis. J Immunol. 2004;173:7615–7621. doi: 10.4049/jimmunol.173.12.7615. [DOI] [PubMed] [Google Scholar]
- 29.Chen K., Wei Y., Sharp G.C., Braley-Mullen H. Inhibition of TGFbeta1 by anti-TGFbeta1 antibody or lisinopril reduced thyroid fibrosis in granulomatous experimental autoimmune thyroiditis. J Immunol. 2002;169:6530–6538. doi: 10.4049/jimmunol.169.11.6530. [DOI] [PubMed] [Google Scholar]
- 30.Sen J., Rosenberg N., Burakoff S.J. Expression and ontogeny of CD2 on murine B cells. J Immunol. 1990;144:2925–2930. [PubMed] [Google Scholar]
- 31.Boles K.S., Stepp S.E., Bennett M., Kumar V Mathew P.A. 2B4 (CD244) and CS1: novel members of the CD2 subset of the immunoglobulin superfamily molecules expressed on natural killer cells and other leukocytes. Immunol Rev. 2001;181:234–249. doi: 10.1034/j.1600-065x.2001.1810120.x. [DOI] [PubMed] [Google Scholar]
- 32.Watson M.L., White A.M., Campbell E.M., Smith A.W., Uddin J., Yoshimura T., Westwick J. Anti-inflammatory actions of interleukin-13: suppression of tumor necrosis factor-alpha and antigen-induced leukocyte accumulation in the guinea pig lung. Am J Respir Cell Mol Biol. 1999;20:1007–1012. doi: 10.1165/ajrcmb.20.5.3540. [DOI] [PubMed] [Google Scholar]
- 33.Chen K., Wei Y., Sharp G.C., Braley-Mullen H. Decreasing TNF-alpha results in less fibrosis and earlier resolution of granulomatous experimental autoimmune thyroiditis. J Leukoc Biol. 2007;81:306–314. doi: 10.1189/jlb.0606402. [DOI] [PMC free article] [PubMed] [Google Scholar]
- 34.Wang S.H., Bretz J.D., Phelps E., Mezosi E., Arscott P.L., Utsugi S., Baker J.R., Jr A unique combination of inflammatory cytokines enhances apoptosis of thyroid follicular cells and transforms nondestructive to destructive thyroiditis in experimental autoimmune thyroiditis. J Immunol. 2002;168:2470–2474. doi: 10.4049/jimmunol.168.5.2470. [DOI] [PubMed] [Google Scholar]
- 35.Tseveleki V., Tsagozis P., Koutsoni O., Dotsika E., Probert L. Cellular FLIP long isoform transgenic mice overcome inherent Th2-biased immune responses to efficiently resolve Leishmania major infection. Int Immunol. 2007;19:1183–1189. doi: 10.1093/intimm/dxm089. [DOI] [PubMed] [Google Scholar]
- 36.Mitsiades N., Poulaki V., Mitsiades C.S., Koutras D.A., Chrousos G.P. Apoptosis induced by FasL and TRAIL/Apo2L in the pathogenesis of thyroid diseases. Trends Endocrinol Metab. 2001;12:384–390. doi: 10.1016/s1043-2760(01)00441-6. [DOI] [PubMed] [Google Scholar]
- 37.Tai T.S., Fang L.W., Lai M.Z. c-FLICE inhibitory protein expression inhibits T-cell activation. Cell Death Differ. 2004;11:69–79. doi: 10.1038/sj.cdd.4401316. [DOI] [PubMed] [Google Scholar]
- 38.Kataoka T. The caspase-8 modulator c-FLIP. Crit Rev Immunol. 2005;25:31–58. doi: 10.1615/critrevimmunol.v25.i1.30. [DOI] [PubMed] [Google Scholar]
- 39.Kosiewicz M.M., Alard P., Liang S., Clark S.L. Mechanisms of tolerance induced by transforming growth factor-beta-treated antigen-presenting cells: cD8 regulatory T cells inhibit the effector phase of the immune response in primed mice through a mechanism involving Fas ligand. Int Immunol. 2004;16:697–706. doi: 10.1093/intimm/dxh067. [DOI] [PubMed] [Google Scholar]
- 40.Noble A., Pestano G.A., Cantor H. Suppression of immune responses by CD8 cells: I. Superantigen-activated CD8 cells induce unidirectional Fas-mediated apoptosis of antigen-activated CD4 cells. J Immunol. 1998;160:559–565. [PubMed] [Google Scholar]
- 41.Lee Y.H., Ishida Y., Rifa'i M., Shi Z., Isobe K., Suzuki H. Essential role of CD8+CD122+ regulatory T cells in the recovery from experimental autoimmune encephalomyelitis. J Immunol. 2008;180:825–832. doi: 10.4049/jimmunol.180.2.825. [DOI] [PubMed] [Google Scholar]
- 42.Fang Y., Chen K., Jackson D., Sharp G.C., Braley-Mullen H. Eosinophils infiltrate thyroids, but have no apparent role in induction or resolution of experimental autoimmune thyroiditis in IFN-γ(-/-) mice. Immunology. 2009;129:329–337. doi: 10.1111/j.1365-2567.2009.03187.x. [DOI] [PMC free article] [PubMed] [Google Scholar]
Associated Data
This section collects any data citations, data availability statements, or supplementary materials included in this article.
Supplementary Materials
Comparable sensitivity of splenocytes from Tg+ and Tg− mice to irradiation-induced apoptosis. A–L: Splenocytes from FLIP Tg− and Tg+ mice were cultured and irradiated at 30 Gy or not irradiated (control) at the times indicated. Apoptosis was detected by TUNEL staining (red), as described under Materials and Methods. Original magnification, ×400. M: TUNEL-positive cells in five or six randomly selected fields were manually counted and expressed as a percentage of total cells. Results are representative of three experiments.
Cytokine protein expression in thyroids of recipients of Tg− and Tg+ donor splenocytes. A–H: Representative frozen sections of thyroids expressing IFN-γ (A and B), IL-17 (C and D), IL-10 (E and F), and IL-5 (G and H) for recipients of Tg+ or Tg− donor cells; cytokine-positive cells stain red. All thyroids had similar 4+ to 5+ severity scores. Original magnification, ×400. I: Cytokine-positive cells in five or six randomly selected fields (were manually counted and expressed as a percentage of total cells (I). *P < 0.05, Tg+ versus Tg−. All results are representative of at least two experiments.