

Abstract
β1,4-N-acetylgalactosaminyltransferase III (B4GALNT3) promotes the formation of GalNAcβ1,4GlcNAc (LacdiNAc or LDN). Drosophila β1,4-N-acetylgalactosaminyltransferase A (B4GALNTA) contributes to the synthesis of LDN, which helps regulate neuronal development. In this study, we investigated the expression and role of B4GALNT3 in human neuroblastoma (NB). We used IHC analysis to examine 87 NB tumors, and we identified correlations between B4GALNT3 expression and clinicopathologic factors, including patient survival. Effects of recombinant B4GALNT3 on cell behavior and signaling were studied in SK-N-SH and SH-SY5Y NB cells. Increased expression of B4GALNT3 in NB tumors correlated with a favorable histologic profile (P < 0.001, χ2 test) and early clinical staging (P = 0.041, χ2 test) and was a favorable prognostic factor for survival as evaluated by univariate and multivariate analyses. Reexpression of B4GALNT3 in SK-N-SH and SH-SY5Y cells suppressed cell proliferation, colony formation, migration, and invasion. Moreover, B4GALNT3 increased the LacdiNAc modification of β1 integrin, leading to decreased phosphorylation of focal adhesion kinase (FAK), Src, paxillin, Akt, and ERK1/2. B4GALNT3-mediated suppression of cell migration and invasion were substantially reversed by concomitant expression of constitutively active Akt or MEK. We conclude that B4GALNT3 predicts a favorable prognosis for NB and suppresses the malignant phenotype via decreasing β1 integrin signaling.
Neuroblastoma (NB) is the most common extracranial solid tumor in childhood, accounting for 8% to 10% of all pediatric malignancies.1 This tumor arises from primitive neuroepithelial cells of the neural crest.2 The behavior of NB is markedly heterogeneous, ranging from highly undifferentiated tumors with very poor outcomes to well-differentiated benign ganglioneuroma or NB that may spontaneously regress with favorable prognosis.3 Half of all patients with newly diagnosed NB are in a high-risk subset with poor overall survival despite intensive therapy. Therefore, it is important to develop useful prognostic tools and to understand NB pathogenesis to help design improved NB therapies.
Glycosylation is regulated spatiotemporally during development of the nervous system.4 Altered carbohydrate structures on tumors are often associated with tumor metastasis and progression. Tumor-associated carbohydrate epitopes commonly found in cancers include GM2, GD2, GD3, T, Tn, Globo H, Lewis y, sialyl Lewis x, sialyl Lewis a, and polysialic acid.5,6 Among these, GM2, GD2, and GD3 are expressed in NB.6 Changes in expression levels of glycogenes may play an important role in alterations of carbohydrate structures in tumors. However, the differential expression of these molecules in NB and their effects on tumor cell behavior are poorly understood.
β1,4-N-acetylgalactosaminyltransferase III (B4GALNT3) has been cloned and is expressed in various tissues.7 This enzyme can transfer GalNAc to any nonreducing terminal GlcNAc-β in vitro, resulting in synthesis of GalNAcβ1,4GlcNAc (LacdiNAc or LDN). The terminal β1,4–linked GalNAc of LDN can be recognized by a lectin, Wisteria floribunda agglutinin (WFA). This special terminal β1,4GalNAc structure is found in certain glycoproteins and glycohormones, including lutropin,8 thyrotropin,8–10 proopiomelanocortin,11–13 and the sorting protein–related receptor SorLA/LR11.14 SorLA/LR11, highly expressed by neurons in the central and peripheral nervous systems, bears N-linked oligosaccharides modified with terminal β1,4–linked GalNAc-4-SO4 that can be synthesized by B4GALNT3 in CHO cells.14 In Drosophila, β1,4-N-acetylgalactosaminyltransferase A (B4GALNTA) catalyzes synthesis of LacdiNAc on glycoconjugates.15 Drosophila mutants deficient in B4GALNTA have defects in behavior and in the neuromuscular system.16 In the present study, we hypothesized that B4GALNT3 may be involved in the pathogenesis of NB development.
Materials and Methods
Patients and Treatment
Between December 1, 1990, and December 31, 2007, 102 patients with NB were treated at National Taiwan University Hospital. The use of human tissues for this study was approved by the National Taiwan University Hospital Ethics Committee, and written consent was obtained from patients before the collection of samples. Eighty-seven of these 102 patients had complete follow-up and sufficient prechemotherapy tumor tissues for evaluation and were enrolled in this study. The median age at diagnosis was 2.5 years (range, 0 to 11.5 years). Male patients were slightly predominant, with a male/female ratio of 49:38. Most tumors (52 cases) originated primarily from the adrenal gland, with others from the retroperitoneum (19 cases), mediastinum (7 cases), neck (5 cases), and pelvis (4 cases). According to the criteria of the International Neuroblastoma Pathology Classification,17–19 the histologic morphologic features of the tumors were categorized into four types: i) NB (including undifferentiated, poorly differentiated, and differentiating subtypes); ii) ganglioneuroblastoma (GNB), intermixed; iii) GNB, nodular; and iv) GNB, maturing subtype. Because GNB, maturing subtype is a benign lesion, it is not included in this study. For a simpler description of the relationship between B4GALNT3 expression and the histologic grades of tumor differentiation, we defined undifferentiated NB (UNB), poorly differentiated and differentiating NB (DNB), and GNB, intermixed for tumor histologic statement in this study. The GNB, nodular subtype was classified into either UNB or DNB according to the morphologic features of their NB nodules because the tumor behavior of this subtype of tumors depends mainly on their NB nodules.18 For prognostic analysis, GNB, intermixed was classified as a favorable histologic type, and UNB and DNB were classified as either a favorable or an unfavorable histologic type according to the mitosis-karyorrhexis index and patient age at diagnosis based on the criteria of the International Neuroblastoma Pathology Classification.17,18 Tumors were staged according to the International Neuroblastoma Staging System.20 The MYCN status of the tumor tissue was evaluated by fluorescence in situ hybridization analysis of formalin-fixed, paraffin-embedded tissues or single fresh tumor cells.21,22 Based on the risk classifications of the Children's Cancer Group, patients were classified into low-, intermediate-, and high-risk groups and were treated with either surgery alone or a combination of multiple modalities, including chemotherapy, radiotherapy, and/or autologous bone marrow transplantation.23 Mean follow-up after diagnosis was 70.6 months (range, 1 to 204 months), and overall predictive 5-year survival in this cohort was 48.7%.
IHC Analysis
Human NB tissue sections were deparaffinized in xylene and rehydrated in a series of graded alcohols. After quenching the activity of endogenous peroxidase with 1% H2O2 in PBS for 10 minutes, the sections were rinsed three times with PBS and then were incubated with 5% nonfat milk/PBS for 30 minutes to reduce nonspecific binding. Sections were incubated with an anti-B4GALNT3 polyclonal antibody (1:400; Sigma-Aldrich, St. Louis, MO) diluted with 5% nonfat milk/PBS for 16 hours at 4°C. After rinsing twice with PBS, the Super Sensitive link-label immunohistochemical (IHC) detection system (BioGenex, San Ramon, CA) was used, and specific immunostaining was visualized using 3,3-diaminobenzidine liquid substrate system (Sigma-Aldrich). All the sections were counterstained with hematoxylin for 1 minute and were mounted with UltraKitt (J.T. Baker, Deventer, Holland). Negative controls were performed by replacing primary antibodies with a control nonimmune IgG at the same concentration. To further confirm the specificity of staining, B4GALNT3 peptide (10 μg/mL) was used to block binding of anti-B4GALNT3 antibody to tissues.
Cell Culture and Transfection
NB cell lines SK-N-SH and SH-SY5Y, from American Type Culture Collection (Manassas, VA), were maintained using Dulbecco's modified Eagle's medium (DMEM; JRH Biosciences, Lenexa, KS) containing 10% fetal bovine serum (FBS) (PAA Laboratories GmbH, Pasching, Austria) in a humidified tissue culture incubator at 37°C, in a 5% CO2 atmosphere. For stable transfection, 4 μg of B4GALNT3/pcDNA3.1 (a gift from Dr. Hisashi Narimatsu, National Institute of Advanced Industrial Science and Technology, Tokyo, Japan) or pcDNA3.1/myc-His (Invitrogen, Life Technologies Inc., Grand Island, NY) was transfected into 5 × 10⁵ cells using Lipofectamine 2000 (Invitrogen, Carlsbad, CA). After transfection for 24 hours, cells were trypsinized and plated on three 100-mm dishes with 10% FBS-DMEM containing 400 μg/mL of G418 (Calbiochem, Darmstadt, Germany). After 10 days of selection, G418-resistant clones were pooled and transferred to 6-well plates. Expression levels of B4GALNT3 were analyzed by RT-PCR and immunoblotting. For transient expression of constitutively active Akt and MEK, pCIS2/Akt and pCMV/MEK plasmids were used. The pCIS2/Akt plasmids were constructed as previously described.24 The pCMV/MEK plasmids were a gift from Dr. Zee-Fen Chang (Institute of Biochemistry and Molecular Biology, College of Medicine, National Taiwan University).25 The empty pCIS2 and pCMV vectors were used as control vectors, respectively.
RT-PCR and Real-Time PCR
Total cellular RNA was isolated from cells grown to 70% confluence using TRIzol reagent (Invitrogen) according to manufacturer protocols as previously described.26 For cDNA synthesis, 2 μg of total RNA was used as template in a 25-μL reverse transcription reaction. PCR reactions were incubated for 5 minutes at 95°C, followed by 35 amplification cycles with 30 seconds of denaturation at 94°C, 30 seconds of annealing at 60°C, and 30 seconds of extension at 72°C. For real-time PCR, the quantitative PCR system Mx3000P (Stratagene, La Jolla, CA) was used to analyze gene expression according to the manufacturer's protocol. Briefly, reactions were performed in a 25-μL volume with 2 μL of cDNA, 400 nmol/L each of sense and antisense primers, and 12.5 μL of Brilliant SYBR Green QPCR Master Mix (Stratagene). For GAPDH detection, sense and antisense primers were 5′-ACAGTCAGCCGCATCTTCTT-3′ and 5′-GACAAGCTTCCCGTTCTCAG-3′, respectively, generating a 259-bp fragment. For detection of B4GALNT3, sense and antisense primers were 5′-CTACAGCGCATTGTGAACGT-3′ and 5′-TGGTTCTTCACAGGCACGAC-3′, respectively, generating a 320-bp fragment. The PCR products were confirmed to be correct by DNA sequencing.
Immunoblotting and Immunoprecipitation
To confirm expression of B4GALNT3 in differentiated NB cells, SK-N-SH cells were treated with dimethyl sulfoxide (0.1%) or all-trans retinoic acid (ATRA, 10 μmol/L; Sigma-Aldrich) for 3 days. Equal amounts of cell lysates (20 μg of total protein) were subjected to SDS-PAGE, and the gel contents were transferred to polyvinylidene difluoride membrane. Membranes were incubated with mouse anti–glyceraldehyde-3-phosphate dehydrogenase monoclonal antibody (BIODESIGN International, Saco, MA) or anti-B4GALNT3 polyclonal antibody, whose specificity has been demonstrated. Neuronal differentiation was detected by mouse monoclonal antibodies, anti-GAP-43 (clone GAP-7B10; Sigma-Aldrich) and anti–neuron-specific enolase (Chemicon, Billerica, MA). A biotinylated lectin, WFA (Vector Laboratories, Burlingame, CA), was used to detect the LacdiNAc structure in primary tumors. For detecting the LacdiNAc structure on cell surface proteins, intact cells were surface biotinylated with sulfosuccinimidyl biotin (Pierce Chemical Co., Rockford, IL), lysed, and then pulled down with WFA agarose beads (Vector Laboratories). The pulled-down proteins were detected using horseradish peroxidase–conjugated streptavidin (Santa Cruz Biotechnology). For cell signaling analyses, we used rabbit anti–β1 integrin antibody (BD Transduction Laboratories, San Jose, CA), mouse anti-phosphotyrosine (pY) antibody (4G10; Upstate Biotechnology Inc., Lake Placid, NY), rabbit anti-FAK pY397 polyclonal antibody (Biosource, Nivelles, Belgium), rabbit anti-FAK polyclonal antibody (C-20; Santa Cruz Biotechnology), anti-paxillin pY118 (BD Transduction Laboratories, Heidelberg, Germany), anti-paxillin polyclonal antibody (BD Transduction Laboratories, Heidelberg), rabbit anti-pERK1/2 monoclonal antibody, rabbit anti-pAkt, and mouse anti-pan Akt monoclonal antibody (Cell Signaling Technology Inc., Beverly, MA), rabbit anti-ERK1/2 antibody (Santa Cruz Biotechnology), rabbit anti-Src pY418 antibody (Invitrogen), and rabbit anti-c-Src antibody (Invitrogen). Immunoblotted membranes were then incubated with horseradish peroxidase–conjugated streptavidin, horseradish peroxidase–conjugated anti-rabbit IgG, or anti-mouse IgG (Santa Cruz Biotechnology). Signals were visualized using ECL reagents (Amersham Biosciences, Piscataway, NJ), and images were quantified using ImageQuant 5.1 (Amersham Biosciences). For immunoprecipitation, 1 mg of cell extracts were incubated with WFA agarose beads (Vector Laboratories) or protein G sepharose 4 Fast Flow (GE Healthcare UK Ltd., Little Chalfont, UK) conjugated with 2 μg of antibody overnight at 4°C.
Cell Growth Analysis
Cells were plated in triplicate wells of 96-well plates at a density of 3 × 10³ cells per well. After incubation for 24 or 48 hours, 3-(4,5-dimethyl-2 thiazolyl)-2,5-diphenyl-2H-tetrazolium bromide solution (MTT; Sigma-Aldrich) was added to each well at a final concentration of 0.5 mg/mL and was incubated for 4 hours to allow MTT reduction. Formazan crystals were dissolved in a solution containing 0.01 mol/L HCl and 10% (w/v) SDS, and absorbance was measured at the dual wavelengths of 570 and 630 nm using a spectrophotometer.
Anchorage-Independent Growth in Soft Agar
Cells (1 × 10⁴) in 0.3% (w/v) Bacto Agar (Sigma-Aldrich) in DMEM supplemented with 10% FBS were overlaid on a base of 0.6% Bacto Agar in DMEM supplemented with 10% FBS in 6-well plates. Cells were incubated at 37°C, 5% CO2 atmosphere. Triplicate wells were used for each cell line, and three independent experiments were performed. The number of colonies with a diameter >30 μm was counted on day 7.
Migration and Invasion Assay
Transwell motility assays were performed using 8-μm pore, 6.5-mm polycarbonate Transwell filters (Corning Costar Corp., Cambridge, MA). Single-cell suspensions (3 × 10⁵ cells) were seeded in serum-free DMEM medium onto the upper surface of the filters and were allowed to migrate toward 10% fetal calf serum/DMEM or 1 μg/mL of extracellular matrix proteins (collagen IV, fibronectin, and laminin) (Sigma-Aldrich). After a 48-hour incubation period, cells that had migrated to the underside of the filter were fixed, stained with 0.5% crystal violet (Sigma-Aldrich), and counted under a microscope at ×100 in five random fields.
Cell invasion assays were performed in BioCoat Matrigel invasion chambers (Becton-Dickinson, Bedford, MA) according to manufacturer protocols. Briefly, 500 μL of DMEM containing 10% FBS was loaded in the lower part of the chamber, and 3 × 10⁵ cells in 500 μL of serum-free DMEM were seeded to the upper part. Cells were allowed to invade the Matrigel for 48 hours in a humidified tissue culture incubator at 37°C, 5% CO2 atmosphere. Noninvading cells on the upper surface of the membrane were removed from the chamber, and the invading cells on the lower surface of the membrane were fixed with 100% methanol and were stained with 0.5% crystal violet. Invading cells were counted in each well under a phase contrast microscope. The mean ± SD values were calculated from the numbers of invading cells from three independent experiments under the microscope.
To determine the contribution of β1 integrin to migration and invasion, cells were preincubated with 10 μg/mL of β1 integrin blocking antibody (clone P4C10; Millipore Corp., Billerica, MA) or 10 μg/mL of control mouse nonimmune IgG antibody (SouthernBiotech, Birmingham, AL) for 30 minutes at 37°C.
Statistical Analysis
SPSS 10.0 for Windows software (SPSS Inc., Chicago, IL) was used to perform the statistical analyses. The comparison between pairs of categorical variables was evaluated using Pearson's χ2 test. The significance of the variations between the data resulting from different treatments was assessed by Student's t-test. Kaplan-Meier method was used for estimation of survival probabilities in various subgroups, and the significant differences in each group were analyzed by log-rank tests. Each variable possibly affecting patient survival was further evaluated by univariate and multivariate Cox proportional hazards model analysis. All statistical tests were two-sided, and those with a P < 0.05 were considered significant.
Results
B4GALNT3 Expression Correlates with the Differentiation Status of NB Tumors
To evaluate specific gene expression in heterogeneous tumors such as NB, we demonstrated that IHC analysis is a preferred method.19,27 Therefore, expression of B4GALNT3 in all 87 NB tumor tissues was examined by IHC analysis. Positive B4GALNT3 staining was observed specifically in the cytoplasm of ganglion cells of GNB tumor tissues (Figure 1A); however, expression was negligible in schwannian stromal cells. B4GALNT3 immunostaining was blocked completely by a specific peptide (Figure 1A), confirming the specificity of the anti-B4GALNT3 antibody for the IHC studies. In addition to the mature ganglion cells, neuroblastic cells showing various differentiated states in either GNB or DNB also demonstrated positive staining in the cytoplasm (Figure 1A), whereas undifferentiated neuroblastic cells usually showed negative staining (Figure 1A). Thus, B4GALNT3 expression positively correlates with the differentiation status of human NB.
Figure 1.
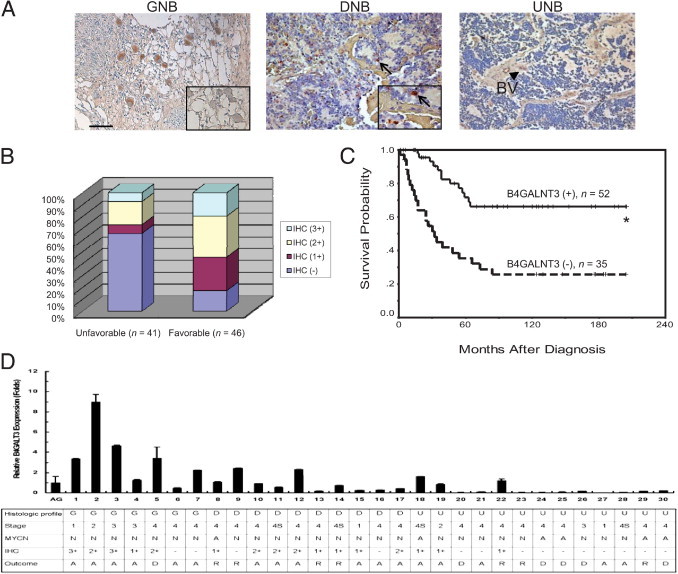
IHC analysis of B4GALNT3 in human NB cells. A: B4GALNT3 expression in GNB, DNB, and UNB. The inset in the left panel indicates the blocking of B4GALNT3 staining by the specific peptide. The negative control did not show any specific staining (not shown). Scale bar = 100 μm. Original magnification, ×200. In the middle panel, the arrows indicate DNB cells with positive staining. Original magnification, ×400 (inset). In the right panel, UNB showed negative staining. The blood vessel (BV) showed positive reactivity (arrowhead). B: Percentage distribution of B4GALNT3 expression in tumors with unfavorable and favorable histologic profiles. C: Kaplan-Meier survival analysis according to the expression of B4GALNT3 in 87 patients with NB. *P < 0.001, log-rank test. D: Correlation of clinical characteristics with expression levels of B4GALNT3 mRNA. B4GALNT3 mRNA levels in 30 NB tumors were analyzed by real-time PCR and normalized to glyceraldehyde-3-phosphate dehydrogenase. PCR signals of B4GALNT3 in three adrenal glands (AGs) were used as standards for relative fold change. Data are presented as mean ± SD from three independent experiments. In MYCN status: A, amplified; N, nonamplified. In outcome for 5-year survival analyses: A, alive; D, dead; R, recurrence.
B4GALNT3 Expression and Clinicopathologic and Biologic Factors
According to the staining percentage of B4GALNT3 in neuroblastic cells, the immunoreactivity of these NB tumors was classified into four categories: “−” (no expression, no stained cells or only isolated single stained cells seen); “1+” (weak expression, approximately 10% to 35% of neuroblastic cells stained); “2+” (moderate expression, approximately 35% to 70% of neuroblastic cells stained); and “3+” (strong expression, >70% of neuroblastic cells stained). For further statistical analysis, tumors were assigned to negative B4GALNT3 expression (“−” in immunoreactivity) and positive B4GALNT3 expression (1+, 2+, or 3+ in immunoreactivity). Positive immunoreactivities (1+ to 3+) of B4GALNT3 could be detected in 52 of the 87 NBs (60%). The intensity and percentage of positive B4GALNT3 immunostaining correlated strongly with a favorable tumor histologic profile (Figure 1B and Table 1; P < 0.001, χ2 test). The relationship between B4GALNT3 protein expression and the clinicopathologic and biologic variables of NB are summarized in Table 1. In addition to tumor histologic profile, positive B4GALNT3 immunostaining correlated with early clinical stages (stage 1, 2, or 4S; P = 0.041, χ2 test).
Table 1.
B4GALNT3 Expression and Clinicopathologic and Biologic Characteristics of NB
| Variable | Cases (no.) | Positive B4GALNT3 expression (%) | P value⁎ |
|---|---|---|---|
| Age at diagnosis | |||
| ≤1 year | 29 | 18 (62.1) | 0.757 |
| >1 year | 58 | 34 (58.6) | |
| Sex | |||
| Male | 49 | 27 (55.1) | 0.313 |
| Female | 38 | 25 (65.8) | |
| Clinical stage | |||
| 1, 2, 4S | 31 | 23 (74.2) | 0.041† |
| 3, 4 | 56 | 29 (51.8) | |
| Primary tumor site | |||
| Adrenal | 52 | 32 (61.5) | 0.682 |
| Extra-adrenal | 35 | 20 (57.1) | |
| Tumor histologic profile | |||
| Favorable | 46 | 38 (82.6) | <0.001 |
| Unfavorable | 41 | 14 (34.1) | |
| MYCN | |||
| Amplified | 23 | 10 (43.5) | 0.063 |
| Nonamplified | 64 | 42 (65.6) |
χ2 test.
Stages 1, 2, and 4S versus stages 3 and 4.
Survival analysis revealed that a trend of higher expression levels of B4GALNT3 indicated better patient prognosis (data not shown). However, because the survival probability in patients with 1+, 2+, and 3+ B4GALNT3 immunostaining was not significantly different (P = 0.1633, log-rank test), patients with 1+, 2+, and 3+ B4GALNT3 immunostaining were pooled together as a group of positive B4GALNT3 expression in subsequent analyses. Kaplan-Meier analysis showed that patients with positive B4GALNT3 expression had a more favorable outcome, with predictive 5-year survival of 71.6%, whereas patients with negative B4GALNT3 expression had predictive 5-year survival of only 35.4% (Figure 1C; P < 0.001, log-rank test). In agreement with IHC analyses, results from real-time PCR showed that expression levels of B4GALNT3 mRNA positively correlated with the differentiation status of neuroblastic tumors (Figure 1D). In addition to B4GALNT3 expression, univariate analysis also showed that younger patient age at diagnosis (≤1 year), early clinical stages (stage 1, 2, or 4S), and a favorable histologic profile also predicted better survival probability, whereas MYCN amplification suggested a very poor outcome (Table 2). Multivariate analysis by the Cox proportional hazards model showed that in addition to clinical stage and MYCN status, B4GALNT3 expression could predict patient outcome independently of other prognostic factors (Table 2). To further emphasize the significance of B4GANT3 expression in the prognostic discrimination, the impact of B4GANT3 expression on patient survival was further analyzed according to the other two independent prognostic factors of clinical stage and MYCN status. The result showed that except in patients with MYCN amplification, who had a very poor prognosis, positive B4GALNT3 expression could predict better survival probability in patients with normal MYCN status and in those with either early- or advanced-stage diseases (Figure 2). This result suggested that assessing B4GALNT3 expression may provide additional prognostic information complementary to clinical stage and MYCN status. Taken together, these data suggest that B4GALNT3 expression may predict survival of patients with NB possibly by affecting tumor cell behavior in vivo.
Table 2.
Clinicopathologic and Biologic Factors that Affect the Survival Rate
| Univariate analysis |
Multivariate analysis |
|||||
|---|---|---|---|---|---|---|
| Variable | RR | 95% CI | P value | RR | 95% CI | P value |
| Age at diagnosis: >1 year versus ≤1 year | 3.969 | 1.666–9.459 | 0.002 | 1.996 | 0.649–6.141 | 0.228 |
| Clinical stage: advanced (3, 4) versus early (1, 2, 4S) | 19.201 | 4.611–79.962 | <0.001 | 6.706 | 1.271–35.395 | 0.025 |
| MYCN: amplified versus nonamplified | 4.241 | 2.255–7.977 | <0.001 | 3.086 | 1.488–6.402 | 0.002 |
| B4GALNT3 expression: negative versus positive | 3.830 | 1.947–7.534 | <0.001 | 2.29 | 1.080–4.853 | 0.031 |
| Histologic profile: unfavorable versus favorable | 3.59 | 1.813–7.019 | <0.001 | 1.438 | 0.656–3.152 | 0.365 |
RR, relative risk.
Figure 2.
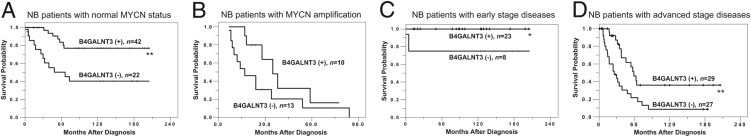
Kaplan-Meir survival analysis according to B4GALNT3 expression in patients with NB and various clinical stages and MYCN status. A: Curves for patients with normal MYCN status. Tumors with B4GALNT3 positive (+) staining predict better survival probability than do those with B4GALNT3 negative (−) staining. B: Curves for patients with MYCN amplification. C: Curves for patients with early-stage diseases. D: Curves for patients with advanced-stage diseases. *P < 0.05, **P < 0.01, log-rank test.
ATRA-Induced B4GALNT3 Expression and Transfection of SK-N-SH Cells with B4GALNT3
To investigate whether B4GALNT3 expression influenced NB cell differentiation in vitro, SK-N-SH cells were treated with ATRA for 3 days to induce differentiation. The NB cell differentiation induced by ATRA was demonstrated by increased neurite outgrowth (Figure 3A). We found that B4GALNT3 expression was enhanced after NB cell differentiation (Figure 3B). Furthermore, the neuronal differentiation induced by ATRA was further confirmed by the induction of differentiation markers GAP-43 and neuron-specific enolase.
Figure 3.
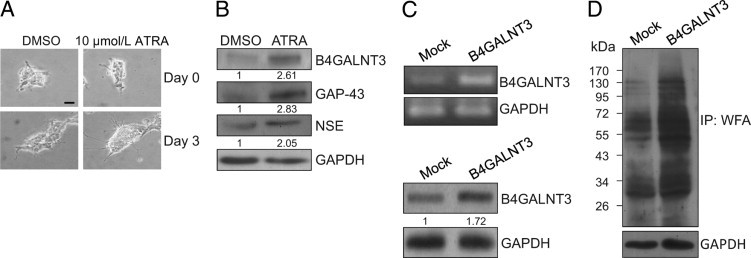
B4GALNT3 expression in SK-N-SH NB cells. A: ATRA-induced SK-N-SH cell differentiation and B4GALNT3 expression. SK-N-SH cells were treated with 10 μmol/L ATRA for 3 days. Dimethyl sulfoxide (0.1%) (DMSO) treatment was used as a control. The differentiation of SK-N-SH cells was shown by increased neurite outgrowth. Scale bar = 10 μm. B: Expression of B4GALNT3 was increased in ATRA-treated SK-N-SH cells as demonstrated by Western blot analysis. The neuronal differentiation induced by ATRA was confirmed by increased expression of GAP-43 and neuron-specific enolase (NSE). Glyceraldehyde-3-phosphate dehydrogenase (GAPDH) is an internal control. The relative band signals were quantified by ImageQuant software version 5.1 as shown. C: Forced expression of B4GALNT3 in SK-N-SH cells. SK-N-SH cells were transfected with pcDNA3.1 (mock) or pcDNA3.1/B4GALNT3 and were selected with G418 for 10 days. The G418-resistant cells were pooled, and reexpression of B4GALNT3 mRNA and B4GALNT3 protein expression were demonstrated by RT-PCR (top panel) and Western blot analysis (bottom panel), respectively. GAPDH is a loading control. D: B4GALNT3 reexpression increases the expression of LacdiNAc structure. The expression of LacdiNAc was detected by Western blot analysis with WFA. GAPDH is a loading control. The molecular weight marker is shown on the left. IP, immunoprecipitated.
To elucidate the effects of B4GALNT3 on NB cells, SK-N-SH cells were transfected with pcDNA3.1 containing B4GALNT3. We tried to isolate single clones with G418 selection, but these clones did not survive stably. We, therefore, pooled the mock- or B4GALNT3-transfected cells for further experiments after selection with 400 μg of G418 for 10 days. Transfection efficiency was nearly 70%, and the pooled B4GALNT3-transfected cells could be grown in vitro for 1 month. B4GALNT3 reexpression in SK-N-SH cells was demonstrated by RT-PCR and immunoblotting analysis (Figure 3C). Recombinant B4GALNT3 expression increased WFA binding to several glycoproteins, suggesting that it had intact enzymatic activity to promote formation of LacdiNAc in NB cells (Figure 3D).
B4GALNT3 Expression Inhibits Anchorage-Dependent and Anchorage-Independent Cell Growth
To determine whether B4GALNT3 reexpression affected anchorage-dependent cell growth, cell viability was analyzed by MTT assays. The mean ± SD relative viability of B4GALNT3 transfectants of SK-N-SH cells observed at 24 and 48 hours was 93.9% ± 2.2% and 85.0% ± 2.5%, respectively, compared with mock transfectants (Figure 4A). Next, we analyzed the effect of B4GALNT3 reexpression on anchorage-independent cell growth of SK-N-SH cells by colony formation assays in soft agar. The mean ± SD colony number of B4GALNT3 transfectants was 8.7 ± 2.5 compared with 19.0 ± 2.6 for mock transfectants (Figure 4B). To further confirm these effects, we used another NB cell line, SH-SY5Y. We also found that forced expression of B4GALNT3 significantly suppressed cell viability (Figure 4C) and colony formation of SH-SY5Y cells (Figure 4D). These results suggest that B4GALNT3 reexpression decreases cell viability and colony-forming ability in SK-N-SH and SH-SY5Y cells.
Figure 4.
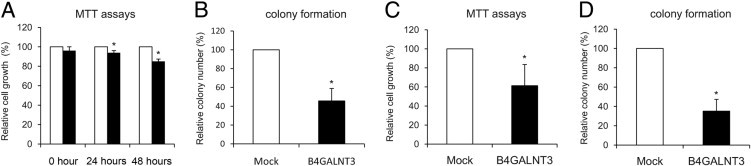
B4GALNT3 suppresses cell growth and colony formation of SK-N-SH and SH-SY5Y cells. A: B4GALNT3 expression suppresses anchorage-dependent cell growth of SK-N-SH cells. MTT assays were performed to analyze the viability of SK-N-SH cells transfected with mock (open bars) or B4GALNT3 (black bars). *P < 0.01 compared with mock transfectants. B: B4GALNT3 suppresses anchorage-independent cell growth of SK-N-SH cells in soft agar. Mock (open bars) and B4GALNT3 (black bars) were seeded into soft agar for 14 days. Colony numbers (colony size >50 μm) were counted under a microscope after crystal violet staining. *P < 0.01 compared with mock transfectants. C: B4GALNT3 inhibits the viability of SH-SY5Y cells analyzed by MTT assays after plating cells for 48 hours. *P < 0.01. D: B4GALNT3 inhibits colony formation of SH-SY5Y cells in soft agar. *P < 0.01. Data are presented as mean ± SD from three independent experiments.
B4GALNT3 Suppresses Cell Migration and Invasion
To examine whether B4GALNT3 reexpression can regulate cell migration, transwell migration assays and wound-healing assays were performed. Relative SK-N-SH cell migration of B4GALNT3 transfectants decreased to a mean ± SD of 66.4% ± 13.6% compared with mock transfectants (Figure 5A). Consistent with these results, wound-healing assays showed that the migration rate of B4GALNT3 transfectants was significantly slower than that of mock transfectants (data not shown). Next, we examined the effect of B4GALNT3 on SK-N-SH cell invasion by a Matrigel invasion assay that mimics active transmigration of cancer cells across a reconstituted basement membrane. The invading ability of B4GALNT3 transfectants was dramatically decreased to a mean ± SD 25.3% ± 3.7% compared with mock transfectants (Figure 5B). In addition, we also found that B4GALNT3 reexpression significantly suppressed cell migration (Figure 5C) and invasion (Figure 5D) of SH-SY5Y cells. These results suggest that reexpression of B4GALNT3 suppresses cell migration and invasion in SK-N-SH and SH-SY5Y cells.
Figure 5.
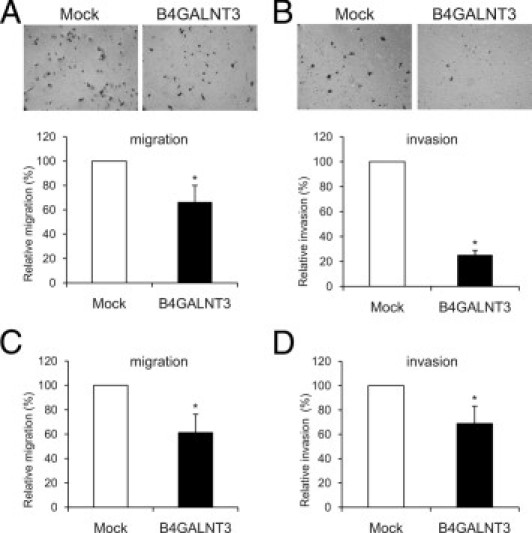
B4GALNT3 suppresses cell migration and invasion of SK-N-SH and SH-SY5Y cells. A: B4GALNT3 reexpression decreases SK-N-SH cell migration. Transwell migration assays were performed to analyze the effect of B4GALNT3 on cell migration. Mock or B4GALNT3 transfectants of SK-N-SH cells (2 × 10⁵) were seeded into the upper chamber, and 10% FBS in the lower chamber was used as chemoattractant. After 48 hours, migrated cells in the lower chamber were stained, and the representative images are shown in the top panel. Original magnification, ×100. The relative migration of mock (open bars) and B4GALNT3 (black bars) transfectants is shown in the bottom panel. Three independent experiments were analyzed. *P < 0.01 compared with mock transfectants. B: B4GALNT3 suppresses SK-N-SH cell invasion. B4GALNT3 reexpression decreased cell invasiveness analyzed by Matrigel invasion assays. Mock or B4GALNT3 transfectants (2 × 10⁵) were seeded in each chamber and cultured for 48 hours. Invaded cells were fixed and stained with crystal violet, and representative images are shown (top panel). The invaded cells of mock (open bar) and B4GALNT3 (black bars) transfectants from five fields were counted under a phase contrast microscope and are shown (bottom panel). *P < 0.01 compared with mock transfectants. C: B4GALNT3 inhibits SH-SY5Y cell migration by transwell assays. *P < 0.01. D: B4GALNT3 suppresses SH-SY5Y cell invasion by Matrigel invasion assays. *P < 0.01. The results of three independent experiments are presented as mean ± SD.
Effects of B4GALNT3 Expression on β1 Integrin Glycosylation and Its Downstream Signaling
Because integrin-mediated signaling pathways play key roles in regulating cell survival, migration, and invasion, we investigated whether these pathways were affected by B4GALNT3 expression. We found that B4GALNT3 reexpression significantly suppressed SK-N-SH cell migration toward collagen IV, fibronectin, and laminin by transwell migration assays (Figure 6A). It was also found that cell adhesion to these extracellular matrix proteins was decreased (data not shown). Notably, β1 integrin blocking antibody significantly decreased cell migration toward fibronectin and invasion to mean ± SD 35.7% ± 4.8% and 16.1% ± 2.5%, respectively, compared with nonimmune IgG control antibody (Figure 6A). These data suggest that β1 integrin plays a critical role in migration and invasion of SK-N-SH cells. We, therefore, investigated whether B4GALNT3 could modify β1 integrin glycosylation and its downstream signaling. We found that WFA lectin pulled down more β1 integrin molecules in B4GALNT3 transfectants than in mock transfectants (Figure 6B). Moreover, B4GALNT3 transfectants of SK-N-SH cells expressed more LacdiNAc structure on β1 integrin than did mock transfectants (Figure 6B). Indeed, we found that β1 integrins in primary NB tissues carry the LacdiNAc structure (data not shown).
Figure 6.
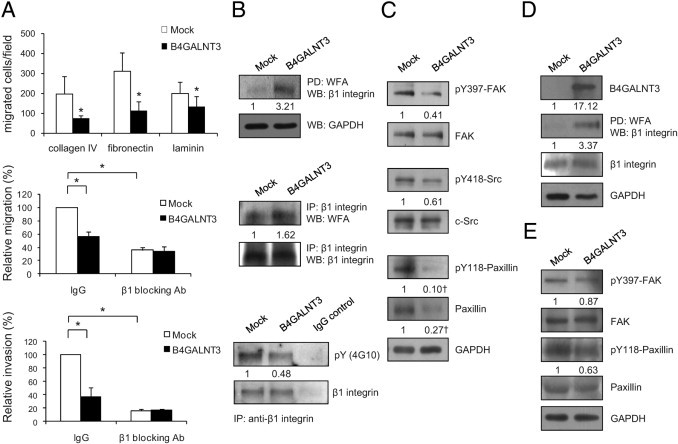
Effects of B4GALNT3 on β1 integrin glycosylation and signaling. A: B4GALNT3 reexpression suppresses SK-N-SH cell migration toward collagen IV, fibronectin, and laminin (top panel). β1 Integrin blocking antibody (Ab) (P4C10) significantly inhibits migration toward fibronectin (middle panel) and invasion (lower panel) of SK-N-SH cells. IgG is a control Ab. Results of three independent experiments are presented as mean ± SD. *P < 0.01. B: B4GALNT3 adds the LacdiNAc structure on β1 integrin and affects its phosphorylation in SK-N-SH cells. Equal amounts of cell lysates from mock and B4GALNT3 transfectants were pulled down (PD) with WFA lectins and then Western blotted (WB) with an anti–β1 integrin antibody (top set). Cell lysates were immunoprecipitated (IP) with an anti–β1 integrin Ab and then were blotted with WFA lectins (middle set). B4GALNT3 decreases phosphorylation of β1 integrin (bottom set). The β1 integrins were IP with an anti–β1 integrin antibody or a control IgG and then were immunoblotted with 4G10 or an anti–β1 integrin antibody as indicated. C: B4GALNT3 decreases tyrosine phosphorylation of FAK, Src, and paxillin in SK-N-SH cells. The band intensity of pY397-FAK and pY418-Src was normalized to their total proteins. †The band intensity of pY118-paxillin and total paxillin was normalized to glyceraldehyde-3-phosphate dehydrogenase (GAPDH). This figure is the representative of three independent experiments. The signals were quantified by ImageQuant 5.1 and were normalized to their controls. D: β1 Integrins are decorated with more LacdiNAc structures in B4GALNT3-stable transfectants than in mock transfectants of SH-SY5Y cells. B4GALNT3 overexpression was confirmed by WB analysis with anti-B4GALNT3 antibody. β1 Integrins were PD with WFA and then immunoblotted with anti–β1 integrin antibody. The signal was quantified by ImageQuant 5.1 and was normalized to their controls. E: B4GALNT3 decreases the phosphorylation (p) of FAK and paxillin in SH-SY5Y cells.
To elucidate signaling changes caused by B4GALNT3 expression, β1 integrin and its immediate downstream molecules FAK, Src, and paxillin were analyzed by immunoblotting with phospho-specific antibodies. Tyrosine phosphorylation of β1 integrin was decreased in B4GALNT3 transfectants compared with in mock transfectants (Figure 6B). Moreover, phosphorylation levels of β1 integrin downstream signaling molecules, including FAK at Y397, paxillin at Y118, and Src at Y418, were also decreased in B4GALNT3 transfectants compared with in mock transfectants (Figure 6C). Furthermore, we observed that the expression of paxillin protein was markedly inhibited by B4GALNT3 expression. To further confirm the effects of B4GALNT3 on β1 integrin glycosylation and signaling, SH-SY5Y cells were analyzed. These data showed that B4GALNT3 expression also increased the LacdiNAc structure on β1 integrins in SH-SY5Y cells (Figure 6D). Moreover, the phosphorylation of FAK and paxillin was also suppressed (Figure 6E). These results suggest that B4GALNT3 expression increases the LacdiNAc structure on β1 integrin and suppresses its signaling pathways in SK-N-SH and SH-SY5Y cells.
Inhibition of Akt and ERK Activity Is Required for B4GALNT3 to Suppress NB Cell Migration and Invasion
Malignant cell survival and migration are closely associated with Akt and ERK1/2 activation, and both are downstream signaling molecules of β1 integrin. Therefore, we also examined the effect of B4GALNT3 overexpression on Akt and ERK phosphorylation. Overexpression of B4GALNT3 significantly suppressed Akt and ERK1/2 phosphorylation, whereas the expression levels of total Akt and ERK1/2 remained unchanged (Figure 7A). To elucidate the role of Akt and ERK in decreased migration and invasion caused by B4GALNT3, constitutively active Akt or MEK was introduced into B4GALNT3 transfectants. Overexpression of Akt and MEK was confirmed by real-time PCR (data not shown). We found that Akt and ERK overexpression significantly reversed the suppressive effect of B4GALNT3 on migration (Figure 7B) and invasion (Figure 7C). These data suggest that suppression of Akt and ERK activation is required for B4GALNT3 to inhibit NB cell migration and invasion.
Figure 7.
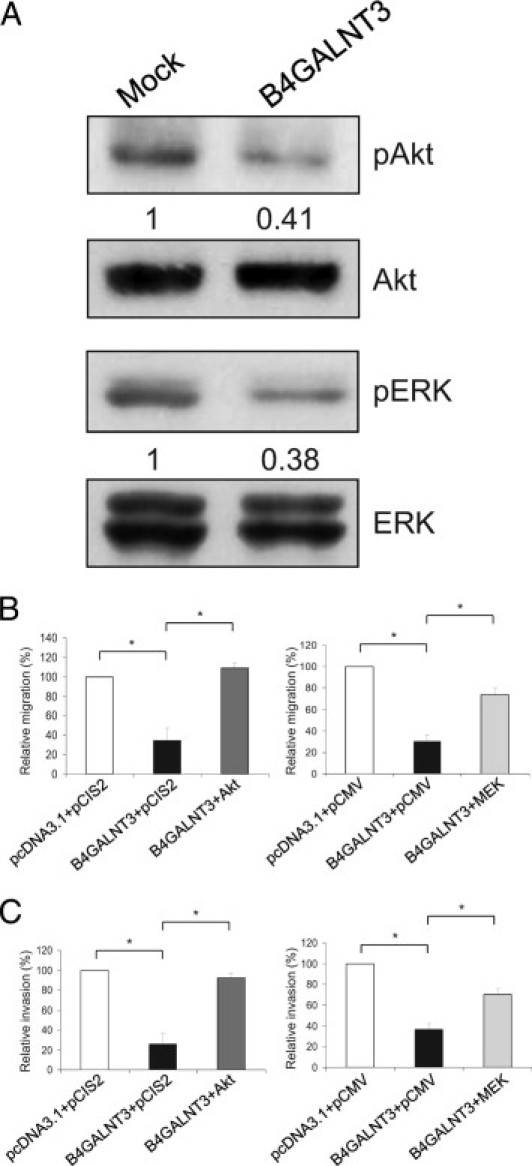
Role of Akt and ERK in B4GALNT3-suppressed migration and invasion. A: B4GALNT3 suppresses phosphorylation (p) of Akt and ERK1/2 in SK-N-SH cells. B and C: Constitutively active Akt (left panels) and MEK (right panels) significantly reversed the inhibitory effect of B4GALNT3 on migration (B) and invasion (C). The results of three independent experiments are presented as mean ± SD. *P < 0.01.
Discussion
B4GALNT3 has in vitro activity to promote the synthesis of LacdiNAc, an important structure found on glycoproteins expressed by neurons.14 Herein, we demonstrated that B4GALNT3 was highly expressed in either differentiated NB or mature ganglion cells. However, its expression was markedly decreased in UNB cells. B4GALNT3 expression correlates well with early clinical stages and, hence, predicts a favorable outcome in patients with NB. Reexpression of B4GALNT3 in NB cells resulted in reduction of malignant phenotypes, including cell growth, colony formation, migration, and invasion. Moreover, these data show that these phenotypic changes caused by B4GALNT3 expression are likely mediated through suppression of β1 integrin–mediated signaling and attenuation of Akt and ERK activation. Thus, B4GALNT3 may play a critical role in suppressing the malignant properties of NB, and its altered expression may contribute to the pathogenesis of NB.
NB is a heterogeneous tumor. The treatment of NB is based on patient risk grouping according to various clinicopathologic and biologic factors.23 Detailed evaluation of biologic markers of NB is crucial for tailored therapy for each patient. Of the clinical and biologic prognostic factors of NB, clinical stage and MYCN status are the two most important factors for risk grouping of patients.23 However, the prognosis of patients with NB with the same clinical stage or MYCN status still varies. The present study revealed that B4GALNT3 expression could discriminate the prognostic difference among patients with NB and any clinical stages and patients with NB and a normal MYCN status (Figure 2). The result suggested that assessing B4GALNT3 by simple IHC staining may provide additional prognostic information complementary to clinical stage and MYCN status, which, in turn, may allow the physician to determine the most appropriate therapy for each patient with NB.
The present result demonstrated that B4GALNT3 expression strongly correlated with a favorable tumor histologic profile. However, in multivariate survival analysis, only B4GALNT3 expression but not tumor histologic profile predicted prognosis independently. This finding suggests that B4GALNT3 expression may inhibit the NB cell malignant phenotype by alternative mechanisms in addition to affecting cell differentiation. The present cell line studies demonstrated that B4GALNT3 expression significantly suppressed cell growth, colony formation, migration, and invasion.
Another important finding is that B4GALNT3 reexpression significantly inhibited phosphorylation of β1 integrin and its downstream signaling molecules FAK, Src, and paxillin. Integrins play a crucial role in cell survival, differentiation, migration, and invasion through the recruitment and activation of signaling proteins such as FAK and c-Src.28 The FAK-Src complex binds to and phosphorylates various adaptor proteins, including paxillin, which serves as a platform for the recruitment of numerous proteins that together control the cytoskeletal reorganization and gene expression that are necessary for cell migration and survival.29 Activated FAK-Src complex in many tumor cells generates signals leading to tumor growth and metastasis.28 Moreover, the paxillin-ERK complex plays a role in cell survival and motility.30 Furthermore, ERK can regulate cell invasion by modulating the proteolytic enzymes that degrade the basement membrane.31 We showed that B4GALNT3 suppresses ERK phosphorylation. In addition, we found that Akt activation is significantly suppressed by B4GALNT3. Activation of Akt predicts poor outcome in NB and inhibits TRAIL (tumor necrosis factor–related apoptosis-inducing ligand)- or chemotherapy-induced apoptosis of NB cells.32 The present data also showed that constitutively active Akt or MEK can significantly reverse the suppressive effect of B4GALNT3 on migration and invasion. Thus, decreased ERK and Akt signaling in NB may be essential for the phenotypic changes caused by B4GALNT3 expression. Because ERK and Akt are important downstream signaling molecules for integrins and receptor tyrosine kinases, it is possible that B4GALNT3 affects signaling through both types of receptors on the cell surface. Although a detailed mechanism explaining how these signaling pathways affect NB requires further investigation, the present data strongly suggest that B4GALNT3 is an effective suppressor of NB cell malignancy.
There are several possible mechanisms that determine how B4GALNT3 regulates cell signaling. One possibility is that B4GALNT3 modifies carbohydrates on integrins, followed by conformational changes that, in turn, modulate cell signaling and cellular properties. For example, GnT-V, GnT-III, ST6GalNAc I, and ST6Gal-I directly modify carbohydrate structures on β1 integrin and affect integrin activity.33–36 These changes in N-glycosylation33,37 or O-glycosylation36 of β1 integrin lead to altered cell morphologic features and behavior. B4GALNT3 modifies N- and O-glycans decorated with GlcNAc in vitro.7 In the present study, we found that B4GALNT3 adds LacdiNAc to β1 integrin and, thereby, suppresses its downstream signaling. Glycolipids on the cell surface may interact with functional membrane proteins, such as integrins, growth factor receptors, and Src family kinases to form glycosynaptic microdomains that control cell adhesion, growth, and motility.38 Because B4GALNT3 also exhibits enzymatic activity to modify glycolipids with the LacdiNAc structure, it is possible that B4GALNT3 modulates integrin signaling and tumor cell behavior via changing the carbohydrate structures of glycolipids at the glycosynapse.
In summary, we demonstrate, for the first time, that B4GALNT3 may play a critical role in regulating NB malignancy. Expression of B4GALNT3 positively correlates with the differentiation status of NB. We present evidence that B4GALNT3 expression suppresses malignant properties of NB cells by modifying β1 integrin with LacdiNAc to inhibit downstream signaling through FAK, Src, and paxillin. The present findings suggest that B4GALNT3 inhibits cell migration and invasion primarily through β1 integrin. These effects of B4GALNT3 on migration and invasion are dependent on Akt and ERK signaling pathways.
Footnotes
Supported by the Frontier and Innovative Research Program of National Taiwan University (grant 95R0101 to M.-C.H.), by the National Health Research Institute (grants NHRI-EX97-9410BC to M.-C.H. and NHRI-EX96-9620NI to W.-M.H.), by the National Science Council (R.O.C. grants NSC98-2320-B-002-032-MY3 to M.-C.H. and NSC99-2628-B-002-056-MY3 to W.-M.H.), and, in part, by the Intramural Research Program of the National Center for Complementary and Alternative Medicine, National Institutes of Health (M.J.Q.).
W.-M.H. and M.-I.C. contributed equally to this work.
References
- 1.Gurney J.G., Severson R.K., Davis S., Robison L.L. Incidence of cancer in children in the United States: sex-, race-, and 1-year age-specific rates by histologic type. Cancer. 1995;75:2186–2195. doi: 10.1002/1097-0142(19950415)75:8<2186::aid-cncr2820750825>3.0.co;2-f. [DOI] [PubMed] [Google Scholar]
- 2.Maris J.M., Matthay K.K. Molecular biology of neuroblastoma. J Clin Oncol. 1999;17:2264–2279. doi: 10.1200/JCO.1999.17.7.2264. [DOI] [PubMed] [Google Scholar]
- 3.Brodeur G.M. Neuroblastoma: biological insights into a clinical enigma. Nat Rev Cancer. 2003;3:203–216. doi: 10.1038/nrc1014. [DOI] [PubMed] [Google Scholar]
- 4.Breen K.C., Coughlan C.M., Hayes F.D. The role of glycoproteins in neural development function, and disease. Mol Neurobiol. 1998;16:163–220. doi: 10.1007/BF02740643. [DOI] [PubMed] [Google Scholar]
- 5.Fuster M.M., Esko J.D. The sweet and sour of cancer: glycans as novel therapeutic targets. Nat Rev Cancer. 2005;5:526–542. doi: 10.1038/nrc1649. [DOI] [PubMed] [Google Scholar]
- 6.Hakomori S. Tumor-associated carbohydrate antigens defining tumor malignancy: basis for development of anti-cancer vaccines. Adv Exp Med Biol. 2001;491:369–402. doi: 10.1007/978-1-4615-1267-7_24. [DOI] [PubMed] [Google Scholar]
- 7.Sato T., Gotoh M., Kiyohara K., Kameyama A., Kubota T., Kikuchi N., Ishizuka Y., Iwasaki H., Togayachi A., Kudo T., Ohkura T., Nakanishi H., Narimatsu H. Molecular cloning and characterization of a novel human β1,4-N-acetylgalactosaminyltransferase, β4GalNAc-T3, responsible for the synthesis of N,N′-diacetyllactosediamine, galNAc β1-4GlcNAc. J Biol Chem. 2003;278:47534–47544. doi: 10.1074/jbc.M308857200. [DOI] [PubMed] [Google Scholar]
- 8.Green E.D., van Halbeek H., Boime I., Baenziger J.U. Structural elucidation of the disulfated oligosaccharide from bovine lutropin. J Biol Chem. 1985;260:15623–15630. [PubMed] [Google Scholar]
- 9.Green E.D., Baenziger J.U. Asparagine-linked oligosaccharides on lutropin, follitropin, and thyrotropin, II: distributions of sulfated and sialylated oligosaccharides on bovine, ovine, and human pituitary glycoprotein hormones. J Biol Chem. 1988;263:36–44. [PubMed] [Google Scholar]
- 10.Green E.D., Baenziger J.U. Asparagine-linked oligosaccharides on lutropin, follitropin, and thyrotropin, I: structural elucidation of the sulfated and sialylated oligosaccharides on bovine, ovine, and human pituitary glycoprotein hormones. J Biol Chem. 1988;263:25–35. [PubMed] [Google Scholar]
- 11.Skelton T.P., Kumar S., Smith P.L., Beranek M.C., Baenziger J.U. Pro-opiomelanocortin synthesized by corticotrophs bears asparagine-linked oligosaccharides terminating with SO4-4GalNAcβ1,4GlcNAcβ1,2Manα. J Biol Chem. 1992;267:12998–13006. [PubMed] [Google Scholar]
- 12.Siciliano R.A., Morris H.R., Bennett H.P., Dell A. O-glycosylation mimics N-glycosylation in the 16-kDa fragment of bovine pro-opiomelanocortin: the major O-glycan attached to Thr-45 carries SO4-4GalNAcβ1-4GlcNAc β1-, which is the archetypal non-reducing epitope in the N-glycans of pituitary glycohormones. J Biol Chem. 1994;269:910–920. [PubMed] [Google Scholar]
- 13.Siciliano R.A., Morris H.R., McDowell R.A., Azadi P., Rogers M.E., Bennett H.P., Dell A. The Lewis x epitope is a major non-reducing structure in the sulphated N-glycans attached to Asn-65 of bovine pro-opiomelanocortin. Glycobiology. 1993;3:225–239. doi: 10.1093/glycob/3.3.225. [DOI] [PubMed] [Google Scholar]
- 14.Fiete D., Mi Y., Oats E.L., Beranek M.C., Baenziger J.U. N-linked oligosaccharides on the low density lipoprotein receptor homolog SorLA/LR11 are modified with terminal GalNAc-4-SO4 in kidney and brain. J Biol Chem. 2007;282:1873–1881. doi: 10.1074/jbc.M606455200. [DOI] [PubMed] [Google Scholar]
- 15.Stolz A., Haines N., Pich A., Irvine K.D., Hokke C.H., Deelder A.M., Gerardy-Schahn R., Wuhrer M., Bakker H. Distinct contributions of β4GalNAcTA and β4GalNAcTB to Drosophila glycosphingolipid biosynthesis. Glycoconj J. 2008;25:167–175. doi: 10.1007/s10719-007-9069-5. [DOI] [PubMed] [Google Scholar]
- 16.Haines N., Stewart B.A. Functional roles for β,4-N-acetlygalactosaminyltransferase-A in Drosophila larval neurons and muscles. Genetics. 2007;175:671–679. doi: 10.1534/genetics.106.065565. [DOI] [PMC free article] [PubMed] [Google Scholar]
- 17.Shimada H., Ambros I.M., Dehner L.P., Hata J., Joshi V.V., Roald B. Terminology and morphologic criteria of neuroblastic tumors: recommendations by the International Neuroblastoma Pathology Committee. Cancer. 1999;86:349–363. [PubMed] [Google Scholar]
- 18.Shimada H., Ambros I.M., Dehner L.P., Hata J., Joshi V.V., Roald B., Stram D.O., Gerbing R.B., Lukens J.N., Matthay K.K., Castleberry R.P. The International Neuroblastoma Pathology Classification (the Shimada system) Cancer. 1999;86:364–372. [PubMed] [Google Scholar]
- 19.Hsu W.M., Hsieh F.J., Jeng Y.M., Kuo M.L., Tsao P.N., Lee H., Lin M.T., Lai H.S., Chen C.N., Lai D.M., Chen W.J. GRP78 expression correlates with histologic differentiation and favorable prognosis in neuroblastic tumors. Int J Cancer. 2005;113:920–927. doi: 10.1002/ijc.20693. [DOI] [PubMed] [Google Scholar]
- 20.Brodeur G.M., Pritchard J., Berthold F. Revisions of the international criteria for neuroblastoma diagnosis, staging, and response to treatment. J Clin Oncol. 1993;11:1466–1477. doi: 10.1200/JCO.1993.11.8.1466. [DOI] [PubMed] [Google Scholar]
- 21.Tajiri T., Shono K., Fujii Y., Noguchi S., Kinoshita Y., Tsuneyoshi M., Suita S. Highly sensitive analysis for N-myc amplification in neuroblastoma based on fluorescence in situ hybridization. J Pediatr Surg. 1999;34:1615–1619. doi: 10.1016/s0022-3468(99)90628-0. [DOI] [PubMed] [Google Scholar]
- 22.Kopf I., Hanson C., Delle U., Verbiene I., Weimarck A. A rapid and simplified technique for analysis of archival formalin-fixed, paraffin-embedded tissue by fluorescence in situ hybridization (FISH) Anticancer Res. 1996;16:2533–2536. [PubMed] [Google Scholar]
- 23.Castleberry R.P. Neuroblastoma. Eur J Cancer. 1997;33:1430–1438. doi: 10.1016/s0959-8049(97)00308-0. [DOI] [PubMed] [Google Scholar]
- 24.Montagnani M., Ravichandran L.V., Chen H., Esposito D.L., Quon M.J. Insulin receptor substrate-1 and phosphoinositide-dependent kinase-1 are required for insulin-stimulated production of nitric oxide in endothelial cells. Mol Endocrinol. 2002;16:1931–1942. doi: 10.1210/me.2002-0074. [DOI] [PubMed] [Google Scholar]
- 25.Chen C.H., Wang W.J., Kuo J.C., Tsai H.C., Lin J.R., Chang Z.F., Chen R.H. Bidirectional signals transduced by DAPK-ERK interaction promote the apoptotic effect of DAPK. EMBO J. 2005;24:294–304. doi: 10.1038/sj.emboj.7600510. [DOI] [PMC free article] [PubMed] [Google Scholar]
- 26.Huang M., Laskowska A., Vestweber D., Wild M. The α(1,3)-fucosyltransferase Fuc-TIV, but not Fuc-TVII, generates sialyl Lewis X-like epitopes preferentially on glycolipids. J Biol Chem. 2002;277:47786–47795. doi: 10.1074/jbc.M208283200. [DOI] [PubMed] [Google Scholar]
- 27.Hsu W.M., Lee H., Juan H.F., Shih Y.Y., Wang B.J., Pan C.Y., Jeng Y.M., Chang H.H., Lu M.Y., Lin K.H., Lai H.S., Chen W.J., Tsay Y.G., Liao Y.F., Hsieh F.J. Identification of GRP75 as an independent favorable prognostic marker of neuroblastoma by a proteomics analysis. Clin Cancer Res. 2008;14:6237–6245. doi: 10.1158/1078-0432.CCR-07-4181. [DOI] [PubMed] [Google Scholar]
- 28.Mitra S.K., Schlaepfer D.D. Integrin-regulated FAK-Src signaling in normal and cancer cells. Curr Opin Cell Biol. 2006;18:516–523. doi: 10.1016/j.ceb.2006.08.011. [DOI] [PubMed] [Google Scholar]
- 29.Deakin N.O., Turner C.E. Paxillin comes of age. J Cell Sci. 2008;121:2435–2444. doi: 10.1242/jcs.018044. [DOI] [PMC free article] [PubMed] [Google Scholar]
- 30.Ishibe S., Joly D., Liu Z.X., Cantley L.G. Paxillin serves as an ERK-regulated scaffold for coordinating FAK and Rac activation in epithelial morphogenesis. Mol Cell. 2004;16:257–267. doi: 10.1016/j.molcel.2004.10.006. [DOI] [PubMed] [Google Scholar]
- 31.Reddy K., Nabha S., Atanaskova N. Role of MAP kinase in tumor progression and invasion. Cancer Metastasis Rev. 2003;22:395–403. doi: 10.1023/a:1023781114568. [DOI] [PubMed] [Google Scholar]
- 32.Opel D., Poremba C., Simon T., Debatin K.M., Fulda S. Activation of Akt predicts poor outcome in neuroblastoma. Cancer Res. 2007;67:735–745. doi: 10.1158/0008-5472.CAN-06-2201. [DOI] [PubMed] [Google Scholar]
- 33.Seales E., Jurado G., Brunson B., Wakefield J., Frost A., Bellis S. Hypersialylation of beta1 integrins, observed in colon adenocarcinoma, may contribute to cancer progression by up-regulating cell motility. Cancer Res. 2005;65:4645–4652. doi: 10.1158/0008-5472.CAN-04-3117. [DOI] [PubMed] [Google Scholar]
- 34.Isaji T., Gu J., Nishiuchi R., Takahashi M., Miyoshi E., Honke K., Honke K., Sekiguchi K., Taniguchi N. Introduction of bisecting GlcNAc into integrin α5β1 reduces ligand binding and down-regulates cell adhesion and cell migration. J Biol Chem. 2004;279:19747–19754. doi: 10.1074/jbc.M311627200. [DOI] [PubMed] [Google Scholar]
- 35.Guo H., Lee I., Kamar M., Akiyama S., Pierce M. Aberrant N-glycosylation of β1 integrin causes reduced α5β1 integrin clustering and stimulates cell migration. Cancer Res. 2002;62:6837–6845. [PubMed] [Google Scholar]
- 36.Clement M., Rocher J., Loirand G., Le Pendu J. Expression of sialyl-Tn epitopes on β1 integrin alters epithelial cell phenotype, proliferation and haptotaxis. J Cell Sci. 2004;117:5059–5069. doi: 10.1242/jcs.01350. [DOI] [PubMed] [Google Scholar]
- 37.Seales E., Jurado G., Singhal A., Bellis S. Ras oncogene directs expression of a differentially sialylated, functionally altered β1 integrin. Oncogene. 2003;22:7137–7145. doi: 10.1038/sj.onc.1206834. [DOI] [PubMed] [Google Scholar]
- 38.Regina Todeschini A., Hakomori S.I. Functional role of glycosphingolipids and gangliosides in control of cell adhesion, motility, and growth, through glycosynaptic microdomains. Biochim Biophys Acta. 2008;1780:421–433. doi: 10.1016/j.bbagen.2007.10.008. [DOI] [PMC free article] [PubMed] [Google Scholar]