

Abstract
Two subgroups of invasive breast carcinomas have been identified with a poor prognosis in different patient cohorts: the basal-like category and the subgroup containing proteins capable of inducing metastasis in experimental rodents, the metastasis-inducing proteins (MIPs). Here we identify by immunohistochemical staining for cytokeratin CK5/6 or CK14 the basal-like subgroup in a set of 297 primary invasive breast carcinomas in which the staining profile for the MIPs S100A4, osteopontin, anterior gradient-2, and S100P has already been established. Monoclonal antibodies to CK5/6 or CK14 specifically stain 31% to 34% of the primary carcinomas. These positively stained tumors are highly significantly associated with premature death of the patient (Wilcoxon statistics, P < 0.0001), the increased relative risk being approximately 5.6-fold. Positive staining for either cytokeratin is very significantly associated with that for each of the four MIPs separately and with loss of staining for the Fanconi anemia protein FANCD2 (corrected Fisher's exact test, P < 0.0007). There is no significant correlation with the remaining tumor variables tested, including staining for the estrogen receptor α, progesterone receptor, and c-erbB-2. These results show that the basal cytokeratin-like carcinomas contain many of the MIPs and that these may arise by their selection for tumors with an inherent deficiency in the FANC/BRCA pathway of DNA repair.
Breast cancer, which usually develops from the terminal ductal lobular units,1 can be divided into two main groups, with ductal carcinomas accounting for 80% to 90% of breast cancers and lobular carcinomas accounting for 5% to 15%; the remainder represents less common, special types of cancer.2 Nonetheless, the heterogeneous nature of invasive carcinomas has previously caused difficulties in predicting prognosis. Recently, Sorlie et al3 showed that invasive breast cancer can be divided into five clear molecular subgroups with common features, using microarray gene expression profiling: luminal A, luminal B, HER2-overexpressing, normal breast-like, and basal-like categories. The luminal gene expression (GE) subgroups A and B show some but not complete similarity to expression of mRNAs found in normal luminal epithelial cells and are predominantly immunohistochemically (IHC) positive for the estrogen receptor α (ERα); the HER2 GE subgroup also produces more of the IHC-detectable c-erbB-2 receptor protein; and the normal GE subgroup expresses genes completely characteristic of normal luminal epithelial cells, including lower levels of ERα than in luminal subgroups A and B. The basal-like subgroup, in contrast, produces more of the IHC-detectable stratified epithelial cytokeratins, including CK5/6 and CK14,3,4 which are commonly found in basal epithelial and some myoepithelial cells of the breast.5 Nonetheless, the basal-like GE subgroup lacks other markers, such as smooth muscle actin/myosin, that are present in fully differentiated myoepithelial cells.6,7 The presence of expression signatures and protein markers CK5/6 and CK14 of the basal-like phenotype have repeatedly been shown to be associated with high-grade breast cancers and sometimes with poor patient outcomes.5,8–12 Because the role of stratified keratins in cancer is poorly understood, it is not clear why they should be associated with high-grade tumors and poor patient outcomes.
In parallel with the search for markers of patient outcome in human breast cancer, genes have been identified that, if transfected into and overexpressed in a benign rat mammary epithelial stem cell line13 and the resultant transfectants injected into the mammary fat pad of syngeneic rats, induce these same cells to metastasize in vivo. Four of these metastasis-inducing genes code for the proteins S100A4,14 osteopontin (OPN),15 anterior gradient-2 (AGR2),16 and S100P.17 The expression of these four metastasis-inducing proteins (MIPs) in the primary breast tumor is highly correlated and each is separately associated with early patient death from metastatic human breast cancer.17–20
It has been suggested that the MIP-coordinated expression is linked, in part, to a failure of the Fanconi anemia (FA)/BRCA tumor suppressor DNA pathway,21 because the coordinated expression of MIPs and early patient death is also highly correlated with lack of the IHC-detectable FANCD2, a pivotal component in the FA/BRCA pathway.22 Thus, the combination of overexpression of the four MIPs and lack of FANCD2 in the primary carcinomas also defines a subgroup of breast cancer patients with a poor outcome. Because there is no association of these MIPs or lack of FANCD2 with c-erbB-2,17–22 the most likely poor-prognosis category to which they might be related is that of the basal-like subgroup of breast cancers. To test this hypothesis, we have immunohistochemically stained primary carcinomas from a group of breast cancer patients for the basal cell markers CK5/6 and CK14, to identify an IHC-defined basal-like subgroup of breast cancers and assess their relationship to patient survival and to the MIPs and FANCD2 in the same set of primary breast cancers.
Materials and Methods
Patients and Specimens
A retrospective study was made using samples of 297 primary tumors from unselected breast cancer patients who presented at general surgery clinics in the Merseyside Region between 1976 and 1982. They were treated surgically by mastectomy with sampling of axillary lymph nodes (17%) or modified radical mastectomy (83%) alone; no adjuvant therapy was given, including no hormonal therapy.17–19 Only patients with operable breast cancer (T1-4, N0-1, M0) were included in the study.18,19,22 The menopausal status, treatment, tumor type, tumor size, histological grade, and lymph node status were as described previously.20 Patient age ranged from 30 to 81 years (mean, 60.3 years), and all patients had invasive carcinoma (92.3% invasive ductal; 6.1% invasive lobular; 1.6% special type of invasive breast carcinoma, mucinous and medullary). The mean patient follow-up duration was 16 years (range, 14 to 20 years), yielding a mean survival time of 9.3 years. Summary of overall patient survival and of the significant pathological prognostic variables over 20 years has been reported previously.22 Normal breast tissue was obtained as described previously.18 Approval was obtained from the Liverpool Ethics Committee, and the patient data were anonymized as described previously.22 Samples were fixed originally in neutral buffered formalin and embedded in paraffin wax, as described previously.18
IHC Staining
Histological sections cut at 4 μm were mounted on 3-aminopropyltriethoxysilane (APES)-coated slides, dewaxed in xylene, and rehydrated through ethanol to water.18 To enhance immunocytochemical staining, antigen retrieval was performed by microwaving sections at 85 W for 15 minutes in 10 mmol/L Tris-EDTA buffer, pH 9.0, for CK5/6 or 10 mmol/L citrate buffer, pH 6.0, for CK14. Endogenous peroxidase was blocked with 0.05% (v/v) H2O2 in methanol.18 For staining for CK5/6, slides were incubated for 3 hours at room temperature with mouse monoclonal antibody (mAb) to CK5/6 diluted 1:500 in 0.5% (w/v) bovine serum albumin in PBS (MAB1620; Chemicon, Hampshire, UK; Temecula, CA). Bound antibody was detected using a Dako EnVision+ system-horseradish peroxidase kit (DakoCytomation, Glostrup, Denmark; Carpinteria, CA). For staining for CK14, slides were incubated for 2.5 hours at room temperature with mouse mAb to CK14 diluted 1:30 in 0.05% (w/v) bovine serum albumin in PBS (LL002, ab7800; Abcam, Cambridge, UK). Bound antibody was detected by incubation with biotinylated sheep anti-mouse for 1 hour diluted 1:200 (Amersham; GE Healthcare, Little Chalfont, UK), followed by a commercially available ABComplex/horseradish peroxidase for 1 hour (DakoCytomation). Bound antibodies were visualized by brown staining with diaminobenzidine (DAB; Sigma-Aldrich, Poole, UK; St. Louis, MO). Nuclei were counterstained blue with Mayer's hemalum. Blocked mAb to CK14 was prepared by mixing 500 μg/mL of a synthetic peptide prepared in-house (sequence CDGKVSTHEQVLRTKN; see Purkis et al23). Double IHC staining for CK5/6 and S100A4 was conducted sequentially using the above enhanced horseradish peroxidase-diaminobenzidine-labeled polymer system for CK5/6 and then alkaline phosphatase Permanent Red chromogen-labeled polymer system for S100A4, 24 with the Dako Envision G/2 Doublestain system rabbit/mouse (Dako) giving brown or red/pink stains, respectively. The histological slides were mounted in Glycergel mounting medium (Dako). Western blots of breast carcinomas have verified the specificity of both cytokeratin mAbs used, as described previously.8,9 Photographs were recorded in a Reichert light microscope fitted with a Wratten 44 light blue-green filter or Hoya (Tokyo, Japan) 80A filter on Ilford PANF Plus (50 ASA) black and white film17 or Kodacolor Plus (200 ASA) color film, respectively.
Sections were analyzed and scored using light microscopy by three independent observers (S.de S.R., A.P.-H., and P.S.R.), including a qualified pathologist (P.S.R.), according to the percentage of tumor cells showing positive IHC staining. The percentage of stained tumor cells was recorded from two well-separated sections of each specimen, with 10 fields per section at ×200 magnification and a minimum of 200 cells per field.18 Staining for CK5/6 and CK14 was evaluated in three classes, as described previously: unstained, <1%; borderline, 1% to 5%; and positively stained, >5% of the carcinoma cells stained.17 Any disagreements were resolved by re-examination of the disputed slides and, if agreement was still not reached, by subsequent recutting and restaining fresh sections of the same area.
IHC staining data on the same group of patients had been obtained previously for S100A4,18 OPN,19 c-erbB-2, ERα, progesterone receptor (PgR), pS2, p53,25 and S100P17 using a 5% cutoff to differentiate between the unstained and positively stained carcinomas; for cathepsin D25, AGR2,20 and FANCD222 a 1% cutoff was used. These cutoffs yielded the highest risk factors between the two groups in this set of patients (see Supplemental Table S1 at http://ajp.amjpathol.org).17,20 The 5% cutoffs for ERα and c-erbB-2 staining approximated but did not replicate the standard cutoffs used in UK clinical practice26,27 and in the REMARK study,28 as described previously.22 Western blots of breast carcinomas verified the specificity of both cytokeratin mAbs used, as described previously.8,9 IHC staining for CK5/6, CK14, S100A4, S100P, OPN, AGR2 and FANCD2 was repeated for a few positive (or negative, for FANCD2) and borderline staining tumors, and the same focal (for borderline) or enhanced (for positive) staining microscopic fields (×200 magnification, 0.78 mm2) were scored for the percentage of stained carcinoma cells from two adjacent histological sections, counted five times for each of these antigens (400 to 600 cells/field). This scoring was repeated in the same immediately adjacent field for each antigen.
Statistical Methods
The association of staining for CK5/6 or CK14 in primary breast carcinomas with patient survival was calculated from life tables constructed from survival data using Kaplan-Meier plots and was analyzed by generalized Wilcoxon (Gehan) statistics.18 Patients who died of causes other than cancer were censored. Unadjusted relative risk (RR) for survival with 95% confidence interval (CI) was calculated using Cox's univariate analysis.25
The association of IHC staining for CK5/6 or CK14 with other tumor variables in this group of patients was assessed by cross-tabulation using Fisher's exact test, two-sided values of probability were given.19 The cutoff value between unstained and positively stained for CK5/6 and for CK14 was usually set at 1%, as described under Results; for the other proteins, it was set at 1% or 5%, as described above. For multiple comparisons, the resulting P values were subjected to Holm-Bonferroni correction, calculated as 1 − (1 − P)n, where n is the number of tumor variables. For overall association or clustering between staining for CK5/6 and CK14 using a 1% cutoff, for the four MIPs, and for no staining for FANCD2, Kendall's coefficient of concordance (W) was calculated to extend rank correlation to seven variables.29 Significance of the difference in pairs of means was calculated using Student's two-sided t-test; occasionally the assumption of equal variance did not hold when the F-test for comparison of variance was significantly different; in such cases, the approximate t-test for unequal variance was used.
To determine whether the association of patient survival with CK5/6 or CK14 was independent of other tumor variables found to be significantly associated in this group of patients, multivariate analyses were performed using Cox's proportional hazards model on 137 patients with full data sets.17 Incomplete data arose mainly from lack of sampling or location of lymph nodes originally and to a lesser extent to lack of sufficient malignant material remaining in some paraffin blocks to obtain satisfactory data. This analysis treated variables as categorical in positively and unstained groups defined above and used the forward stepwise Wald method, which generated the most significant variable at each step assuming proportional hazards. Data analysis was performed using Excel 2007 (Microsoft, Redmond, WA) and SPSS version 16.0 (SPSS, Chicago, IL).
Results
IHC Staining of Breast Carcinomas for CK5/6 and CK14
Normal breast tissues were incubated with mAb to CK5/6 or with mAb to CK14, but the majority of epithelial cells in the ducts remained unstained, with staining evident only in myoepithelial/basal or occasionally in suprabasally situated epithelial-like cells (Figure 1A; see also Supplemental Figure S1A at http://ajp.amjpathol.org). Some areas of epithelial hyperplasia also contained CK5/6 and CK14 staining epithelial cells (data not shown). On examination of 297 breast carcinomas for CK5/6, 204 of them (68.7%) were unstained (Figure 1B; see also Supplemental Figure S1B at http://ajp.amjpathol.org), 84 (28.3%) showed borderline staining (Figure 1C; see also Supplemental Figure S1C at http://ajp.amjpathol.org), and the remaining 9 (3.0%) showed positive staining (Figure 1D; see also Supplemental Figure S1D at http://ajp.amjpathol.org). When the same breast carcinomas were examined for CK14, 195 of them (65.7%) were unstained, 50 (16.8%) showed borderline staining, and the remaining 52 (17.5%) showed positive staining (Figure 1E; see also Supplemental Figure S1E at http://ajp.amjpathol.org). In both cases, there was no staining of stromal cells, and the staining was confined to the cytoplasm (Figure 1F; see also Supplemental Figure S1F at http://ajp.amjpathol.org). IHC staining for CK14 was abolished by prior incubation of the mAb to CK14 with our synthetic immunizing peptide (Figure 1, G and H; see also Supplemental Figure S2, A and B, at http://ajp.amjpathol.org). The assessment of the staining class was made only on malignant cells.
Figure 1.
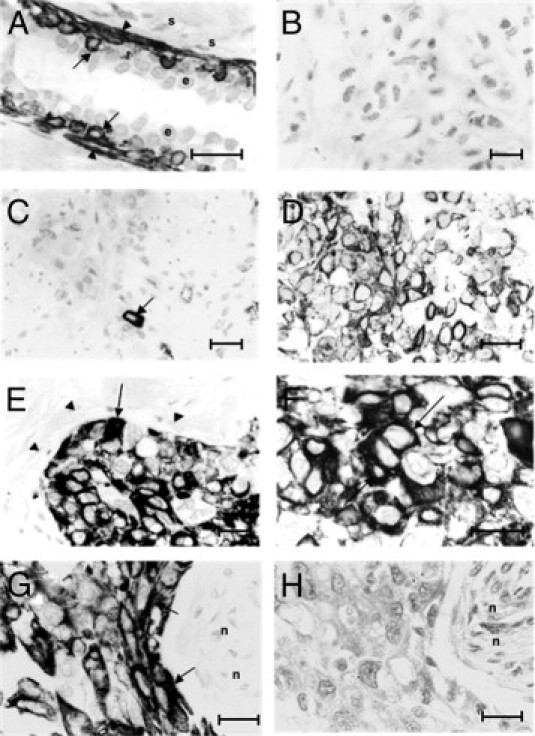
IHC staining of human breast tissues for cytokeratins CK14 and CK5/6. A: Incubation of normal breast duct tissue with antibody to CK14 shows staining of myoepithelial/basal cells (arrowheads) and of occasional suprabasal epithelial-like cells (arrows); most epithelial cells (e) and the adjacent stromal cells (s) were unstained. B: Invasive carcinoma stained for CK5/6 shows no IHC staining. C: Invasive carcinoma stained for CK5/6 shows borderline staining of the occasional malignant cell (arrow). D: Invasive carcinoma stained for CK5/6 shows positive staining for malignant cells. E: Invasive carcinoma stained for CK14 shows positive staining for malignant cells (arrow); host fibroblasts and blood vessels were unstained (arrowheads). F: A different section of the invasive carcinoma in E, at a higher magnification, illustrates cytoplasmic staining (arrows) in malignant cells stained for CK14. G and H: Adjacent sections of the same invasive carcinoma. Tissue incubated with mAb to CK14 (G) shows strong staining of the carcinoma cells; there is no staining with the same mAb preincubated with our synthetic peptide (described under Materials and Methods) (H); necrotic areas (n) were unstained under both conditions. Original magnification: ×400 (B, C, and E); ×500 (D, G, and H); ×620 (A and F). Scale bars = 25 μm.
For the purpose of most of the analyses, the borderline stained carcinomas (1% to 5% of carcinoma cells stained) were combined with the positively stained carcinomas (>5% of carcinoma cells stained), giving a group of positively stained carcinomas showing >1% of the malignant cells stained for either cytokeratin. This left the remaining group as a clearly unstained carcinoma group, with <1% of the malignant cells stained for the cytokeratins (see Supplemental Table S2 at http://ajp.amjpathol.org). There was a high level of consistency in scoring for the mAb to CK5/6 and to CK14 between the two observers, with disagreement in 6.4% and 5.9% of cases, corresponding to κ scores of 0.82 and 0.85, respectively. Intratumor heterogeneity was 6.4% and 6.9%, respectively, for two sections of the same carcinoma.
IHC Staining for Cytokeratins and Overall Patient Survival
To determine whether there was any association between staining for CK5/6 or CK14 and duration of survival of patients with breast cancer, Kaplan-Meier survival curves were plotted for patient groups with tumors classified as unstained, borderline, or positively stained for either cytokeratin. Overall, there was a significant difference using Wilcoxon (Gehan) statistics for staining for either CK5/6 or for CK14. However, differences occurred only between patients with no staining and borderline stained tumors (see Supplemental Table S2 at http://ajp.amjpathol.org). The 297 patients were therefore separated into two categorical groups, using a cutoff of 1% stained carcinoma cells. Only 10% survived with positively stained tumors for CK5/6, compared with 74% who survived with unstained tumors (see Supplemental Table S2 at http://ajp.amjpathol.org). This difference was highly significant, with a median duration of survival of 53 versus >228 months (Figure 2A). Similarly, only 12% survived with positively stained tumors for CK14, compared with 75% with unstained tumors. This difference was also highly significant, with a median duration of survival of 54 versus >228 months (Figure 2B). The differences between these curves first became statistically significant for either cytokeratin after 1 year (CK5/6 χ2 = 7.11, 1 df, P = 0.008; CK14 χ2 = 17.16, 1 df, P < 0.001). When patients with tumors unstained for either cytokeratin were compared with those with singly or doubly stained tumors for CK5/6 and CK14, they were found to be highly significantly different (see Supplemental Figure S3 at http://ajp.amjpathol.org). However, patients with tumors showing positive staining for only one cytokeratin were not significantly different from each other or from those showing positive staining for both cytokeratins (see Supplemental Figure S3 at http://ajp.amjpathol.org).
Figure 2.
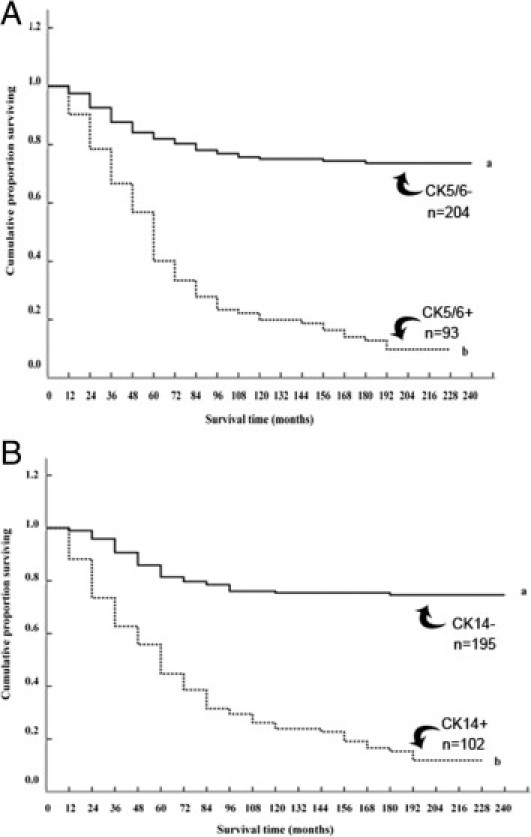
Association of IHC staining for cytokeratins CK5/6 and CK14 with overall duration of patient survival. A: The cumulative proportion of surviving patients as a percentage of the total for each year after presentation for patients with carcinomas classified as unstained (set a, solid line) or positively stained (set b, dotted line) for CK5/6. There were 154 censored observations in set a (53 dead of other causes) and 12 in set b (three dead of other causes). The two curves were highly significantly different (Wilcoxon statistic χ2 = 72.81, 1 df, P < 0.0001). B: The cumulative proportion of surviving patients with carcinomas classified as unstained (set a, solid line) or positively stained (set b, dotted line) for CK14. There were 149 censored observations in set a (48 dead of other causes) and 17 in set b (eight dead of other causes). The two curves were highly significantly different (Wilcoxon statistic χ2 = 78.63, 1 df, P < 0.0001).
Association of Cytokeratins with Other Tumor Variables
The results of the IHC staining for CK5/6 and CK14 using a 1% cutoff were cross-tabulated against pathological variables: nodal status, histological grade (I, II versus III), tumor size (T1 and T2 versus T3 and T4), and IHC staining for molecular variables (OPN, c-erbB-2, c-erbB-3, S100A4, S100P, PgR, p53, cathepsin D, pS2, ERα, AGR2, and FANCD2) taken from the same carcinoma samples. These other variables have been reported to have an effect on survival times in the same set of patients (see Supplemental Table S1 at http://ajp.amjpathol.org). Of the pathological variables, only high histological grade (grade III) showed any significant association with staining for CK5/6 (Fisher's exact test, P = 0.026), but even this association was lost when corrected for chance occurrence in multiple comparisons (corrected P = 0.34) (Table 1). When grades I and II were separated, there was a small stepwise increase in staining for either cytokeratin from 25% to 30% for grade I, through 31% to 36% for grade II to 38% to 44% for grade III tumors, but no significant stepwise correlations between staining and grade (Table 2). In contrast, there was a statistically significant association of carcinomas staining positive for CK5/6 (Table 1) or for CK14 (Table 3) with positive staining for the four MIPs [OPN (P < 0.0001), S100A4 (P < 0.0001), S100P (P ≤ 0.0007), AGR2 (P < 0.0001)] and inversely with that for FANCD2 (P < 0.0001) with or without the Holm-Bonferroni correction for multiple comparisons (Tables 1 and 3). There was also a highly significant association of staining between these two cytokeratins (P < 0.0001) (Tables 1 and 3).
Table 1.
Association of IHC Staining for CK5/6 with Other Tumor Variables
| Tumor variable⁎ | CK5/6 [no. (%)]† |
Statistical significance‡ |
||
|---|---|---|---|---|
| Unstained | Stained | Uncorrected | Corrected | |
| LN− | 82 (56) | 32 (43) | 0.065 | 0.66 |
| LN+ | 64 (44) | 43 (57) | ||
| Grade I + II | 142 (78.5) | 57 (65.5) | 0.026 | 0.34 |
| Grade III | 39 (21.5) | 30 (34.5) | ||
| Tumor, <5 cm | 158 (79) | 66 (74) | 0.45 | 1.00 |
| Tumor, >5 cm | 43 (21) | 23 (26) | ||
| OPN− | 88 (46) | 6 (7) | <0.0001 | <0.0001 |
| OPN+ | 105 (54) | 83 (93) | ||
| c-erbB-2− | 154 (78) | 68 (74) | 0.46 | 1.00 |
| c-erbB-2+ | 44 (22) | 24 (26) | ||
| c-erbB-3− | 86 (43) | 31 (34) | 0.16 | 0.93 |
| c-erbB-3+ | 112 (57) | 60 (66) | ||
| S100A4− | 145 (72) | 32 (34) | <0.0001 | <0.0001 |
| S100A4+ | 57 (28) | 61 (66) | ||
| S100P− | 97 (54) | 21 (27) | <0.0001 | 0.00069 |
| S100P+ | 82 (46) | 58 (73) | ||
| PgR− | 117 (61) | 57 (63) | 0.79 | 1.00 |
| PgR+ | 76 (39) | 34 (37) | ||
| p53− | 120 (59) | 52 (56) | 0.61 | 1.00 |
| p53+ | 82 (41) | 41 (44) | ||
| Cathepsin D− | 30 (19) | 11 (15) | 0.58 | 1.00 |
| Cathepsin D+ | 129 (81) | 63 (85) | ||
| pS2− | 116 (57) | 53 (58) | 1.00 | 1.00 |
| pS2+ | 86 (43) | 38 (42) | ||
| ERα− | 93 (46) | 44 (48) | 0.80 | 1.00 |
| ERα+ | 109 (54) | 47 (52) | ||
| AGR2− | 84 (43.5) | 8 (9) | <0.0001 | <0.0001 |
| AGR2+ | 109 (56.5) | 78 (91) | ||
| FANCD2− | 47 (25) | 56 (64) | <0.0001 | <0.0001 |
| FANCD2+ | 138 (75) | 32 (36) | ||
| CK14− | 161 (79) | 34 (37) | <0.0001 | <0.0001 |
| CK14+ | 43 (21) | 59 (63) | ||
LN, lymph node with (+) tumor or without (−) tumor deposits; grade, histological grades I and II versus histological grade III; tumor size >5 cm versus <5 cm in diameter; other tumor variables, presence (+) or absence (−) of IHC staining for molecular variables using 5% cutoff for (+) versus (−) staining class for OPN (osteopontin), ERα (estrogen receptor α), PgR (progesterone receptor), S100P , S100A4, c-erbB-2, c-erbB-3, p53, pS2, and using a 1% cutoff for (+) versus (−) staining for FANCD2, AGR2, cathepsin D, CK14.
Number (and percentage) of patients with carcinomas classified as stained or unstained for CK5/6 using a 1% cutoff.
Probability P from Fisher's exact test (two sided values), either uncorrected or corrected using the Holm-Bonferroni correction calculated as 1 − (1 − P)n, where n = 16 (see further under Materials and Methods).
Table 2.
Immunocytochemical Staining for Cytokeratins with Different Histological Grades of Breast Tumor
| Histological grade | CK5/6 [no. (%)] |
Statistical significance⁎ |
CK14 [no. (%)] |
Statistical significance⁎ |
||||
|---|---|---|---|---|---|---|---|---|
| Unstained | Stained | Contrast | P value | Unstained | Stained | Contrast | P value | |
| I | 52 (28.7) | 17 (19.5) | I vs II | 0.412 | 48 (27.6) | 21 (22.3) | I vs II | 0.437 |
| II | 90 (49.7) | 40 (46) | II vs III | 0.087 | 83 (47.7) | 47 (50) | II vs III | 0.878 |
| III | 39 (21.5) | 30 (34.5) | I vs III | 0.031 | 43 (24.7) | 26 (27.7) | I vs III | 0.473 |
Number (and percentage) of patients with carcinomas classified as stained or unstained for CK5/6 or CK14 using a 1% cutoff.
Probability P from Fisher's exact test (two sided values).
Table 3.
Association of IHC Staining for CK14 with Other Tumor Variables
| Tumor variable⁎ | CK14 [no. (%)]† |
Statistical significance‡ |
||
|---|---|---|---|---|
| Unstained | Stained | Uncorrected | Corrected | |
| LN− | 78 (54) | 36 (47) | 0.32 | 1.00 |
| LN+ | 66 (46) | 41 (53) | ||
| Grade I + II | 131 (75) | 68 (72) | 0.66 | 1.00 |
| Grade III | 43 (25) | 26 (28) | ||
| Tumor <5 cm | 148 (77.5) | 76 (77) | 0.88 | 1.00 |
| Tumor >5 cm | 43 (22.5) | 23 (23) | ||
| OPN− | 85 (46) | 9 (9) | <0.0001 | <0.0001 |
| OPN+ | 99 (54) | 89 (91) | ||
| c-erbB-2− | 149 (78) | 73 (74) | 0.46 | 1.00 |
| c-erbB-2+ | 42 (22) | 26 (26) | ||
| c-erbB-3− | 83 (44) | 34 (34) | 0.13 | 0.90 |
| c-erbB-3+ | 107 (56) | 65 (66) | ||
| S100A4− | 141 (73) | 36 (35) | <0.0001 | <0.0001 |
| S100A4+ | 52 (27) | 66 (65) | ||
| S100P− | 102 (58) | 16 (20) | <0.0001 | <0.0001 |
| S100P+ | 75 (42) | 65 (80) | ||
| PgR− | 109 (59) | 65 (66) | 0.3 | 1.00 |
| PgR+ | 76 (41) | 34 (34) | ||
| p53− | 119 (61) | 53 (52.5) | 0.17 | 0.95 |
| p53+ | 75 (39) | 48 (47.5) | ||
| Cathepsin D− | 27 (17.5) | 14 (18) | 1.00 | 1.00 |
| Cathepsin D+ | 127 (82.5) | 65 (82) | ||
| pS2− | 107 (55) | 62 (63) | 0.26 | 0.99 |
| pS2+ | 87 (45) | 37 (37) | ||
| ERα− | 82 (42) | 55 (56) | 0.036 | 0.44 |
| ERα+ | 112 (58) | 44 (44) | ||
| AGR2− | 81 (44) | 11 (12) | <0.0001 | <0.0001 |
| AGR2+ | 104 (56) | 83 (88) | ||
| FANCD2− | 41 (24) | 62 (63) | <0.0001 | <0.0001 |
| FANCD2+ | 133 (76) | 37 (37) | ||
| CK5/6− | 161 (83) | 43 (42) | <0.0001 | <0.0001 |
| CK5/6+ | 34 (17) | 59 (57) | ||
LN, lymph node with (+) tumor or without (−) tumor deposits; grade, histological grades I and II versus histological grade III; tumor size >5 cm versus <5 cm in diameter; other tumor variables, presence (+) or absence (−) of IHC staining for molecular variables using 5% cutoff for (+) versus (−) staining class for OPN (osteopontin), ERα (estrogen receptor α), PgR (progesterone receptor), S100P , S100A4, c-erbB-2, c-erbB-3, p53, pS2, and using a 1% cutoff for (+) versus (−) staining for FANCD2, AGR2, cathepsin D, CK5/6.
Number (and percentage) of patients with carcinomas classified as stained or unstained for CK14 using a 1% cutoff.
Probability P from Fisher's Exact test (two sided values), either uncorrected or corrected using the Holm-Bonferroni correction calculated as 1 − (1 − P)n, where n = 16 (see further under Materials and Methods).
For the remaining molecular variables tested, positive staining for c-erbB-2, c-erbB-3, ERα, PgR, p53, cathepsin D, and pS2 showed no significant association with positive staining for CK5/6 or for CK14 in this group of patients (Tables 1 and 3). The highly significant association of staining for CK14 and MIPs/FANCD2 was maintained for staining cutoffs set at 5% as well as for 1% (corrected P ≤ 0.016). There was also a strong association of staining for CK5/6 or CK14 with that for the four MIPs and inversely for FANCD2 in the ERα-negative (corrected P ≤ 0.005, except S100P for CK5/6, P = 0.22), the ERα-positive (corrected P ≤ 0.005, except FANCD2 for CK14, P = 0.06) and the ERα, PgR, c-erbB-2 negative (triple negative30) (corrected P < 0.05 for CK5/6 or ≤ 0.005 for CK14) staining carcinomas (see Supplemental Table S3 at http://ajp.amjpathol.org). There was no significant association of triple-negative carcinomas and staining for the four MIPs or FANCD2 (corrected P ≥ 0.38), excepting an inverse association with staining for AGR2 (corrected P = 0.010). The overall association of staining for CK5/6, the four MIPs, and no staining for FANCD2 in 223 complete cases was highly significant in Kendall's concordance test (W = 0.147, χ2 = 196.4, 6 df, P < 0.001).
To determine whether there was coexpression of the basal cytokeratins and the MIPs, two breast carcinomas were chosen that showed either borderline staining or positive staining for CK5/6 and these were immunohistochemically restained for the basal cytokeratins and for FANCD2 and the four MIPs. Exactly the same areas were examined for each antigen (see Supplemental Figure S2, C and D, at http://ajp.amjpathol.org). The percentage of stained cells in the focally stained area for CK5/6 was significantly different for all of the MIPs (Student's t-test, P ≤ 0.0063), with two showing significantly higher percentages (OPN, S100P) and two showing significantly lower percentages (S100A4, AGR2), and even that for CK14 was just significantly different (Table 4). Although the percentage of stained cells was often significantly lower for the MIPs in the same near-adjacent area (P ≤ 0.019, except AGR2 P = 0.3), the percentage of stained cells for CK5/6 and for the MIPs (except S100A4 P = 0.27) were significantly different (P < 0.027). Similar significant differences for staining for CK5/6 and for the MIPs were observed in an enhanced staining area of a positively staining tumor for CK5/6 (P ≤ 0.0055) and to a lesser extent in the same near-adjacent area (P ≤ 0.0008 for S100A4, S100P; but OPN, AGR2 P ≥ 0.67). There was also much less difference between the enhanced and adjacent staining groups for CK5/6 (P = 0.014) and the MIPs (P ≥ 0.041) in this CK5/6 positively staining carcinoma (Table 4). The percentage of carcinoma cells staining for FANCD2 was extremely low: ≤1% in the borderline and nonexistent in the positively staining carcinomas (Table 4). Coimmunostaining for CK5/6 and S100A4 did occur in some cells (see Supplemental Figure S2E at http://ajp.amjpathol.org), but these were usually in a minority (see Supplemental Figure S2F at http://ajp.amjpathol.org).
Table 4.
IHC Staining for Basal Cytokeratins and Metastasis-Inducing Proteins of the Same Area of Tumor for Carcinomas Classified either as Borderline or Positive Staining for CK5/6
| Tumor variable⁎ | Carcinoma cells stained (%)† |
|||||
|---|---|---|---|---|---|---|
| Borderline staining carcinoma for CK5/6 |
Positive staining carcinoma for CK5/6 |
|||||
| Focal‡ | Adjacent‡ | P value§ | Enhanced‡ | Adjacent‡ | P value§ | |
| CK5/6 | 12.3 ± 1.0 | 2.6 ± 0.1 | 0.0033 | 55.4 ± 5.7 | 28.7 ± 0.5 | 0.014 |
| P value¶ | NA | NA | NA | NA | ||
| CK14 | 9.4 ± 1.0 | 1.7 ± 0.2 | 0.0002 | 58.6 ± 1.5 | 43.6 ± 3.2 | 0.008 |
| P value¶ | 0.024 | 0.0022 | 0.40 | 0.013 | ||
| FANCD2 | 1.1 ± 0.2 | 0.82 ± 0.4 | 0.36 | 0.12 ± 0.11 | 0.12 ± 0.11 | 1.0 |
| P value¶ | <0.0001 | 0.0022 | 0.0035 | <0.0001 | ||
| S100A4 | 8.6 ± 0.7 | 3.3 ± 0.8 | 0.001 | 15.6 ± 1.5 | 12.8 ± 1.9 | 0.12 |
| P value¶ | 0.0063 | 0.27 | 0.0003 | 0.0002 | ||
| OPN | 20.9 ± 2.3 | 30.6 ± 3.8 | 0.019 | 34.8 ± 3.2 | 27.7 ± 3.5 | 0.061 |
| P value¶ | 0.004 | 0.0061 | 0.0055 | 0.67 | ||
| AGR2 | 3.2 ± 0.3 | 3.6 ± 0.5 | 0.30 | 26.2 ± 3.7 | 35.8 ± 4.2 | 0.041 |
| P value¶ | 0.0001 | 0.027 | 0.0017 | 0.097 | ||
| S100P | 29.7 ± 3.6 | 9.1 ± 0.6 | 0.006 | 9.5 ± 0.3 | 9.5 ± 1.5 | 1.0 |
| P value¶ | 0.0013 | <0.0001 | 0.005 | 0.0008 | ||
NA, not applicable.
IHC staining for cytokeratins 5/6 or 14 (CK5/6 or CK14), FANCD2, S100A4, osteopontin (OPN), anterior gradient 2 protein (AGR2), and S100P.
Mean percentage ± SD of stained carcinoma cells from five counts of two serial adjacent sections immunohistochemically stained for each tumor variable.
The same focal positive/enhanced staining area or the same near-adjacent area.
Significance of the difference between CK5/6 focal/enhanced and adjacent staining areas for IHC staining for each tumor variable (Student's t-test, two sided).
Significance of the difference between staining for each tumor variable and that for CK5/6 in the same area (Student's t-test, two sided).
Staining for Other Tumor Variables and Patient Survival
In addition to staining for CK5/6 and CK14, the other primary tumor variables that showed a significant association with duration of survival for this group of patients at the same census date were nodal status, histological grade, tumor size, and immunocytochemical staining for OPN, c-erbB-2, S100A4, S100P, PgR, p53, ERα, AGR2, and FANCD2. The association of staining of the primary tumor for c-erbB-3, cathepsin D, and pS2 with duration of survival failed to reach statistical significance in this group of patients (see Supplemental Table S1 at http://ajp.amjpathol.org). Most of the primary tumor variables were associated in a negative manner with duration of survival; however, staining of the primary tumors for ERα, FANCD2, and PgR all showed a positive association (see Supplemental Table S1 at http://ajp.amjpathol.org). Staining of the primary tumor for either cytokeratin showed a similar significant association (P < 0.0001) and RR (5.6 to 5.7) to that for S100A4, S100P, OPN, AGR2, and loss of FANCD2 (see Supplemental Table S1 at http://ajp.amjpathol.org). The highly significant association of staining for either CK5/6 or CK14 with time to patient death was also maintained in lymph node-negative (χ2 = 28.1 or 25.4, 1 df, P < 0.001) and lymph node-positive patients (χ2 = 21.8 or 19.2, 1 df, P < 0.001), in ERα-negative (χ2 = 28.2 or 42.2, 1 df, P < 0.001) and ERα-positive patients (χ2 = 43.4 or 29.6, 1 df, P < 0.001), and in triple-negative patients (χ2 = 69.1 or 19.3, 1 df, P < 0.001).
To determine whether the 14 tumor variables that were significant in the univariate analyses were independent of one another, they were all included in Cox's multivariate regression analysis for the 137 patients with full data sets available (as described under Materials and Methods). The first variable to emerge was staining for FANCD2, followed by staining for S100P, OPN, c-erbB-2, AGR2, CK5/6, nodal status, and ERα (Cox's statistics, P < 0.001). In the multivariate analysis, the individual contributions that staining for CK5/6 made to the RR for duration of survival of the patients was significant (P = 0.033) with RR = 1.8, but that for CK14 was lost (Table 5A). The pathological variables histological grade and tumor size were eliminated from the final equation in the stepwise analysis. If staining for CK5/6 and CK14 and only the pathological variables were entered into the multivariate analysis, staining for both CK5/6 and CK14, together with nodal status and tumor size, were independently significantly associated with time to patient death, but histological grade was not (Table 5B). If either cytokeratin was omitted, the other assumed an increased significant association with time to patient death (CK5/6 χ2 = 54.24, 1 df, RR = 5.1 or CK14 χ2 = 45.59, 1 df, RR = 4.3), but histological grade was still eliminated (CK5/6 χ2 = 0.62, 1 df, P = 0.43 or CK14 χ2 = 2.14, 1 df, P = 0.14), suggesting that high grade was confounded by staining for either cytokeratin.
Table 5.
Summary of Results for Cox's Proportional Hazards Model for Cancer-Related Deaths
| Tumor variable⁎ | Coeff β† | SE of β | χ2‡ | P§ | RR¶ | 95% CI¶ |
|---|---|---|---|---|---|---|
| Set A | ||||||
| Lymph nodes | 0.708 | 0.272 | 6.76 | 0.009 | 2.03 | 1.19–3.46 |
| FANCD2 | −0.965 | 0.288 | 11.20 | 0.001 | 0.381 | 0.216–0.670 |
| AGR2 | 2.412 | 0.639 | 14.24 | <0.001 | 11.15 | 3.19–39.0 |
| S100P | 0.920 | 0.331 | 7.72 | 0.005 | 2.51 | 1.31–4.80 |
| OPN | 2.54 | 1.051 | 5.85 | 0.016 | 12.69 | 1.62–99.5 |
| ERα | −0.622 | 0.274 | 5.17 | 0.023 | 0.537 | 0.314–0.918 |
| c-erbB-2 | 1.324 | 0.315 | 17.67 | <0.001 | 3.76 | 2.03–6.96 |
| CK5/6 | 0.612 | 0.287 | 4.54 | 0.033 | 1.84 | 1.05–3.24 |
| Set B | ||||||
| Tumor size | 0.472 | 0.238 | 3.92 | 0.048 | 1.60 | 1.00–2.56 |
| Lymph nodes | 0.571 | 0.211 | 7.29 | 0.007 | 1.77 | 1.17–2.68 |
| CK5/6 | 1.210 | 0.245 | 24.39 | <0.001 | 3.35 | 2.07–5.42 |
| CK14 | 0.912 | 0.238 | 14.63 | <0.001 | 2.49 | 1.56–3.97 |
For all variables in set A, overall χ2 = 127.711, 8 df, P < 0.001; residual χ2 = 12.316, 6 df, P = 0.055. For pathological variables, CK5/6 and CK14 in set B, overall χ2 = 99.639, 4 df, P < 0.001, residual χ2 = 1.369, 1 df, P = 0.24 for histological grade.
In set A, all tumor variables that showed a statistically significant association with duration of patient survival times in the univariate analysis for 137 patient cases available with full data sets were included. Thus comparisons between patients with involved lymph nodes, all tumor sizes (T1 to T4), all histological grades (I to III), staining for OPN, c-erbB-2, S100A4, S100P, p53, PgR, ERα, AGR2, FANCD2, CK5/6, and CK14 were made. In set B, data for pathological tumor variables, involved lymph nodes, all tumor sizes, all histological grades and only staining for CK5/6 and CK14 were included for 199 patients with full data sets.
Value of β parameter (= loge RR) in Cox's multiple regression analysis (see further under Materials and Methods).
Cox's statistic χ2.
Probability P from Cox's statistic χ2, 1 df in each case.
RR for survival and 95% CI from multivariate analysis.
Discussion
The purpose of the present study was to identify a high-risk subgroup of basal-like breast carcinomas using IHC staining for the basal cell keratins CK5/6 and CK144,5,8,11,30–34 and then to relate them to the high-risk subgroup of metastasis-inducing proteins in the same cohort of breast cancer patients.17–20 IHC staining of this cohort of 297 breast carcinomas for CK5/6 and separately for CK14 stained 31% and 34%, respectively, of the primary tumors, with a 1% cutoff of stained carcinoma cells to separate the two categorical groups. These percentages agree well with the 38% reported for CK5, CK14, and/or CK1731 and 28% for CK5/6 and/or CK148 in studies using similar IHC techniques. The lower value of 14% to 19% for breast carcinomas stained for CK5/6, CK17, or CK147,9,11 has been obtained with higher cutoff thresholds of at least 5% stained carcinoma cells, which translates into 17.5% of tumors stained for CK14 in the present group of breast carcinomas (see Supplemental Table S1 at http://ajp.amjpathol.org). The basal-like tumors defined by gene expression signatures3 may not equate completely to those basal-like tumors defined by IHC-detectable levels of basal cell keratins alone.
Here, we show that the overall duration of survival of patients with positively stained carcinomas was highly significantly worse than for those patients classified as not staining for either CK5/6 or CK14 (Figure 2, A and B), in agreement with results of van de Rijn et al11 and Abd El-Rehim et al.8 This highly significant association of staining for CK5/6 or CK14 with time to patient death is independent of lymph node or ERα status and also occurs in triple-negative patients.30,35 If the definition of IHC-detectable basal-like tumors is refined still further by excluding tumors staining for ERα and/or c-erbB-2 from the CK5/6 staining series,9 then the fraction of IHC-detectable basal-like tumors falls to 15%, but it still shows a difference in duration of survival times compared with the remainder (Wilcoxon χ2 = 23.9, 1 df, P < 0.001; RR = 3.0, 95% CI = 1.9 to 4.8) and with the luminal ERα-positive, c-erbB-2-negative subtype (χ2 = 21.92, 1 df, P = < 0.001; RR = 3.6, 95% CI = 2.2 to 5.9), in agreement with previous reports by others.9,33–38
Our series of breast cancer patients is not entirely typical of more recent consecutive series of invasive breast cancers,8 because our series was collected 25 to 30 years ago in symptomatic clinics, before breast screening programs and when the average tumor size was >3.5 cm in diameter at presentation, suggesting that disease in our patients may, on average, be more advanced in time than that of more recent studies (such as those of Rakha et al,39 with an average tumor diameter of 1.8 cm). This more advanced nature may be reflected in the higher percentage of cases with involved lymph nodes and lower ERα positivity. Moreover, we have excluded cases with distant metastases, which may have reduced the proportion of grade III tumors in our particular series and thereby also reduced the significance of the correlation between basal IHC/cytokeratin positivity and histological grade, compared with that of others.8 Our proportions of 26% grade III and 48% with involved lymph nodes agree reasonably well with similar stage I and stage II operable breast cancers collected at comparable dates, with 30% grade III and 45% tumors with involved lymph nodes40 versus 48% with grade III and 36% tumors with involved lymph nodes collected 10 to 15 years later.8 Moreover, although our proportion of 53% ERα-positive tumors is lower than that of later patient groups (eg, 69% was reported by Abd El-Rehim et al8) using similar IHC methods, it is consistent with 57% positive tumors being found by competitive inhibition of ligand binding for nearly the same group of patients41 and is validated by the same IHC assay finding a higher proportion (70% positive tumors) in our own later group of patients.42
When those tumor variables that show a significant correlation with duration of patient survival times in this group of breast cancer patients (see Supplemental Table S1 at http://ajp.amjpathol.org) were tested for association with IHC staining for CK5/6 or CK14 in the primary carcinomas, positive staining for the four MIPs OPN, S100A4, S100P, and AGR2 and no staining for FANCD2 were most significantly associated with positive staining for CK5/6 or for CK14 (corrected P ≤ 0.0007); the other tumor variables tested, including c-erbB-2 and ERα, failed to show any significant association with either cytokeratin (Tables 1 and 3). These results are independent of basal cell keratin or cutoff used, and when these variables are ranked together, they are found to be highly significantly concordant (P < 0.001). This association holds largely in patients with ERα-negative, ERα-positive, and triple-negative tumors (see Supplemental Table S3 at http://ajp.amjpathol.org). These results demonstrate that positive MIPs and negative FANCD2 are most closely associated with the IHC-detectable basal-like and not the subgroups containing IHC-detectable ERα or c-erbB-2.30,35–38,43 However, in two carcinomas in which positive staining for the cytokeratins and MIPs occurred, there was no significant spatial relationship between a staining focus for CK5/6 (or CK14) and the occurrence of a staining focus for any of the MIPs (Table 4), nor was costaining of the same carcinoma cell common in the tumors (see Supplemental Figure S2F at http://ajp.amjpathol.org). Similar results were obtained with five other carcinomas examined (data not shown). These results suggest that there is no simple mechanistic link between expression of basal cytokeratins and the MIPs, such as common regulatory molecules which promote expression of all these genes. Other explanations need to be considered.
The reduction of FANCD2 in the subgroup of IHC-detectable basal-like breast carcinomas is consistent with the finding that the gene expression signature of the basal-like subgroup and that of BRCA1-related breast cancers are strongly correlated at the level of the tumor,38 because BRCA1 and FANCD2 interact functionally, and an impediment of either molecule will lead to a failure in the same process of DNA damage repair.44 Moreover, both cytogenetic and comparative genomic hybridization analyses suggest that breast carcinomas that express stratified epithelial cytokeratins also possess increased genomic abnormalities,45,46 a fact consistent with our findings and likewise pointing to a common defective DNA repair process. Our results therefore raise the possibility that the underlying mechanism responsible for the enhanced expression of the basal cytokeratins here and of the four MIPs in a previous publication22 is related to a decrease in overall FANCD2. Although strong clustering of staining for CK5/6, CK14, and the four MIPs and lack of staining for FANCD2 has been identified in this group of breast carcinomas, this would appear not to reflect coexpression (or lack of coexpression for FANCD2) of these molecules within the same carcinoma cells (Table 4). Thus, the changed expression of these molecules is unlikely to be related to simple biochemical pathways or transcriptional events, but rather to a changed probability of expression in particular tumors, perhaps related to a subgroup of breast cancers with an underlying genetic flexibility/instability. Direct interrogation of published data sets of mRNA profiles from large studies using expression microarrays does not sort MIP/FANCD2 expression into the GE basal or other GE classifications of breast cancer.47–49 This result may be due to incomplete data on expression of the MIPs/FANCD247,48 and/or the lack of correlation between levels of mRNA and its cognate protein in human breast cancer, as discussed previously.50
In addition to the complex of cytokeratins that include CK5/6 and CK14 being found in basally situated smooth muscle actin/myosin-containing myoepithelial cells,6 they are also detected in occasional suprabasal epithelial cells, particularly in growing terminal ductal structures.31,51–53 The observations of intermediate cell forms between the more peripheral cells in these structures and the subtending epithelial and myoepithelial cells52,54,55 are in line with findings in cultured human breast epithelial cells56,57 that a subclass of epithelial-like cells containing basal cell cytokeratins54,55,58 progressively differentiates into myoepithelial or into luminal epithelial cells, as reported originally in rodent systems.59–61 Thus, the basal-like breast carcinomas may contain the vestiges of a normal breast stem cell that has lost its capability to differentiate completely into end-stage myoepithelial cells,58,62,63 but still expresses basal cell cytokeratins,64 as well as CK19,65,66 vimentin,67 CD44,68 ALDH1,69 and/or CD133.70 In support of this hypothesis, the mutant BRCA1 hereditary breast tumors that show a potentially true basal-like GE phenotype38 also contain basal cell cytokeratins33 and CD44/CD133-overexpressing cells with cancer stem cell characteristics.70 Alternatively, a failure in the FA/BRCA tumor suppressor pathway of DNA repair21 in a luminal epithelial progenitor58,71 may reflect selection for expression of the same or similar genes in BRCA1 hereditary and somatic basal-like GE breast carcinomas. Both models are consistent with wild-type BRCA1 stimulating expression of ERα and repressing basal cell cytokeratin markers and with reduction or mutation in BRCA1 reversing these events,72–74 similar to their reciprocal effect on the OPN promoter.75
The above two models may not be mutually exclusive. Although vimentin and CK14 are expressed mainly in the mammary stem cell enriched population58 and in basal-like GE and mutant BRCA1 inherited breast cancers,30,33 signature genes of the luminal epithelial progenitors are reported to be more associated with basal-like GE and mutant BRCA1 carcinomas.58,71 Thus, there may be a degree of flexibility in expression of the carcinoma cells in the basal-like GE tumors that allows expression of genes related to both mammary stem and luminal epithelial progenitor cells.71 This flexibility in expression may arise either by reversible cellular interconversions between mammary stem cells and epithelial progenitor cells76 or by genome destabilization caused by a deficiency in the FA/BRCA pathway.21,22,74 Whatever the model, we have shown that proteins that can induce metastasis14–17 in rat breast cells13,59 are also highly significantly associated with this prognostically unfavorable subgroup of basal cell CK-containing breast carcinomas and therefore may be the cause of their metastatic spread and consequent death in humans.
Acknowledgments
We thank Christopher Holcombe and the staff of the Breast Unit, Royal Liverpool University Hospital, for clinical assistance; Dr. Evelyn Williams and the staff of the North West Intelligence Service (Liverpool Office) for providing patient outcome data; and Anne Salisbury, Natalie Stephenson, Rachel Thomas, Donna Topping, and Matthew Cullen for help in data collection.
Footnotes
Supported by the Cancer and Polio Research Fund, Wirral, Cheshire, United Kingdom.
Supplemental material for this article can be found at http://ajp.amjpathol.org or at doi: doi: 10.1016/j.ajpath.2011.04.022.
Contributor Information
Suzete de Silva Rudland, Email: sdesilva@liv.ac.uk.
Philip S. Rudland, Email: sdsrudland@yahoo.com.
Supplementary data
IHC staining in color of human breast tissues for cytokeratins. A: Incubation of normal breast duct tissue with antibody to CK14 shows brown staining of myoepithelial/basal cells (arrowheads) and of occasional suprabasal epithelial-like cells (arrows); most epithelial cells (e) and the adjacent stromal cells (s) were unstained. B: Invasive carcinoma stained for CK5/6 shows no IHC staining. C: Invasive carcinoma stained for CK5/6 shows borderline staining of the occasional brown malignant cell (arrow). D: Invasive carcinoma stained for CK5/6 shows positive brown staining for malignant cells. E: Invasive carcinoma stained for CK14 shows positive brown staining for malignant epithelial cells (e); stromal cells (s) were unstained. F: A different section of the invasive carcinoma shown in E, at a higher magnification, illustrates cytoplasmic staining in malignant epithelial cells (e) stained for CK14; stromal cells (s) were unstained. Nuclei were stained blue with Mayer's hemalum throughout. Original magnification: ×385 (B–E); ×770 (A and F). Scale bars = 20 μm.
IHC staining in color of invasive breast carcinoma classified as positively stained for cytokeratins CK14 and CK5/6. A and B: Near-adjacent sections of the same invasive carcinoma. Tissue incubated with mAb to CK14 shows strongly stained brown carcinoma cells (A); there is no staining with the same mAb preincubated with our synthetic peptide (B); stromal cells (s) were unstained under both conditions. C and D: Near-adjacent sections of the same invasive carcinoma. Tissue incubated with mAb to CK5/6 (C) shows strongly stained brown carcinoma cells; tissue incubated with mAb to osteopontin (D) shows the brown beaded cytoplasmic staining characteristic of osteopontin (see Ref. 19). E and F: Sections of the same invasive carcinoma incubated with mAb to CK5/6 (brown stain) and to S100A4 (pink/red stain); the primary antibodies were detected by horseradish peroxidase oxidation of diaminobenzidine (DAB) or alkaline phosphatase hydrolysis of naphthol dyes, respectively (as described under Materials and Methods). Some cells were stained both brown and red/pink in the cytoplasm, for both CK5/6 and S100A4 (E, arrows), whereas the majority of the cells stained separately either brown for CK5/6 or red/pink for S100A4 (F). Nuclei were stained blue with Mayer's hemalum throughout. Original magnification: ×310 (F); ×385 (A-D); ×480 (E). Scale bars = 20 μm.
Association of IHC staining for CK5/6 and CK14 with overall duration of patient survival. The cumulative proportion of surviving patients as a percentage of the total for each year after presentation for patients with carcinomas classified as unstained for either CK14 or CK5/6 (set a, solid line), positively stained for CK14 and unstained for CK5/6 (set b, dotted line), unstained for CK14 and positively stained for CK5/6 (set c, dashed line), or positively stained for both CK14 and CK5/6 (set d, dot-and-dash line). There were 142 censored observations in set a (47 dead of other causes), 12 in set b (six dead of other causes), seven in set c (one dead of other causes), and five in set d (two dead of other causes). The curves were highly significantly different overall (Wilcoxon statistic χ2 = 121.02, 3 df, P < 0.0001) and in pairwise combinations for sets a and b (χ2 = 64.48, 1 df, P < 0.0001; Cox's univariate analysis RR = 10.45, 95% CI = 5.88 to 18.5), sets a and c (χ2 = 64.37, 1 df, P < 0.0001; RR = 11.52, 95% CI = 6.37 to 20.8), and sets a and d (χ2 = 102.92, 1 df, P < 0.0001; RR = 14.15, 95% CI = 8.34 to 24.0). There was no significant difference in pairwise combinations for sets b and c (χ2 = 0.03, 1 df, P = 0.855), sets b and d (χ2 = 0.28, 1 df, P= 0.594), and sets c and d (χ2 = 0.34, 1 df, P= 0.558).
References
- 1.Wellings S.R., Jensen H.M., Marcum R.G. An atlas of subgross pathology of the human breast with special reference to possible precancerous lesions. J Natl Cancer Inst. 1975;55:231–273. [PubMed] [Google Scholar]
- 2.Page D.L., Anderson T.J. Churchill Livingstone; Edinburgh: 1988. Diagnostic Histopathology of the Breast. [Google Scholar]
- 3.Sorlie T., Tibshirani R., Parker J., Hastie T., Marron J.S., Nobel A., Deng S., Johnsen H., Pesich R., Geisler S., Demeter J., Perou C.M., Lønning P.E., Brown P.O., Børresen-Dale A.L., Botstein D. Repeated observation of breast tumor subtypes in independent gene expression data sets. Proc Natl Acad Sci USA. 2003;100:8418–8423. doi: 10.1073/pnas.0932692100. [DOI] [PMC free article] [PubMed] [Google Scholar]
- 4.Moll R., Franke W.W., Schiller D.L., Geiger B., Krepler R. The catalog of human cytokeratins: patterns of expression in normal epithelia, tumors and cultured cells. Cell. 1982;31:11–24. doi: 10.1016/0092-8674(82)90400-7. [DOI] [PubMed] [Google Scholar]
- 5.Dairkee S.H., Mayall B.H., Smith H.S., Hackett A.J. Monoclonal marker that predicts early recurrence of breast cancer. Lancet. 1987;1(8531):514. doi: 10.1016/s0140-6736(87)92129-5. [DOI] [PubMed] [Google Scholar]
- 6.Gusterson B.A., Warburton M.J., Mitchell D., Ellison M., Neville A.M., Rudland P.S. Distribution of myoepithelial cells and basement membrane proteins in the normal breast and in benign and malignant breast disease. Cancer Res. 1982;42:4763–4770. [PubMed] [Google Scholar]
- 7.Rudland P.S., Leinster S.J., Winstanley J., Green B., Atkinson A., Zakhour H. Immunocytochemical identification of cell types in benign and malignant breast diseases: variations in cell markers accompany the malignant state. J Histochem Cytochem. 1993;41:543–553. doi: 10.1177/41.4.8450194. [DOI] [PubMed] [Google Scholar]
- 8.Abd El-Rehim D.M., Pinder S.E., Parish C.E., Bell J., Blamey R.W., Robertson J.F.R., Nicholson R.I., Ellis I.O. Expression of luminal and basal cytokeratins in human breast carcinoma. J Pathol. 2004;203:661–671. doi: 10.1002/path.1559. [DOI] [PubMed] [Google Scholar]
- 9.Nielsen T.O., Hsu F.D., Jensen K., Cheong M., Karaca G., Hu Z., Hernandez-Boussard T., Livsey C., Cowan D., Dressler L., Akslen L.A., Ragaz J., Gown A.M., Gilks C.B., van de Rijn M., Perou C.M. Immunohistochemical and clinical characterisation of the basal-like subtype of invasive breast carcinoma. Clin Cancer Res. 2004;10:5367–5374. doi: 10.1158/1078-0432.CCR-04-0220. [DOI] [PubMed] [Google Scholar]
- 10.Malzahn K., Mitze M., Thoenes M., Moll R. Biological and prognostic significance of stratified epithelial cytokeratins in infiltrating breast carcinomas. Virchows Arch. 1998;433:119–129. doi: 10.1007/s004280050226. [DOI] [PubMed] [Google Scholar]
- 11.van de Rijn M., Perou C.M., Tibshirani R., Haas P., Kallioniemi O., Kononen J., Torhorst J., Sauter G., Zuber M., Köchli O.R., Mross F., Dieterich H., Seitz R., Ross D., Botstein D., Brown P. Expression of cytokeratins 17 and 5 identifies a group of breast carcinomas with poor clinical outcome. Am J Pathol. 2002;161:1991–1996. doi: 10.1016/S0002-9440(10)64476-8. [Erratum appeared in Am J Pathol 2003, 163:377] [DOI] [PMC free article] [PubMed] [Google Scholar]
- 12.Fan C., Oh D.S., Wessels L., Weigelt B., Nuyten D.S.A., Nobel A.B., van't Veer L.J., Perou C.M. Concordance among gene-expression-based predictors for breast cancer. N Engl J Med. 2006;355:560–569. doi: 10.1056/NEJMoa052933. [DOI] [PubMed] [Google Scholar]
- 13.Dunnington D.J., Monaghan P., Hughes C.M., Rudland P.S. Phenotypic instability of rat mammary tumor epithelial cells. J Natl Cancer Inst. 1983;71:1227–1240. [PubMed] [Google Scholar]
- 14.Davies B.R., Davies M.P.A., Gibbs F.M., Barraclough R., Rudland P.S. Induction of the metastatic phenotype by transfection of a benign rat mammary epithelial cell line with the gene for p9Ka, a rat calcium-binding protein, but not with the oncogene EJ-ras-1. Oncogene. 1993;8:999–1008. [PubMed] [Google Scholar]
- 15.Oates A.J., Barraclough R., Rudland P.S. The identification of osteopontin as a metastasis-related gene product in a rodent mammary tumour model. Oncogene. 1996;13:97–104. [PubMed] [Google Scholar]
- 16.Liu D., Rudland P.S., Sibson D.R., Platt-Higgins A., Barraclough R. Human homologue of cement gland protein, a novel metastasis inducer associated with breast carcinomas. Cancer Res. 2005;65:3796–3805. doi: 10.1158/0008-5472.CAN-04-3823. [DOI] [PubMed] [Google Scholar]
- 17.Wang G., Platt-Higgins A., Carroll J., de Silva Rudland S., Winstanley J., Barraclough R., Rudland P.S. Induction of metastasis by S100P in a rat mammary model and its association with poor survival of breast cancer patients. Cancer Res. 2006;66:1199–1207. doi: 10.1158/0008-5472.CAN-05-2605. [DOI] [PubMed] [Google Scholar]
- 18.Rudland P.S., Platt-Higgins A., Renshaw C., West C.R., Winstanley J.H.R., Robertson L., Barraclough R. Prognostic significance of the metastasis-inducing protein S100A4 (p9Ka) in human breast cancer. Cancer Res. 2000;60:1595–1603. [PubMed] [Google Scholar]
- 19.Rudland P.S., Platt-Higgins A., El-Tanani M., de Silva Rudland S., Barraclough R., Winstanley J.H.R., Howitt R., West C.R. Prognostic significance of the metastasis-associated protein osteopontin in human breast cancer. Cancer Res. 2002;62:3417–3427. [PubMed] [Google Scholar]
- 20.Barraclough D.L., Platt-Higgins A., de Silva Rudland S., Barraclough R., Winstanley J., West C.R., Rudland P.S. The metastasis-associated anterior gradient 2 protein is correlated with poor survival of breast cancer patients. Am J Pathol. 2009;175:1848–1857. doi: 10.2353/ajpath.2009.090246. [DOI] [PMC free article] [PubMed] [Google Scholar]
- 21.Wang W. Emergence of DNA-damage response network consisting of Fanconi anemia and BRCA proteins. Nat Rev Genet. 2007;8:735–748. doi: 10.1038/nrg2159. [DOI] [PubMed] [Google Scholar]
- 22.Rudland P.S., Platt-Higgins A.M., Davies L.M., de Silva Rudland S., Wilson J.B., Aladwani A., Winstanley J., Barraclough D.L., Barraclough R., West C.R., Jones N.J. Significance of the Fanconi anemia FANCD2 protein in sporadic and metastatic human breast cancer. Am J Pathol. 2010;176:2935–2947. doi: 10.2353/ajpath.2010.090779. [DOI] [PMC free article] [PubMed] [Google Scholar]
- 23.Purkis P.E., Steele J.B., Mackenzie I.C., Nathrath W.B., Leigh I.M., Lane E.B. Antibody markers of basal cells in complex epithelia. J Cell Sci. 1990;97:39–50. doi: 10.1242/jcs.97.1.39. [DOI] [PubMed] [Google Scholar]
- 24.de Silva Rudland S., Martin L., Roshanlall C., Winstanley J., Leinster S., Platt-Higgins A., Carroll J., West C., Barraclough R., Rudland P. Association of S100A4 and osteopontin with specific prognostic factors and survival of patients with minimally invasive breast cancer. Clin Cancer Res. 2006;12:1192–1200. doi: 10.1158/1078-0432.CCR-05-1580. [DOI] [PubMed] [Google Scholar]
- 25.Platt-Higgins A.M., Renshaw C.A., West C.R., Winstanley J.H., De Silva Rudland S., Barraclough R., Rudland P.S. Comparison of the metastasis-inducing protein S100A4 (p9Ka) with other prognostic markers in human breast cancer. Int J Cancer. 2000;89:198–208. [PubMed] [Google Scholar]
- 26.Leake R., Barnes D., Pinder S., Ellis I., Anderson E., Anderson T., Adamson R., Rhodes A., Miller K., Walker R. Immunohistochemical detection of steroid receptors in breast cancer: a working protocol: UK Receptor Group, UK NEQAS, The Scottish Breast Cancer Pathology Group, and The Receptor and Biomarker Study Group of the EORTC. J Clin Pathol. 2000;53:634–635. doi: 10.1136/jcp.53.8.634. [DOI] [PMC free article] [PubMed] [Google Scholar]
- 27.Walker R.A., Bartlett J.M., Dowsett M., Ellis I.O., Hanby A.M., Jasani B., Miller K., Pinder S.E. HER2 testing in the UK: further update to recommendations. J Clin Pathol. 2008;61:818–824. doi: 10.1136/jcp.2007.054866. [DOI] [PubMed] [Google Scholar]
- 28.McShane L.M., Altman D.G., Sauerbrei W., Taube S.E., Gion M., Clark G.M., Statistics Subcommittee of the NCI-EORTC Working Group on Cancer Diagnostics REporting recommendations for tumour MARKer prognostic studies (REMARK) Eur J Cancer. 2005;41:1690–1696. doi: 10.1016/j.ejca.2005.03.032. [DOI] [PubMed] [Google Scholar]
- 29.Conover W.J. ed 3. Wiley; London: 1999. Practical Nonparametric Statistics. [Google Scholar]
- 30.Rakha E.A., Elsheikh S.E., Aleskandarany M.A., Habashi H.O., Green A.R., Powe D.G., El-Sayed M.E., Benhasouna A., Brunet J.S., Akslen L.A., Evans A.J., Blamey R., Reis-Filho J.S., Foulkes W.D., Ellis I.O. Triple negative breast cancer: distinguishing between basal and nonbasal subtypes. Clin Cancer Res. 2009;15:2302–2310. doi: 10.1158/1078-0432.CCR-08-2132. [DOI] [PubMed] [Google Scholar]
- 31.Nagle R.B., Böcker W., Davis J.R. Characterization of breast carcinomas by two monoclonal antibodies distinguishing myoepithelial from luminal epithelial cells. J Histochem Cytochem. 1986;34:869–881. doi: 10.1177/34.7.2423579. [DOI] [PubMed] [Google Scholar]
- 32.Wetzels R.H., Kuijpers H.J., Lane E.B., Leigh I.M., Troyanovsky S.M., Holland R., van Haelst U.J., Ramaekers F.C. Basal cell-specific and hyperproliferation-related keratins in human cancer. Am J Pathol. 1991;138:751–763. [PMC free article] [PubMed] [Google Scholar]
- 33.Lakhani S.R., Reis-Filho J.S., Fulford L., Penault-Llorca F., van der Vijver M., Parry S. Breast Cancer Linkage Consortium: Prediction of BRCA1 status in patients with breast cancer using estrogen receptor and basal phenotype. Clin Cancer Res. 2005;11:5175–5180. doi: 10.1158/1078-0432.CCR-04-2424. [DOI] [PubMed] [Google Scholar]
- 34.Fulford L.G., Easton D.F., Reis-Filho J.S., Sofronis A., Gillett C.E., Lakhani S.R., Hanby A. Specific morphological features predictive for the basal phenotype in grade 3 invasive ductal carcinoma of breast. Histopathology. 2006;49:22–34. doi: 10.1111/j.1365-2559.2006.02453.x. [DOI] [PubMed] [Google Scholar]
- 35.Cheang M.C., Voduc D., Bajdik C., Leung S., McKinney S., Chia S.K., Perou C.M., Nielsen T.O. Basal-like breast cancer defined by five biomarkers has superior prognostic value than triple-negative phenotype. Clin Cancer Res. 2008;14:1368–1376. doi: 10.1158/1078-0432.CCR-07-1658. [DOI] [PubMed] [Google Scholar]
- 36.Rakha E.A., Reis-Filho J.S., Ellis I.O. Basal-like breast cancer: a critical review. J Clin Oncol. 2008;26:2568–2581. doi: 10.1200/JCO.2007.13.1748. [DOI] [PubMed] [Google Scholar]
- 37.Dawson S.J., Provenzano E., Caldas C. Triple negative breast cancers: clinical and prognostic implications. Eur J Cancer. 2009;45(Suppl 1):27–40. doi: 10.1016/S0959-8049(09)70013-9. [DOI] [PubMed] [Google Scholar]
- 38.Foulkes W.D., Stefansson I.M., Chappuis P.O., Bégin L.R., Goffin J.R., Wong N., Trudel M., Akslen L.A. Germline BRCA1 mutations and a basal epithelial phenotype in breast cancer. J Natl Cancer Inst. 2003;95:1482–1485. doi: 10.1093/jnci/djg050. [DOI] [PubMed] [Google Scholar]
- 39.Rakha E.A., El-Sayed M.E., Lee A.H.S., Elston C.W., Grainge M.J., Hodi Z., Blamey R.W., Ellis I.O. Prognostic significance of the Nottingham histologic grade in invasive breast carcinoma. J Clin Oncol. 2008;26:3153–3158. doi: 10.1200/JCO.2007.15.5986. [DOI] [PubMed] [Google Scholar]
- 40.Elston C.W., Gresham G.A., Rao G.S., Zebro T., Haybittle J.L., Houghton J., Kearney G. The Cancer Research Campaign (King's/Cambridge) Trial for early breast cancer: clinico-pathological aspects. Br J Cancer. 1982;45:655–669. doi: 10.1038/bjc.1982.106. [DOI] [PMC free article] [PubMed] [Google Scholar]
- 41.Winstanley J., Cooke T., Murray G.D., Platt-Higgins A., George W.D., Holt S., Myskov M., Spedding A., Barraclough B.R., Rudland P.S. The long term prognostic significance of c-erbB-2 in primary breast cancer. Br J Cancer. 1991;63:447–450. doi: 10.1038/bjc.1991.103. [DOI] [PMC free article] [PubMed] [Google Scholar]
- 42.Davies M.P.A., Barraclough D.L., Stewart C., Joyce K.A., Eccles R.M., Barraclough R., Rudland P.S., Sibson D.R. Expression and splicing of the unfolded response gene XBP-1 are significantly associated with clinical outcome of endocrine-treated breast cancer. Int J Cancer. 2008;123:85–88. doi: 10.1002/ijc.23479. [DOI] [PubMed] [Google Scholar]
- 43.Podo F., Buydens L.M., Degani H., Hilhorst R., Klipp E., Gribbestad I.S., Van Huffel S., van Laarhoven H.W., Luts J., Monleon D., Postma G.J., Schneiderhan-Marra N., Santoro F., Wouters H., Russnes H.G., Sørlie T., Tagliabue E., Børresen-Dale A.L., FEMME Consortium Triple-negative breast cancer: present challenges and new perspectives. Mol Oncol. 2010;4:209–229. doi: 10.1016/j.molonc.2010.04.006. [DOI] [PMC free article] [PubMed] [Google Scholar]
- 44.Taniguchi T., Garcia-Higuera I., Andreassen P.R., Gregory R.C., Grompe M., D'Andrea A.D. S-phase-specific interaction of the Fanconi anemia protein, FANCD2, with BRCA1 and RAD51. Blood. 2002;100:2414–2420. doi: 10.1182/blood-2002-01-0278. [DOI] [PubMed] [Google Scholar]
- 45.Jones C., Nonni A.V., Fulford L., Merrett S., Chagger R., Eusebi U., Lakhani S.R. CGH analysis of ductal carcinoma of the breast with basaloid/myoepithelial cell differentiation. Br J Cancer. 2001;85:422–427. doi: 10.1054/bjoc.2001.1869. [DOI] [PMC free article] [PubMed] [Google Scholar]
- 46.Korsching E., Packeisen J., Agelopoulos K., Eisenacher M., Voss R., Isola J., van Diest P.J., Brandt B., Boecker W., Buerger H. Cytogenetic alterations and cytokeratin expression patterns in breast cancer: integrating a new model of breast differentiation into cytogenetic pathways of breast carcinogenesis. Lab Invest. 2002;82:1525–1533. doi: 10.1097/01.lab.0000038508.86221.b3. [DOI] [PubMed] [Google Scholar]
- 47.Perou C.M., Sørlie T., Eisen M.B., van de Rijn M., Jeffrey S.S., Rees C.A., Pollack J.R., Ross D.T., Johnsen H., Akslen L.A., Fluge O., Pergamenschikov A., Williams C., Zhu S.X., Lønning P.E., Børresen-Dale A.L., Brown P.O., Botstein D. Molecular portraits of human breast tumours. Nature. 2000;406:747–752. doi: 10.1038/35021093. [DOI] [PubMed] [Google Scholar]
- 48.Sørlie T., Perou C.M., Tibshirani R., Aas T., Geisler S., Johnsen H., Hastie T., Eisen M.B., van de Rijn M., Jeffrey S.S., Thorsen T., Quist H., Matese J.C., Brown P.O., Botstein D., Eystein Lønning P., Børresen-Dale A.L. Gene expression patterns of breast carcinomas distinguish tumor subclasses with clinical implications. Proc Natl Acad Sci USA. 2001;98:10869–10874. doi: 10.1073/pnas.191367098. [DOI] [PMC free article] [PubMed] [Google Scholar]
- 49.van 't Veer L.J., Dai H., van de Vijver M.J., He Y.D., Hart A.A., Mao M., Peterse H.L., van der Kooy K., Marton M.J., Witteveen A.T., Schreiber G.J., Kerkhoven R.M., Roberts C., Linsley P.S., Bernards R., Friend S.H. Gene expression profiling predicts clinical outcome of breast cancer. Nature. 2002;415:530–536. doi: 10.1038/415530a. [DOI] [PubMed] [Google Scholar]
- 50.Barraclough D.L., Sewart S., Rudland P.S., Shoker B.S., Sibson D.R., Barraclough R., Davies M.P. Microarray analysis of suppression subtracted hybridisation libraries identifies genes associated with breast cancer progression. Cell Oncol. 2010;32:87–99. doi: 10.3233/CLO-2009-0499. [DOI] [PMC free article] [PubMed] [Google Scholar]
- 51.Rudland P.S., Hughes C.M. Immunocytochemical identification of cell types in human mammary gland: variations in cellular markers are dependent on glandular topography and differentiation. J Histochem Cytochem. 1989;37:1087–1100. doi: 10.1177/37.7.2471725. [DOI] [PubMed] [Google Scholar]
- 52.Rudland P.S. Histochemical organization and cellular composition of ductal buds in developing human breasts: evidence for cytological intermediates between epithelial and myoepithelial cells. J Histochem Cytochem. 1991;39:1471–1484. doi: 10.1177/39.11.1918925. [DOI] [PubMed] [Google Scholar]
- 53.Gusterson B.A., Ross D.T., Heath V.J., Stein T. Basal cytokeratins and their relationship to the cellular origin and functional classification of breast cancer. Breast Cancer Res. 2005;7:143–148. doi: 10.1186/bcr1041. [DOI] [PMC free article] [PubMed] [Google Scholar]
- 54.Böcker W., Moll R., Poremba C., Holland R., Van Diest P.J., Dervan P., Bürger H., Wai D., Ina Diallo R., Brandt B., Herbst H., Schmidt A., Lerch M.M., Buchwallow I.B. Common adult stem cells in the human breast give rise to glandular and myoepithelial cell lineages: a new cell biological concept. Lab Invest. 2002;82:737–746. doi: 10.1097/01.lab.0000017371.72714.c5. [DOI] [PubMed] [Google Scholar]
- 55.Boecker W., Buerger H. Evidence of progenitor cells of glandular and myoepithelial cell lineages in the human adult female breast epithelium: a new progenitor (adult stem) cell concept. Cell Prolif. 2003;36(Suppl 1):73–84. doi: 10.1046/j.1365-2184.36.s.1.7.x. [DOI] [PMC free article] [PubMed] [Google Scholar]
- 56.Rudland P.S., Ollerhead G., Barraclough R. Isolation of simian virus 40-transformed human mammary epithelial stem cell lines that can differentiate to myoepithelial-like cells in culture and in vivo. Dev Biol. 1989;136:167–180. doi: 10.1016/0012-1606(89)90139-5. [DOI] [PubMed] [Google Scholar]
- 57.Clayton H., Titley I., Vivanco M. Growth and differentiation of progenitor/stem cells derived from the human mammary gland. Exp Cell Res. 2004;297:444–460. doi: 10.1016/j.yexcr.2004.03.029. [Erratum appeared in Exp Cell Res 2004;300:257] [DOI] [PubMed] [Google Scholar]
- 58.Lim E., Vaillant F., Wu D., Forrest N.C., Pal B., Hart A.H., Asselin-Labat M.L., Gyorki D.E., Ward T., Partanen A., Feleppa F., Huschtscha L.I., Thorne H.J., kConFab, Fox S.B., Yan M., French J.D., Brown M.A., Smyth G.K., Visvader J.E., Lindeman G.J. Aberrant luminal progenitors as the candidate target population for basal tumor development in BRCA1 mutation carriers. Nat Med. 2009;15:907–913. doi: 10.1038/nm.2000. [DOI] [PubMed] [Google Scholar]
- 59.Bennett D.C., Peachey L.A., Durbin H., Rudland P.S. A possible mammary stem cell line. Cell. 1978;15:283–298. doi: 10.1016/0092-8674(78)90104-6. [DOI] [PubMed] [Google Scholar]
- 60.Ormerod E.J., Rudland P.S. Cellular composition and organisation of ductal buds in developing rat mammary glands: evidence for morphological intermediates between epithelial and myoepithelial cells. Am J Anat. 1984;170:631–652. doi: 10.1002/aja.1001700408. [DOI] [PubMed] [Google Scholar]
- 61.Asselin-Labat M.L., Shackleton M., Stingl J., Vaillant F., Forrest N.C., Eaves C.J., Visvader J.E., Lindeman G.J. Steroid hormone receptor status of mouse mammary stem cells. J Natl Cancer Inst. 2006;98:1011–1014. doi: 10.1093/jnci/djj267. [DOI] [PubMed] [Google Scholar]
- 62.Rudland P.S. Epithelial stem cells and their possible role in the development of the normal and diseased breast. Histol Histopathol. 1993;8:385–404. [PubMed] [Google Scholar]
- 63.Behbod F., Rosen J.M. Will cancer stem cells provide new therapeutic targets? Carcinogenesis. 2005;26:703–711. doi: 10.1093/carcin/bgh293. [DOI] [PubMed] [Google Scholar]
- 64.Stingl J., Caldas C. Molecular heterogeneity of breast carcinomas and the cancer stem cell hypothesis. Nat Rev Cancer. 2007;7:791–799. doi: 10.1038/nrc2212. [DOI] [PubMed] [Google Scholar]
- 65.Petersen O.W., Gudjonsson T., Villadsen R., Bissell M.J., Rønnov-Jessen L. Epithelial progenitor cell lines as models of normal breast morphogenesis and neoplasia. Cell Prolif. 2003;36(Suppl 1):33–44. doi: 10.1046/j.1365-2184.36.s.1.4.x. [DOI] [PMC free article] [PubMed] [Google Scholar]
- 66.Clarke R.B., Spence K., Anderson E., Howell A., Okano H., Potten C.S. A putative breast stem cell population is enriched for steroid receptor-positive cells. Dev Biol. 2005;277:443–456. doi: 10.1016/j.ydbio.2004.07.044. [DOI] [PubMed] [Google Scholar]
- 67.Korsching E., Packeisen J., Liedtke C., Hungermann D., Wülfing P., van Diest P.J., Brandt B., Boecker W., Buerger H. The origin of vimentin expression in invasive cancer: epithelial-mesenchymal transition, myoepithelial histogenesis or histogenesis from progenitor cells with bilinear differentiation potential? J Pathol. 2005;206:451–457. doi: 10.1002/path.1797. [DOI] [PubMed] [Google Scholar]
- 68.Abraham B.K., Fritz P., McClellan M., Hauptvogel P., Athelogou M., Brauch H. Prevalence of CD44+/CD24-/low cells in breast cancer may not be associated with clinical outcome but may favor distant metastasis. Clin Cancer Res. 2005;11:1154–1159. [PubMed] [Google Scholar]
- 69.Ginestier C., Hur M.H., Charafe-Jauffret E., Monville F., Dutcher J., Brown M., Jacquemier J., Viens P., Kleer C.G., Liu S., Schott A., Hayes D., Birnbaum D., Wicha M.S., Dontu G. ALDH1 is a marker of normal and malignant human mammary stem cells and a predictor of poor clinical outcome. Cell Stem Cell. 2007;1:555–567. doi: 10.1016/j.stem.2007.08.014. [DOI] [PMC free article] [PubMed] [Google Scholar]
- 70.Wright M.H., Calcagno A.M., Salcido C.D., Carlson M.D., Ambudkar S.V., Varticovski L. Brca1 breast tumors contain distinct CD44 +/CD24- and CD133+ cells with cancer stem cell characteristics. Breast Cancer Res. 2008;10:R10. doi: 10.1186/bcr1855. [DOI] [PMC free article] [PubMed] [Google Scholar]
- 71.Molyneux G., Geyer F.C., Magnay F.A., McCarthy A., Kendrick H., Natrajan R., Mackay A., Grigoriadis A., Tutt A., Ashworth A., Reis-Filho J.S., Smalley M.J. BRCA1 basal-like breast cancers originate from luminal epithelial progenitors and not from basal stem cells. Cell Stem Cell. 2010;7:403–417. doi: 10.1016/j.stem.2010.07.010. [DOI] [PubMed] [Google Scholar]
- 72.Hosey A.M., Gorski J.J., Murray M.M., Quinn J.E., Chung W.Y., Stewart G.E., James C.R., Farragher S.M., Mulligan J.M., Scott A.N., Dervan P.A., Johnston P.G., Couch F.J., Daly P.A., Kay E., McCann A., Mullan P.B., Harkin D.P. Molecular basis for estrogen receptor alpha deficiency on BRCA1-linked breast cancer. J Natl Cancer Inst. 2007;99:1683–1694. doi: 10.1093/jnci/djm207. [DOI] [PMC free article] [PubMed] [Google Scholar]
- 73.Gorski J.J., James C.R., Quinn J.E., Stewart G.E., Staunton K.C., Buckley N.E., McDyer F.A., Kennedy R.D., Wilson R.H., Mullan P.B., Harkin D.P. BRCA1 transcriptionally regulates genes associated with the basal-like phenotype in breast cancer. Breast Cancer Res Treat. 2010;122:721–731. doi: 10.1007/s10549-009-0565-0. [DOI] [PubMed] [Google Scholar]
- 74.Liu S., Ginestier C., Charafe-Jauffret E., Foco H., Kleer C.G., Merajver S.D., Dontu G., Wicha M.S. BRCA1 regulates human mammary stem cell progenitor cell fate. Proc Natl Acad Sci USA. 2008;105:1680–1685. doi: 10.1073/pnas.0711613105. [DOI] [PMC free article] [PubMed] [Google Scholar]
- 75.El-Tanani M.K., Campbell F.C., Crowe P., Erwin P., Harkin D.P., Pharoah P., Ponder B., Rudland P.S. BRCA1 suppresses osteopontin-mediated breast cancer. J Biol Chem. 2006;281:26587–26601. doi: 10.1074/jbc.M604403200. [DOI] [PubMed] [Google Scholar]
- 76.Rudland P.S., Barraclough R., Fernig D.G., Smith J.A. Mammary stem cells in normal development and cancer: Stem Cells. In: Potten C.S., editor. Academic Press; London: 1996. pp. 147–232. [Google Scholar]
Associated Data
This section collects any data citations, data availability statements, or supplementary materials included in this article.
Supplementary Materials
IHC staining in color of human breast tissues for cytokeratins. A: Incubation of normal breast duct tissue with antibody to CK14 shows brown staining of myoepithelial/basal cells (arrowheads) and of occasional suprabasal epithelial-like cells (arrows); most epithelial cells (e) and the adjacent stromal cells (s) were unstained. B: Invasive carcinoma stained for CK5/6 shows no IHC staining. C: Invasive carcinoma stained for CK5/6 shows borderline staining of the occasional brown malignant cell (arrow). D: Invasive carcinoma stained for CK5/6 shows positive brown staining for malignant cells. E: Invasive carcinoma stained for CK14 shows positive brown staining for malignant epithelial cells (e); stromal cells (s) were unstained. F: A different section of the invasive carcinoma shown in E, at a higher magnification, illustrates cytoplasmic staining in malignant epithelial cells (e) stained for CK14; stromal cells (s) were unstained. Nuclei were stained blue with Mayer's hemalum throughout. Original magnification: ×385 (B–E); ×770 (A and F). Scale bars = 20 μm.
IHC staining in color of invasive breast carcinoma classified as positively stained for cytokeratins CK14 and CK5/6. A and B: Near-adjacent sections of the same invasive carcinoma. Tissue incubated with mAb to CK14 shows strongly stained brown carcinoma cells (A); there is no staining with the same mAb preincubated with our synthetic peptide (B); stromal cells (s) were unstained under both conditions. C and D: Near-adjacent sections of the same invasive carcinoma. Tissue incubated with mAb to CK5/6 (C) shows strongly stained brown carcinoma cells; tissue incubated with mAb to osteopontin (D) shows the brown beaded cytoplasmic staining characteristic of osteopontin (see Ref. 19). E and F: Sections of the same invasive carcinoma incubated with mAb to CK5/6 (brown stain) and to S100A4 (pink/red stain); the primary antibodies were detected by horseradish peroxidase oxidation of diaminobenzidine (DAB) or alkaline phosphatase hydrolysis of naphthol dyes, respectively (as described under Materials and Methods). Some cells were stained both brown and red/pink in the cytoplasm, for both CK5/6 and S100A4 (E, arrows), whereas the majority of the cells stained separately either brown for CK5/6 or red/pink for S100A4 (F). Nuclei were stained blue with Mayer's hemalum throughout. Original magnification: ×310 (F); ×385 (A-D); ×480 (E). Scale bars = 20 μm.
Association of IHC staining for CK5/6 and CK14 with overall duration of patient survival. The cumulative proportion of surviving patients as a percentage of the total for each year after presentation for patients with carcinomas classified as unstained for either CK14 or CK5/6 (set a, solid line), positively stained for CK14 and unstained for CK5/6 (set b, dotted line), unstained for CK14 and positively stained for CK5/6 (set c, dashed line), or positively stained for both CK14 and CK5/6 (set d, dot-and-dash line). There were 142 censored observations in set a (47 dead of other causes), 12 in set b (six dead of other causes), seven in set c (one dead of other causes), and five in set d (two dead of other causes). The curves were highly significantly different overall (Wilcoxon statistic χ2 = 121.02, 3 df, P < 0.0001) and in pairwise combinations for sets a and b (χ2 = 64.48, 1 df, P < 0.0001; Cox's univariate analysis RR = 10.45, 95% CI = 5.88 to 18.5), sets a and c (χ2 = 64.37, 1 df, P < 0.0001; RR = 11.52, 95% CI = 6.37 to 20.8), and sets a and d (χ2 = 102.92, 1 df, P < 0.0001; RR = 14.15, 95% CI = 8.34 to 24.0). There was no significant difference in pairwise combinations for sets b and c (χ2 = 0.03, 1 df, P = 0.855), sets b and d (χ2 = 0.28, 1 df, P= 0.594), and sets c and d (χ2 = 0.34, 1 df, P= 0.558).