

Abstract
Airway mucosal dendritic cells (DCs), located beneath the epithelium of the conducting airways, are believed to be specialized for immunosurveillance via sampling of antigens from the airway luminal surface. However, the dynamics of airway DC activity has not yet been visualized. We used two-photon microscopy to illuminate the endogenous mucosal DC network in the airways of mice. To characterize DC behavior, we used lung section preparations and an intravital microscopic approach. DCs displayed a heterogeneous movement pattern according to their localization within the airway mucosa: sessile intraepithelial DCs with a dendritiform shape exhibited active probing movements and occasionally formed transepithelial extensions into the airway lumen. In contrast, DCs within the deeper layers of the mucosal tissue migrated fast in an amoeboid manner, without probing movements, and slowed down after aeroallergen challenge. Strikingly, neither of these two mucosal DC populations ingested fluorescently labeled antigens after antigen administration to the airways in the steady state, in contrast to alveolar macrophage/DC populations in the lung periphery. Our results provide a first description of the dynamic behavior of airway mucosal DCs, with their exact role in antigen sampling remaining unclear.
Dendritic cells (DCs) of the respiratory tract have been attributed a central role in the induction of tolerance and adaptive immunity to inhaled antigens.1,2 Indirect evidence has suggested that airway DCs fulfill this role via capturing antigens in the lungs, processing and presenting antigen in the context of major histocompatibility complex (MHC) molecules on their surface, and migrating to lung-draining lymph nodes, where they activate T cells.3 Because of their effective antigen-transporting and presenting function, airway DCs have been implicated to mediate sensitization to inhaled allergens, resulting in a TH2-biased immune response as observed, for example, in allergic asthma.4 Beyond their role in allergic sensitization, DCs are also essential for generating allergen-specific effector TH2 responses in ongoing inflammation.5 The activity of airway mucosal DCs is influenced by their local interactions with epithelial cells6 and mucosal memory T cells.7
Two-photon microscopy has been extensively used for visualizing cells of the immune system in vivo.8 The dynamic behavior of DCs in the draining lymph nodes and their interactions with T cells during immune response generation have been well characterized.9,10 The dynamics of the DC network in peripheral tissues, however, is poorly understood. Recent imaging studies using intravital two-photon microscopy revealed how lamina propria DCs in the gut form transepithelial extensions to sample the bacterial content of the gut lumen11 and how skin DCs are mobilized during contact sensitization or by adjuvant stimulation.12 However, we have only limited knowledge on the dynamic behavior of airway mucosal DCs.
We used dynamic ex vivo and in vivo two-photon microscopy to visualize the endogenous airway mucosal DC network in mice. Our results demonstrate that DCs located beneath the airway mucosal epithelium display a heterogeneous motility pattern both in the steady state and in response to antigen inhalation. We show that intraepithelial DCs are capable of forming transepithelial extensions into the airway lumen. However, these events are extremely rare, and the functional relevance remains questionable.
Materials and Methods
Animals
CD11c-enhanced yellow fluorescent protein (EYFP)-transgenic mice10 (kindly provided by Michel C. Nussenzweig, The Rockefeller University, New York, NY) on a C57BL/6 background were used at 10 to 15 weeks of age. All animal experiments were performed in concordance with the German animal protection law under a protocol approved by the appropriate governmental authority (Lower Saxony State Office for Consumer Protection and Food Safety, Wardenburg, Germany).
Sensitization and Allergen Challenge
Mice were sensitized with 10 μg of ovalbumin (OVA; grade VI; Sigma-Aldrich, St. Louis, MO) adsorbed to 1.5 mg of Al(OH)3 diluted in 0.9% NaCl on days 0, 14, and 21 via i.p. injection or sham sensitized with 1.5 mg of Al(OH)3 in 0.9% NaCl i.p., respectively. On day 27, all animals were exposed to 1% OVA aerosol in 0.9% NaCl for 20 minutes.
Preparation of Vital Lung Sections
A solution of 3% agarose (type VII-A; low gelling temperature; Sigma-Aldrich) was prepared in distilled water at 60°C. The solution was cooled down to 37°C and mixed with an equal amount of 2× medium 199 (Invitrogen, Carlsbad, CA) to make a 1.5% agarose solution in 1× medium 199 at 37°C. Twenty-four hours after allergen challenge, animals were sacrificed with an overdose of intraperitoneally administered pentobarbital. After exsanguination the chest cavity was opened, the trachea was cannulated with an 18-gauge i.v. catheter, and the lungs were inflated with the agarose/medium solution. Subsequently, the lungs were covered with fresh ice for 5 minutes, removed, and placed on ice in HBSS supplemented with 25 mmol/L HEPES for 15 minutes to ensure complete gelling of the agarose. Section preparations were cut using an OTS-5000 oscillating tissue slicer (Electron Microscopy Sciences, Hatfield, PA) using the left lung and the superior and inferior lobes of the right lung. From each of these lobes, one or two 300-μm-thick sections were cut with a section plane running parallel with the main axial pathway (in case of the left and the right inferior lobe) or with the plane at which the bifurcations of the main bronchi are located (in case of the right superior lobe). This approach allowed us to generate sections in which a large proportion of the airway mucosa was exposed for imaging in longitudinally cut bronchi. The section preparations were incubated at 37°C in a cell culture incubator for at least 2 hours, after which the agarose left the lumen of large bronchi. Finally, sections were labeled with the vital dye seminaphtorhodafluor-1-acetoxymethylester (SNARF-1; Invitrogen; 10 μmol/L for 15 minutes at 37°C) in medium 199, washed, and maintained at 37°C in a cell culture incubator until imaging. For microscopic analysis, section preparations were placed in a POC-R imaging chamber combined with a heating insert P (both from PeCon, Erbach, Germany). To hold the sections in place, they were attached to the coverslip bottom using a section anchor (Harvard Apparatus, Holliston, MA). The imaging chamber was heated to 37°C and continuously superfused with prewarmed medium 199. The medium was kept at pH 7.4 by bubbling the reservoir with carbogen gas containing 95% O2 and 5% CO2.
Surgical Preparation for Intravital Microscopy
Twenty-four hours after allergen challenge, mice were treated intranasally (under isoflurane anesthesia) with 25 μg of SNARF-1, diluted in 50 μL of PBS, to fluorescently label the tracheal epithelium. One hour later, mice were anesthetized with an i.p. injection of ketamine (50 mg/kg) and xylazine (10 mg/kg) and attached to a custom-built intravital imaging platform. The trachea was surgically exposed by making a small incision on the neck followed by blunt dissection between layers of muscle to minimize tissue injury. Muscles covering the trachea were retracted using a wire. In some experiments, animals were orotracheally intubated with a cannula (Harvard Apparatus) to immobilize the trachea. After filling the surgical area with PBS, a 5-mm coverslip, attached to a custom-built holding and warming device, was placed on the surface of the trachea and sealed with vacuum grease. A thermocouple was inserted just beneath the coverslip to maintain a temperature of 37°C at the observation area.
Two-Photon Microscopy and Image Analysis
Multidimensional images were acquired using a TrimScope two-photon microscope (LaVision BioTec, Bielefeld, Germany) equipped with a Spectra-Physics MaiTai HP ultrafast laser (Newport, Irvine, CA). Laser wavelength was set to 920 nm for the optimal excitation of EYFP and SNARF-1. Bandpass filters 490/50, 525/50, and 630/75 were used for the detection of a second harmonic signal, EYFP and SNARF-1, respectively. All images were acquired using an Olympus 20× water immersion objective (numeric aperture = 0.95). For the analysis of DC motility, image stacks with a Z-resolution of 1 μm were acquired at 30-second or 60-second intervals.
Four-dimensional image series were analyzed using Imaris software version 6.2.1 (Bitplane, Switzerland). Mean velocity and displacement of DCs were measured using the automated tracking feature. The accuracy of cell tracking was manually controlled. Because the length of image acquisition varied among the experiments, displacement was normalized for a period of 1 hour. Cells with a displacement smaller than 2.5 μm were considered as immotile and their tracks were filtered out. Statistical significance of differences in the motility parameters of DCs between PBS/OVA and OVA/OVA animals were analyzed with an unpaired t-test using GraphPad Prism version 4.03 (GraphPad Software, La Jolla, CA).
Intranasal Antigen Delivery and Whole-Mount Microscopy
Mice were anesthetized using isoflurane and intranasally treated with 50 μL of i) 108 tetramethylrhodamine (TR)–labeled, heat-killed Escherichia coli particles, ii) 108 crimson-fluorescent microspheres with a size of 1.0 μm, or iii) 0.5 mg of Alexa Fluor 647–labeled 10.000 molecular weight dextran (all from Invitrogen), diluted in 50 μL of PBS. Two hours later, the animals were sacrificed with an overdose of pentobarbital and the lungs were processed for whole-mount analysis as described previously.13,14 Image stacks were acquired using an LSM 510 META confocal microscope (Carl Zeiss, Jena, Germany).
Results
Airway Mucosal DCs Display a Heterogeneous Motility Pattern
The CD11c-EYFP transgene revealed two characteristic DC networks in the airway mucosa (Figure 1, A and B): DCs within the epithelium showed a typical dendritiform shape, with long extensions that reached out mainly in a lateral direction, parallel with the epithelial basement membrane; and DCs within the subepithelial compartments displayed an amoeboid shape, without the presence of long cellular extensions. The subepithelial population contained approximately four times more CD11c-EYFP+ cells compared with the intraepithelial population (Figure 1A). The intraepithelial CD11c-EYFP+ DC network was completely identical to a network of MHC-II+ cells, whereas in the subepithelial layers, only a population of MHC-II+ cells expressed EYFP (Figure 1B), as described previously.13
Figure 1.
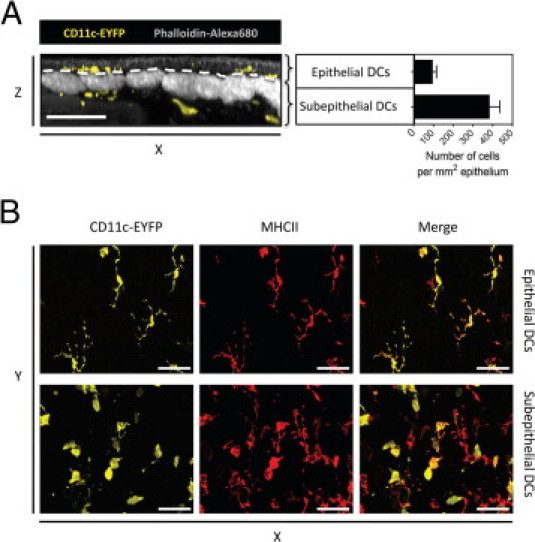
The distribution of epithelial and subepithelial DC populations. Bronchial whole-mount preparations from CD11c-EYFP mice were stained for MHC-II and subsequently labeled with phalloidin–Alexa 680 to simultaneously visualize EYFP+ cells (yellow) and MHC-II+ cells (red) in relation to the epithelium and smooth muscle layer (gray) using confocal microscopy. A: Confocal Z-stack is shown as a Y-projection side view to demonstrate the distinction of epithelial and subepithelial compartments of the airway mucosa (separated by white dashed line) (left), and the graph shows the number of CD11c-EYFP+ cells beneath an area of 1-mm2 airway epithelium (right). Cell count was determined at the proximal part of the left main axial pathway from five mice. B: Confocal Z-projections top views of the optical sections generated within the epithelial (upper panels) and subepithelial layer (lower panels) of the same confocal Z-stack showing the distribution of CD11c-EYFP+ and MHC-II+ cells. Scale bar = 50 μm.
To visualize the motility of the mucosal DC network, vibratome sections from lungs of CD11c-EYFP reporter mice were generated. In these section preparations, longitudinal sections of the main conducting airways were visible, enabling the direct observation of the airway mucosa using two-photon microscopy (Figure 2; see also Supplemental Video S1 at http://ajp.amjpathol.org). Staining with the vital dye SNARF-1 revealed the bronchial epithelium, allowing for the identification of the epithelial and subepithelial DC populations (Figure 3, A and C). We examined the motility pattern of DCs along the whole length of the airway tree, starting from the proximal, large bronchi toward the distal branches with smaller diameters. On the basis of their localization and morphologic characteristics, in both large and small bronchi we were able to distinguish the previously observed two types of airway mucosal DCs (ie, epithelial and subepithelial DCs). Both DC types were present in the mucosa of the large and the smaller bronchi; however, epithelial DCs were less frequent toward the periphery.
Figure 2.
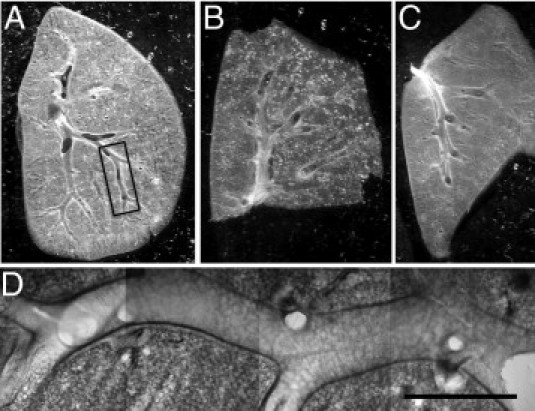
Lung section preparations suitable for dynamic imaging of airway mucosal DCs. A-C: Low-magnification photomicrographs of freshly prepared sections made from the superior lobe (A) and the inferior lobe (B) of the right lung and from the left lung (C). The sections were cut in the level of the main conducting airways. D: Typical location used for two-photon microscopy. Mosaic of four microscopic images obtained with a ×10 objective lens corresponding to the boxed region shown in A. Scale bar = 1 mm.
Figure 3.
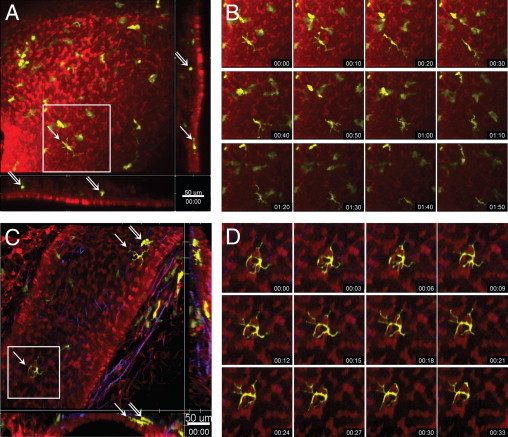
Steady-state motility of DCs within different layers of the airway mucosa. Two-photon microscopic images of the airway mucosa in central, large-diameter bronchi (A and B) or peripheral, small-diameter bronchi (C and D) with CD11c-EYFP+ DCs (yellow) located within and beneath the epithelium (red), revealed by SNARF-1 staining. Second harmonic signals generated by collagen fibers are shown in blue. A and C: Maximum-intensity projections along the Z-axis (top view) or the x- and y-axes (side views, representing only a few optical sections). Arrows indicate intraepithelial DCs with typical dendritiform morphologic characteristics; double arrows show subepithelial DCs with rounded or amoeboid shape. Scale bar = 50 μm. B and D: Image sequences (see Supplemental Videos S2 and S3 at http://ajp.amjpathol.org) showing the locations of the corresponding boxed regions in A and C indicating the slow migration (B) and the probing movements (D) and of an epithelial DC. Time scale is shown as hh:mm.
Using time-lapse imaging, these two different types of EYFP+ DCs were found to display different patterns of motility. Epithelial DCs were mainly sessile or slowly crawling just beneath the epithelium while actively protruding and retracting their dendritic processes, whereas subepithelial DCs did not show probing behavior, instead they randomly migrated beneath the epithelium in a lateral direction and covered large areas over time (Figure 3, B and D; see also Supplemental Videos S2 and S3 at http://ajp.amjpathol.org).
To compare the motility pattern of DCs observed in section preparations with their in vivo behavior, we performed intravital two-photon microscopy of the tracheal mucosa. Tracheal epithelial and subepithelial DCs displayed a similar movement pattern as observed using the ex vivo lung section approach (see Supplemental Video S4 at http://ajp.amjpathol.org).
Projection of Transepithelial Extensions into the Airway Lumen
The formation of DC extensions across the epithelial layer is a well documented phenomenon in the gut.11,15 However, the existence of such extensions across the bronchial epithelium and their role in antigen sampling remain unclear. Because our setup allowed the visualization of the epithelial layer together with the underlying DC network, we searched for extensions of EYFP+ epithelial DCs projecting into the airway lumen. Figure 4 shows the formation of a long DC extension reaching out to the luminal side of the epithelial layer (see Supplemental Videos S5 and S6 at http://ajp.amjpathol.org). However, we observed this phenomenon only in two independent experiments, whereas in most cases DC extensions ran in a lateral direction, parallel with the basement membrane.
Figure 4.
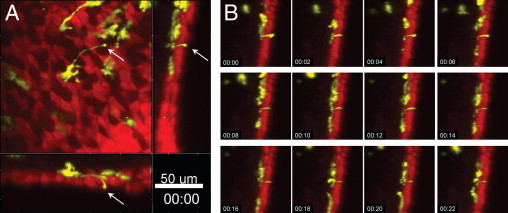
Projection of transepithelial extensions. Two-photon microscopic images of the airway mucosa with CD11c-EYFP+ DCs (yellow) located within and beneath the epithelium (red), revealed by SNARF-1 staining. A: CD11c-EYFP+ DC forming an extension across the epithelium (arrows). Maximum-intensity projections along the z-axis (top view) or the x- and y-axes (side views, representing only a few optical section). Scale bar = 50 μm. B: Image sequence (see Supplemental Video S5 at http://ajp.amjpathol.org) showing the corresponding side view in A, indicating the dynamic activity of the transepithelial DC projection. Time scale is shown as hh:mm.
DC Motility after Aeroallergen Challenge
Allergen exposure of previously sensitized mice has been shown to enhance allergen capture and processing in normally quiescent airway mucosal DC populations.16 This local maturation of DCs makes them capable of making cognate interactions with mucosal memory T cells.7 In previous imaging studies performed on skin DCs, maturation in response to antigen/adjuvant treatment was associated with pronounced changes in their motility.12,17 Therefore, we measured the motility of airway mucosal DCs after allergen inhalation, using a mouse model of allergic airways disease. We measured the mean velocity and displacement of DCs using a filter that excluded cells slower than 2.5 μm/min to distinguish real displacement from probing movements of sessile cells.10 Accordingly, intraepithelial sessile DCs were mostly excluded from this analysis and the measurements reflect the motility of the subepithelial DC population. Twenty-four hours after aeroallergen challenge, both the velocity and displacement of DCs in the airway mucosa of allergen-sensitized mice were decreased, compared with the nonsensitized controls (Figure 5). This difference in DC motility was observed both in the tracheal mucosa (Figure 5A), analyzed via intravital microscopy, and in the mucosa of the intrapulmonary airways (Figure 5B) in ex vivo section preparations (see Supplemental Video S7 at http://ajp.amjpathol.org).
Figure 5.
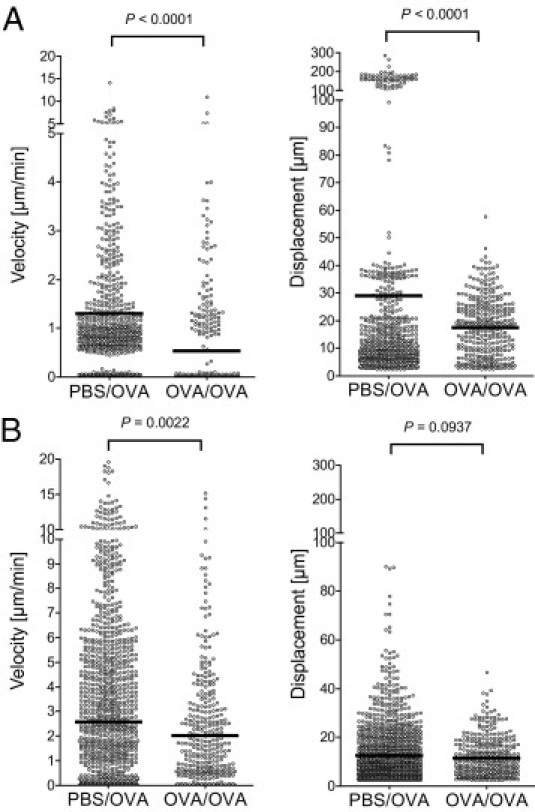
Quantitative analysis of DC motility after aeroallergen challenge. CD11c-EYFP mice were sensitized to OVA/Al(OH)3 i.p. on days 0, 14, and 21 and exposed to OVA aerosol on day 27 (OVA/OVA group). Controls received PBS/Al(OH)3 i.p. and received OVA aerosol, respectively (PBS/OVA group). On day 28, half of the mice were anesthetized and DC motility in the trachea was analyzed using intravital two-photon microscopy. The other half of the animals was sacrificed, and vital lung sections were prepared using a vibratome. The motility of DCs in the bronchial mucosa within section preparations was analyzed using two-photon microscopy. Mean velocities and displacements of DCs were calculated by analyzing four-dimensional image series generated using either the intravital microscopic setup (A) or section preparations (B). Circles represent the velocities and displacement of individual cells; black bars indicate mean values. Graphs collectively show the data obtained from three independent experiments for each setup.
Visualization of Antigen Uptake
The primary role of airway mucosal DCs is to sample the airway lumen for inhaled antigens and process them for subsequent presentation to T cells in the draining lymph nodes or locally in the airway mucosa. Therefore, we attempted to visualize the dynamic process of antigen sampling by treating vibratome sections with fluorescently labeled particles (E. coli particles and polystyrene beads) or soluble macromolecules (OVA and dextran). Uptake of these antigens by DCs would then result in a clear colocalization of their fluorescence with EYFP fluorescence. Surprisingly, we were unable to detect the uptake of any sort of antigen preparation by DCs lining the bronchial mucosa when applied on the section preparations, independently of the time delay between antigen application and imaging or the amount of antigen applied (results not shown). Therefore, we next followed the distribution of inhaled antigen in the airways in vivo using static imaging. To this end, mice were treated with the fluorescent antigen preparations intranasally. Two hours after antigen application, both epithelial and subepithelial CD11c-EYFP+ DCs within the mucosa of the main conducting airways were clearly devoid of antigens (Figure 6, A, C, and E), whereas in the lung parenchyma of the same animals, small, rounded CD11c-EYFP+ cells (presumably alveolar macrophages) but not dendritiform CD11c-EYFP+ cells contained large amounts of fluorescently labeled antigen (Figure 6, B, D, and F). These experiments were also performed using allergen-sensitized mice, which received the fluorescent antigens 24 hours after aeroallergen challenge. However, experiments with inflamed airways yielded the same results (not shown) as those obtained using naïve mice.
Figure 6.
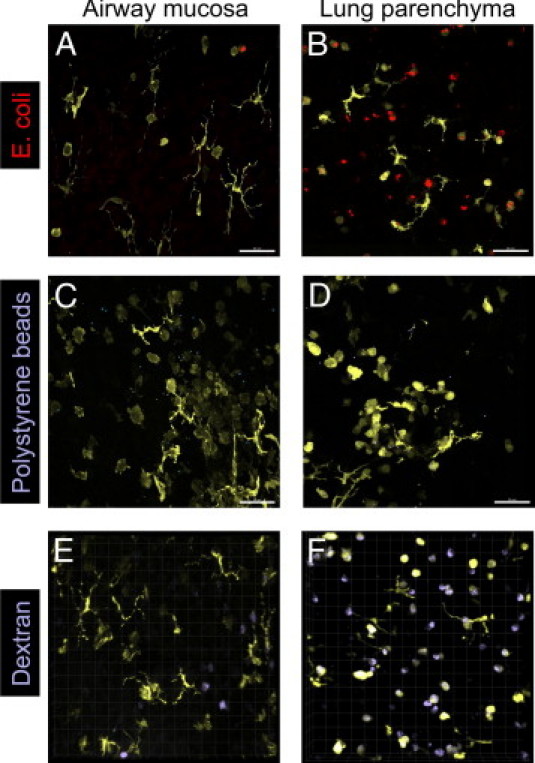
The fate of inhaled particles and soluble macromolecules. Naïve CD11c-EYFP mice were treated intranasally with E. coli–TR (A and B), crimson-fluorescent polystyrene beads (C and D), or dextran–Alexa Fluor 647 (E and F). Two hours later, the lungs were fixed, the main conducting airways were dissected, and the lung parenchyma was sliced with a vibratome to generate whole-mount preparations. Confocal images of the airway mucosa (A, C, and E) or the lung parenchyma (B, D, and F) were taken to detect CD11c-EYFP+ cells (yellow) containing E. coli–TR (red), microspheres (blue), or dextran (blue). Maximum intensity projections of confocal Z-stacks (A-D) or volume-rendered 3-dimensional images (E and F) are shown. Scale bar = 50 μm. Images are representative of at least three independent experiments with similar results.
Discussion
DCs of the airway mucosa have been previously suggested to scan the luminal environment of the airways for inhaled antigens. Accordingly, they are depicted in several review articles as sessile cells beneath or within the layer of ciliated epithelial cells, forming dendritic extensions across the epithelium that reach out into the airway lumen.6,18,19 This periscope function has been regarded as an important mechanism for continuous immune surveillance of the airway luminal surface.20 However, dynamic imaging studies performed in the airway mucosa so far delivered only limited evidence for the formation of such extensions.6 Moreover, the dynamic behavior of different airway mucosal DC populations in the steady state and after allergen inhalation has not been addressed in detail.
We described a two-photon microscopic approach that provides a clear view of the endogenous airway mucosal DC network within the intrapulmonary airways (in ex vivo section preparations) and in the trachea (in vivo), using the CD11c-EYFP reporter strain.10 This setup allowed us to distinguish between a sparse, mostly sessile intraepithelial DC population and a more numerous, fast-migrating subepithelial population within the deeper layers of the airway mucosa. Intraepithelial DCs with a typical dendritiform shape displayed vigorous probing movements, mostly in the lateral direction. However, in two cases we could clearly observe these cells forming extensions perpendicular to the epithelial sheet, reaching the airway lumen. Nevertheless, the physiologic role of transepithelial extensions in the airways remains enigmatic because the formation of such structures is a rare event, and at least under our experimental conditions, intraepithelial DCs did not internalize antigens after antigen exposure in the steady state. The intranasal delivery of fluorescently labeled latex beads or soluble antigen (OVA or dextran) is a well-established method for studying the trafficking and function of airway DCs.16,21,22 With this approach, antigen-bearing DCs have been detected in the lungs and in the draining lymph nodes via flow cytometry or via conventional immunohistologic analysis.
Our whole-mount microscopic approach revealed the complete three-dimensional network of intra- and subepithelial CD11c-EYFP+ DC populations of the airway mucosa, whereas in vibratome sections of peripheral lung tissue, both dendritiform CD11c-EYFP+ DCs and rounded CD11c-EYFP+ alveolar macrophages were visible. Alveolar macrophages are known to be CD11c+ cells (but they appear as MHC-IIneg/low cells compared with MHC-II+ DCs). In the CD11c-EYFP transgenic system, these cells indeed exhibit a bright yellow fluorescence, which is readily detectable not only in section preparations but also on alveolar macrophages recovered via bronchoalveolar lavage (results not shown). Thus, we believe that CD11c-EYFP+ cells with a rounded shape located within alveoli represent alveolar macrophages (or alveolar DCs). The in vivo exposure of mice with fluorescently labeled antigen was followed by a pronounced antigen accumulation in such rounded CD11c-EYFP+ cells in the lung parenchyma but never in intraepithelial dendritiform DCs of the airway mucosa, which questions the role of mucosal intraepithelial DCs as the DC population primarily involved in antigen sampling. Possible explanations for this finding are that these DCs internalize only minute amounts of antigen or antigen uptake by DCs might be a rare event, which is hardly detectable using our microscopic methods. Another explanation is offered by the highly effective activity of the mucociliary elevator: most inhaled particles entering into the mucous layer are transported away before DCs could reach them. In this respect, DCs would only sense those antigens that escape this clearance mechanism. Alternatively, inhaled particles may in fact need to breech the epithelial barrier to be detected by DCs, similar to the skin17; however, this would leave the role of transepithelial extensions unclear. Thus, further studies will be needed to address the role of intraepithelial DCs in antigen sampling and clarify their relationship to the previously reported antigen-bearing DCs.
In response to allergen inhalation, subepithelial DCs showed a decreased motility. In an earlier study addressing DC motility in the trachea, lipopolysaccharide exposure resulted in an increased velocity of DCs with rapid lateral movements,23 suggesting that the response of mucosal DCs to innate immune signals is substantially different from their response to allergen stimulation. It has been postulated earlier that during the onset of experimental allergic airways disease, airway DCs become capable of activating airway-resident CD4+ T cells.7,16 Our results showing a confined in situ migration of airway mucosal DCs are consistent with the presumption that after allergen exposure, DCs cease their patrolling behavior and slow down to make contacts with local T cells. However, the proof of this hypothesis will require the simultaneous visualization of antigen-bearing DCs and antigen-specific T cells by future imaging studies.
Acknowledgments
We thank Michel C. Nussenzweig (The Rockefeller University, New York, NY) for providing the CD11c-EYFP reporter mice, Thorsten Mempel (Massachusetts General Hospital and Harvard Medical School, Charlestown, MA) for help with setting up intravital microscopy, and Michael Hennig (Fraunhofer Institute for Toxicology and Experimental Medicine, Hannover, Germany) for manufacturing custom-made imaging equipment.
Footnotes
Supported by Deutsche Forschungsgemeinschaft (grant SFB 587/B4) and Fraunhofer Institute of Toxicology and Experimental Medicine.
Supplemental material for this article can be found at http://ajp.amjpathol.org or at doi:10.1016/j.ajpath.2011.04.039.
Current address of T.Z.V., MediCity Research Laboratory, University of Turku, Turku, Finland.
Supplementary data
Steady-state motility of DCs in the mucosa of the main conducting airways (low-magnification overview). A section preparation from the lungs of a CD11c-EYFP mouse was labeled with SNARF-1 to visualize the airway epithelium (red) together with CD11c-EYFP+ DCs (yellow). Note the probing movements of the epithelial, dendritiform cells. Video shows projections of Z-stacks recorded every minute over 1 hour. Time is shown in the format hh:mm:ss. Scale bar = 100 μm.
Epithelial and subepithelial DCs show different patterns of motility. This video corresponds to Figure 3B and shows the motility of DCs (yellow) in relation to the bronchial epithelium (red) in a section preparation, recorded over 2 hours. Projections were generated along the z-axis (top view) and along the x- and y-axes (side views). One dendritiform DC, located just beneath the epithelium, shows extensive probing movements in a lateral direction, whereas its centroid slowly crawls toward the bottom right corner of the image. In contrast, amoeboid DCs located in the deeper layers of the mucosa display a fast random migration without probing behavior. The area marked by yellow crosshairs in each view was used for generating the respective projection. Time is shown as hh:mm:ss.ms. Scale bar = 70 μm.
DC motility within the mucosa of the peripheral airways. This video corresponds to Figure 3, C and D, showing the motility of DCs (yellow) beneath the epithelium (red) in a small-diameter bronchus, recorded over 1 hour using a section preparation. Second harmonic signals (generated by collagen fibers) are shown in blue. Projections were generated along the z-axis (top view) and along the x- and y-axes (side views). Two epithelial dendritiform DC, located in the top right and bottom left corners of the XY image, are sessile but show extensive lateral probing movements. Time is shown as hh:mm:ss. Scale bar = 50 μm.
DC motility within the tracheal mucosa in vivo. Video shows the motility of DCs (yellow) beneath the epithelium (red) of the trachea, recorded over 40 minutes via intravital microscopy. Projections were generated along the z-axis (top view) and along the x- and y-axes (side views). Similarly, as observed in section preparations, epithelial DCs are sessile and display probing behavior with their long processes, whereas amoeboid cells in the deeper layers of the tracheal mucosa randomly migrate without probing movements. Time is shown as hh:mm:ss. Scale bar = 50 μm.
Projection of transepithelial extensions. This video corresponds to Figure 4 and shows a DC (yellow) with a long, thin cellular extension penetrating across the epithelial layer (red) and reaching out into the airway lumen. Projections were generated along the z-axis (top view) and along the x- and y-axes (side views). Time is shown as hh:mm:ss. Scale bar = 50 μm.
Projection of transepithelial extensions. Video shows a DC (yellow, in the middle of the field of view) with thin cellular extension penetrating the epithelial layer (red) and stretching out toward the airway lumen. Projections were generated along the z-axis (top view) and along the x- and y-axes (side views). Time is shown as hh:mm:ss. Scale bar = 50 μm.
DC motility after aeroallergen challenge. CD11c-EYFP mice were sensitized to OVA/Al(OH)3 i.p. on days 0, 14, and 21 and exposed to OVA aerosol on day 27 (OVA/OVA group). Controls received PBS/Al(OH)3 i.p. and received OVA aerosol, respectively (PBS/OVA group). On day 28, DC motility in lung sections was visualized using two-photon microscopy. Videos show the motility of DCs (yellow) beneath the epithelium (red) of the main conducting airways in sham-sensitized (PBS/OVA) and OVA-sensitized (OVA/OVA) animals. Projections were generated along the z-axis (top view) and along the x- and y-axes (side views).
References
- 1.Stumbles P.A., Upham J.W., Holt P.G. Airway dendritic cells: co-ordinators of immunological homeostasis and immunity in the respiratory tract. APMIS. 2003;111:741–755. doi: 10.1034/j.1600-0463.2003.11107806.x. [DOI] [PubMed] [Google Scholar]
- 2.Lambrecht B.N. Dendritic cells and the regulation of the allergic immune response. Allergy. 2005;60:271–282. doi: 10.1111/j.1398-9995.2005.00708.x. [DOI] [PubMed] [Google Scholar]
- 3.Vermaelen K.Y., Carro-Muino I., Lambrecht B.N., Pauwels R.A. Specific migratory dendritic cells rapidly transport antigen from the airways to the thoracic lymph nodes. J Exp Med. 2001;193:51–60. doi: 10.1084/jem.193.1.51. [DOI] [PMC free article] [PubMed] [Google Scholar]
- 4.Lambrecht B.N., Hammad H. Biology of lung dendritic cells at the origin of asthma. Immunity. 2009;31:412–424. doi: 10.1016/j.immuni.2009.08.008. [DOI] [PubMed] [Google Scholar]
- 5.van Rijt L.S., Lambrecht B.N. Dendritic cells in asthma: a function beyond sensitization. Clin Exp Allergy. 2005;35:1125–1134. doi: 10.1111/j.1365-2222.2005.02321.x. [DOI] [PubMed] [Google Scholar]
- 6.Hammad H., Lambrecht B.N. Dendritic cells and epithelial cells: linking innate and adaptive immunity in asthma. Nat Rev Immunol. 2008;8:193–204. doi: 10.1038/nri2275. [DOI] [PubMed] [Google Scholar]
- 7.Huh J.C., Strickland D.H., Jahnsen F.L., Turner D.J., Thomas J.A., Napoli S., Tobagus I., Stumbles P.A., Sly P.D., Holt P.G. Bidirectional interactions between antigen-bearing respiratory tract dendritic cells (DCs) and T cells precede the late phase reaction in experimental asthma: DC activation occurs in the airway mucosa but not in the lung parenchyma. J Exp Med. 2003;198:19–30. doi: 10.1084/jem.20021328. [DOI] [PMC free article] [PubMed] [Google Scholar]
- 8.Cahalan M.D., Parker I. Choreography of cell motility and interaction dynamics imaged by two-photon microscopy in lymphoid organs. Annu Rev Immunol. 2008;26:585–626. doi: 10.1146/annurev.immunol.24.021605.090620. [DOI] [PMC free article] [PubMed] [Google Scholar]
- 9.Shakhar G., Lindquist R.L., Skokos D., Dudziak D., Huang J.H., Nussenzweig M.C., Dustin M.L. Stable T cell-dendritic cell interactions precede the development of both tolerance and immunity in vivo. Nat Immunol. 2005;6:707–714. doi: 10.1038/ni1210. [DOI] [PMC free article] [PubMed] [Google Scholar]
- 10.Lindquist R.L., Shakhar G., Dudziak D., Wardemann H., Eisenreich T., Dustin M.L., Nussenzweig M.C. Visualizing dendritic cell networks in vivo. Nat Immunol. 2004;5:1243–1250. doi: 10.1038/ni1139. [DOI] [PubMed] [Google Scholar]
- 11.Chieppa M., Rescigno M., Huang A.Y.C., Germain R.N. Dynamic imaging of dendritic cell extension into the small bowel lumen in response to epithelial cell TLR engagement. J Exp Med. 2006;203:2841–2852. doi: 10.1084/jem.20061884. [DOI] [PMC free article] [PubMed] [Google Scholar]
- 12.Sen D., Forrest L., Kepler T.B., Parker I., Cahalan M.D. Selective and site-specific mobilization of dermal dendritic cells and Langerhans cells by Th1- and Th2-polarizing adjuvants. Proc Natl Acad Sci U S A. 2010;107:8334–8339. doi: 10.1073/pnas.0912817107. [DOI] [PMC free article] [PubMed] [Google Scholar]
- 13.Veres T.Z., Rochlitzer S., Shevchenko M., Fuchs B., Prenzler F., Nassenstein C., Fischer A., Welker L., Holz O., Müller M., Krug N., Braun A. Spatial interactions between dendritic cells and sensory nerves in allergic airway inflammation. Am J Respir Cell Mol Biol. 2007;37:553–561. doi: 10.1165/rcmb.2007-0087OC. [DOI] [PubMed] [Google Scholar]
- 14.Veres T.Z., Shevchenko M., Krasteva G., Spies E., Prenzler F., Rochlitzer S., Tschernig T., Krug N., Kummer W., Braun A. Dendritic cell-nerve clusters are sites of T cell proliferation in allergic airway inflammation. Am J Pathol. 2009;174:808–817. doi: 10.2353/ajpath.2009.080800. [DOI] [PMC free article] [PubMed] [Google Scholar]
- 15.Niess J.H., Brand S., Gu X., Landsman L., Jung S., McCormick B.A., Vyas J.M., Boes M., Ploegh H.L., Fox J.G., Littman D.R., Reinecker H.C. CX3CR1-mediated dendritic cell access to the intestinal lumen and bacterial clearance. Science. 2005;307:254–258. doi: 10.1126/science.1102901. [DOI] [PubMed] [Google Scholar]
- 16.von Garnier C., Wikstrom M.E., Zosky G., Turner D.J., Sly P.D., Smith M., Thomas J.A., Judd S.R., Strickland D.H., Holt P.G., Stumbles P.A. Allergic airways disease develops after an increase in allergen capture and processing in the airway mucosa. J Immunol. 2007;179:5748–5759. doi: 10.4049/jimmunol.179.9.5748. [DOI] [PubMed] [Google Scholar]
- 17.Ng L.G., Hsu A., Mandell M.A., Roediger B., Hoeller C., Mrass P., Iparraguirre A., Cavanagh L.L., Triccas J.A., Beverley S.M., Scott P., Weninger W. Migratory dermal dendritic cells act as rapid sensors of protozoan parasites. PLoS Pathog. 2008;4:e1000222. doi: 10.1371/journal.ppat.1000222. [DOI] [PMC free article] [PubMed] [Google Scholar]
- 18.Förster R., Davalos-Misslitz A.C., Rot A. CCR7 and its ligands: balancing immunity and tolerance. Nat Rev Immunol. 2008;8:362–371. doi: 10.1038/nri2297. [DOI] [PubMed] [Google Scholar]
- 19.Holt P.G., Strickland D.H., Wikström M.E., Jahnsen F.L. Regulation of immunological homeostasis in the respiratory tract. Nat Rev Immunol. 2008;8:142–152. doi: 10.1038/nri2236. [DOI] [PubMed] [Google Scholar]
- 20.Jahnsen F.L., Strickland D.H., Thomas J.A., Tobagus I.T., Napoli S., Zosky G.R., Turner D.J., Sly P.D., Stumbles P.A., Holt P.G. Accelerated antigen sampling and transport by airway mucosal dendritic cells following inhalation of a bacterial stimulus. J Immunol. 2006;177:5861–5867. doi: 10.4049/jimmunol.177.9.5861. [DOI] [PubMed] [Google Scholar]
- 21.Hintzen G., Ohl L., del Rio M- L., Rodriguez-Barbosa J.-I., Pabst O., Kocks J.R., Krege J., Hardtke S., Förster R. Induction of tolerance to innocuous inhaled antigen relies on a CCR7-dependent dendritic cell-mediated antigen transport to the bronchial lymph node. J Immunol. 2006;177:7346–7354. doi: 10.4049/jimmunol.177.10.7346. [DOI] [PubMed] [Google Scholar]
- 22.Jakubzick C., Tacke F., Llodra J., van Rooijen N., Randolph G.J. Modulation of dendritic cell trafficking to and from the airways. J Immunol. 2006;176:3578–3584. doi: 10.4049/jimmunol.176.6.3578. [DOI] [PubMed] [Google Scholar]
- 23.Hammad H., Chieppa M., Perros F., Willart M.A., Germain R.N., Lambrecht B.N. House dust mite allergen induces asthma via Toll-like receptor 4 triggering of airway structural cells. Nat Med. 2009;15:410–416. doi: 10.1038/nm.1946. [DOI] [PMC free article] [PubMed] [Google Scholar]
Associated Data
This section collects any data citations, data availability statements, or supplementary materials included in this article.
Supplementary Materials
Steady-state motility of DCs in the mucosa of the main conducting airways (low-magnification overview). A section preparation from the lungs of a CD11c-EYFP mouse was labeled with SNARF-1 to visualize the airway epithelium (red) together with CD11c-EYFP+ DCs (yellow). Note the probing movements of the epithelial, dendritiform cells. Video shows projections of Z-stacks recorded every minute over 1 hour. Time is shown in the format hh:mm:ss. Scale bar = 100 μm.
Epithelial and subepithelial DCs show different patterns of motility. This video corresponds to Figure 3B and shows the motility of DCs (yellow) in relation to the bronchial epithelium (red) in a section preparation, recorded over 2 hours. Projections were generated along the z-axis (top view) and along the x- and y-axes (side views). One dendritiform DC, located just beneath the epithelium, shows extensive probing movements in a lateral direction, whereas its centroid slowly crawls toward the bottom right corner of the image. In contrast, amoeboid DCs located in the deeper layers of the mucosa display a fast random migration without probing behavior. The area marked by yellow crosshairs in each view was used for generating the respective projection. Time is shown as hh:mm:ss.ms. Scale bar = 70 μm.
DC motility within the mucosa of the peripheral airways. This video corresponds to Figure 3, C and D, showing the motility of DCs (yellow) beneath the epithelium (red) in a small-diameter bronchus, recorded over 1 hour using a section preparation. Second harmonic signals (generated by collagen fibers) are shown in blue. Projections were generated along the z-axis (top view) and along the x- and y-axes (side views). Two epithelial dendritiform DC, located in the top right and bottom left corners of the XY image, are sessile but show extensive lateral probing movements. Time is shown as hh:mm:ss. Scale bar = 50 μm.
DC motility within the tracheal mucosa in vivo. Video shows the motility of DCs (yellow) beneath the epithelium (red) of the trachea, recorded over 40 minutes via intravital microscopy. Projections were generated along the z-axis (top view) and along the x- and y-axes (side views). Similarly, as observed in section preparations, epithelial DCs are sessile and display probing behavior with their long processes, whereas amoeboid cells in the deeper layers of the tracheal mucosa randomly migrate without probing movements. Time is shown as hh:mm:ss. Scale bar = 50 μm.
Projection of transepithelial extensions. This video corresponds to Figure 4 and shows a DC (yellow) with a long, thin cellular extension penetrating across the epithelial layer (red) and reaching out into the airway lumen. Projections were generated along the z-axis (top view) and along the x- and y-axes (side views). Time is shown as hh:mm:ss. Scale bar = 50 μm.
Projection of transepithelial extensions. Video shows a DC (yellow, in the middle of the field of view) with thin cellular extension penetrating the epithelial layer (red) and stretching out toward the airway lumen. Projections were generated along the z-axis (top view) and along the x- and y-axes (side views). Time is shown as hh:mm:ss. Scale bar = 50 μm.
DC motility after aeroallergen challenge. CD11c-EYFP mice were sensitized to OVA/Al(OH)3 i.p. on days 0, 14, and 21 and exposed to OVA aerosol on day 27 (OVA/OVA group). Controls received PBS/Al(OH)3 i.p. and received OVA aerosol, respectively (PBS/OVA group). On day 28, DC motility in lung sections was visualized using two-photon microscopy. Videos show the motility of DCs (yellow) beneath the epithelium (red) of the main conducting airways in sham-sensitized (PBS/OVA) and OVA-sensitized (OVA/OVA) animals. Projections were generated along the z-axis (top view) and along the x- and y-axes (side views).