

Abstract
Diabetic retinopathy is associated with ocular inflammation, leading to retinal barrier breakdown, macular edema, and visual cell loss. We investigated the molecular mechanisms involved in microglia/macrophages trafficking in the retina and the role of protein kinase Cζ (PKCζ) in this process. Goto Kakizaki (GK) rats, a model for spontaneous type 2 diabetes were studied until 12 months of hyperglycemia. Up to 5 months, sparse microglia/macrophages were detected in the subretinal space, together with numerous pores in retinal pigment epithelial (RPE) cells, allowing inflammatory cell traffic between the retina and choroid. Intercellular adhesion molecule–1 (ICAM-1), caveolin-1 (CAV-1), and PKCζ were identified at the pore border. At 12 months of hyperglycemia, the significant reduction of pores density in RPE cell layer was associated with microglia/macrophages accumulation in the subretinal space together with vacuolization of RPE cells and disorganization of photoreceptors outer segments. The intraocular injection of a PKCζ inhibitor at 12 months reduced iNOS expression in microglia/macrophages and inhibited their migration through the retina, preventing their subretinal accumulation. We show here that a physiological transcellular pathway takes place through RPE cells and contributes to microglia/macrophages retinal trafficking. Chronic hyperglycemia causes alteration of this pathway and subsequent subretinal accumulation of activated microglia/macrophages.
Diabetic retinopathy (DR), a complication of long-term diabetes, is the main cause of blindness in young adults.1 The retina is a site of microvascular complications of diabetes, including loss of pericytes and increased vascular permeability, microvascular occlusions, ischemia, and neovascularization. At present, vision loss results mostly from macular edema, which is associated with breakdown of retinal barriers and with photoreceptor dysfunction and/or loss.2,3 It has also been clearly established that immune imbalance and local inflammation4,5 participate in pathogenic events during the course of diabetes,5 contributing to the loss of photoreceptors and visual impairment.
The inner blood–retinal barrier is formed by tight junctions between vascular endothelial cells, whereas the outer retinal barrier is specific to the eye and consists of the tight junction present in a monolayer epithelium, the retinal pigment epithelial (RPE) cells. The apical side of RPE faces the photoreceptor outer segments of the neuroretina, and the basolateral side lies on Bruch's membrane, which separates the RPE from the fenestrated endothelium of the choriocapillaris.6 The RPE is a selective exchange platform between the systemic circulation and the retina, and the subretinal space between RPE and the neuroretina is considered as an immune-privileged site.5 Microglial cells, the main resident sentinel immune cells, are located in the inner part of the retina, around vessels in the healthy retina.7–12 These cells become activated and migrate in the subretinal space in several retinopathies such as diabetic retinopathy,13,14 age-related macular degeneration,15 and aging.5,16,17 The activation of microglia induced by hyperglycemia has been associated with the early development of DR. Indeed, it has been reported that, under diabetic conditions, retinal microglia activation occurs as early as electroretinographic modifications.18,19 Cytokines, released by activated microglia, among other cells, were shown to contribute to neuronal cell death.20–22
Taken together, these findings have raised the hypothesis that activated displaced microglial cells might have a pathogenic role in the time course of DR.
One of critical steps in the inflammatory response is the rapid recruitment and migration of immune and inflammatory cells to inflammatory sites without compromising the integrity of the barriers. This migration process is orchestrated by the combined action of caveolin-1 (CAV-1) and intercellular adhesion molecule–1 (ICAM-1), which facilitate inflammatory cells transcellular migration through endothelial cells.23–25 Caveolin-1 expression also determines the route of neutrophil extravasation through skin microvasculature and knockdown of Caveolin-1 decreases transcellular migration.26
Chronic hyperglycemia also causes oxidative stress that results in the activation of the atypical protein kinase Cζ (PKCζ), which controls the activity of the transcription factor NF-κB and regulates the expression of inducible nitric oxide synthase (iNOS), cyclooxygenase 2 (COX-2), and ICAM-1, thus controlling vascular permeability and leukostasis.19,27–29
We have previously shown27 that PKCζ is expressed in ocular macrophages in a rat model of ocular inflammation, and that the specific local inhibition of PKCζ reduced retinal vascular leakage, iNOS expression in infiltrating cells, and ocular cytokine production.27 Overexpression of iNOS has also been found in retinas of diabetic rodents and human patients.30–35
In the present study, we investigated microglia/macrophages retinal activation and trafficking during diabetes using Goto Kakizaki (GK) rats. The GK rat is a Wistar nonobese model developing spontaneous type 2 diabetes. These rats represent a suitable model to study the early phases of inflammation during time course of DR without toxic effects of diabetogenic drugs such as streptozotocin.
We show, for the first time, the presence of pores in the RPE similar to those described as transcellular pathway for lymphocytes in the vascular endothelium.23,36,37 The effect of hyperglycemia on this RPE pathway and microglial subretinal migration was evaluated in GK rats.
Materials and Methods
Animals
The animals used in this work were treated in accordance with the Association for Research in Vision and Ophthalmology (ARVO). Experimental procedures were submitted to and approved by the ethics committee of Paris Descartes University.
GK rats (Taconic Europe, Ejby, Denmark), comprising a Wistar nonobese model of non–insulin-dependent type 2 diabetes, were used at different ages of hyperglycemia. Glycemia was measured using Accutrend GC and Accu-check compact equipments (Roche) and plasma glucose >250 mg/dl was considered as indicating a diabetic state. GK diabetic rats had hyperglycemia from 14 weeks after birth to the time that they were euthanized, as compared with controls, as shown in Table 1. Controls were selected from age-matched nondiabetic rats with plasma glucose <150 mg/dl.
Table 1.
Weight and Blood Glucose Concentration in Normoglycemic Control and Hyperglycemic Diabetic Goto Kakizaki (GK) Rats
| Control rats |
Diabetic rats |
|||||
|---|---|---|---|---|---|---|
| 2 months | 5 months | 12 months | 2 months | 5 months | 12 months | |
| No. of rats (n) | 7 | 12 | 59 | 7 | 12 | 59 |
| Weight (g) | 163 ± 4 | 212 ± 10 | 341 ± 7 | 252 ± 14 | 305 ± 15 | 387 ± 15 |
| Blood glucose level (mg/dL) | 110 ± 6 | 114 ± 12 | 134 ± 5 | 286⁎ ± 7 | 348⁎ ± 10 | 403⁎ ± 12 |
Values are expressed as the mean ± SEM.
P < 0.05, control versus diabetic rats.
IHC on Cryostat Ocular Sections and on Flat Mounts of Retina or RPE/Choroids
Immunohistochemistry (IHC) was used to identify microglia/macrophages and proteins involved in transcellular pathways at 2, 5, and 12 months.
For sections, rat eyes were enucleated and postfixed in 4% paraformaldehyde and cryoprotected using sucrose. They were embedded in optimal cutting temperature (OCT) compound (Tissue-Tek; Miles Inc., Bayer Diagnostics, Puteaux, France), frozen in liquid nitrogen, and stored at −80°C. Cryostat frozen sections (10-μm thick; Leica CM 3050S, Wetzlar, Germany) were made and mounted on gelatin-coated slides for immunohistochemical analysis (n = 7 per group).
For flat mounts, rat eyes were enucleated, fixed in 4% paraformaldehyde (PFA) for 15 minutes at room temperature, and sectioned at the limbus; the anterior segments were discarded. Retinas and choroids were fixed separately for additional 15 minutes in acetone at −20°C. Specimens were incubated overnight at 4°C with primary antibodies diluted in PBS supplemented with 10% fetal calf serum (FCS) and 0.1% Triton X-100 (n = 9 per group).
Antibodies
Primary antibodies used were as follows: rabbit polyclonal anti–caveolin-1 (3238; dilution 1:200; Cell Signaling Saint Quentin Yvelines, France); rabbit polyclonal anti-occludin (71–1500; dilution 1:200; Zymed, San Francisco, CA); mouse monoclonal anti-PKCζ (ab57432; dilution 1:400; Abcam, Cambridge, UK) raised against to amino acid 165–255 specific to the N-terminal region of the human PKCζ sequence; mouse monoclonal anti–ICAM-1 (MCA773; dilution 1:200; Serotec, Oxford, UK); rabbit polyclonal anti-ionized calcium binding adaptor molecule 1, anti–IBA-1, a specific marker for microglia/macrophages (dilution 1:400; Wako, Richmond, VA); mouse monoclonal iNOS (sc-7271; dilution 1:75; Santa Cruz Biotechnology, CA); mouse monoclonal antiglial fibrillary acidic protein-Cy3 (C9205; dilution 1:200; Sigma-Aldrich, St. Louis, MO); and Rhodamine Phalloidin (R415; dilution 1 :400) and anti–zonula-occludens–1 (ZO-1; sc-10804; dilution 1:100; Santa Cruz Biotechnology, Santa Cruz, CA). The corresponding Alexa secondary antibodies (Invitrogen Life Technology, Carlsbad, CA) were used to reveal the primary antibodies, and sections were counterstained with DAPI (Sigma-Aldrich).
Sections and flat mounts were viewed with a fluorescence microscope (BX51; Olympus, Rungis, France) and confocal microscope (Zeiss LSM 510 laser scanning microscope; Carl Zeiss, Le Pecq, France). Three dimensional reconstruction and projection of Z-stacks was performed with Zen 2009 LE software (Carl Zeiss). Images were then treated by Adobe Photoshop CS4 (Adobe, San Jose, CA) for preparation of final images.
All immunostainings were repeated at least three times, and staining that omitted the primary antibody served as negative control.
Western Blot Analyses
Proteins were extracted from five neuroretinas and RPE/choroids from GK rats at 2, 5, and 12 months of hyperglycemia and from controls. Proteins were homogenized in lysis buffer (10 mmol/L Tris-HCl, pH 7.5, 1 mmol/L EDTA, 1 mmol/L EGTA, 150 mmol/L NaCl, 0.5% Nonidet P40, 1% Triton X-100, and β-mercaptoethanol) containing a protease inhibitor cocktail (Roche, France). Protein concentration was determined using a Bradford assay. Proteins (40−50 μg) were subjected to sodium dodecyl sulfate–polyacrylamide gel electrophoresis (SDS-PAGE) in a 12% SDS-PAGE and electroblotted onto nitrocellulose membranes (Schleicher and Schuell BioScience, Dassel, Germany). Membranes were incubated with the following: anti-PKCζ mouse monoclonal antibody (ab57432) raised against amino acid 165–255 of the N-terminal region of the human PKCζ sequence (dilution 1:400); rabbit polyclonal anti–p-PKCζ (Thr 560; ab59412; dilution 1:200; Abcam, Cambridge, UK); rabbit polyclonal anti–p-PKCζ (Thr 410; SC-12894-R; dilution 1:400) and rat anti–β-tubulin (SC-5274; dilution 1:400; Santa Cruz Biotechnology, Santa Cruz, CA); rabbit polyclonal anti–caveolin-1 (#3238; dilution 1:400; Cell Signaling, Saint Quentin Yvelines, France); mouse monoclonal anti–ICAM-1 (MCA773; dilution 1:400; Serotec, Oxford, UK). Membranes were then incubated with the corresponding secondary antibodies: peroxidase conjugated F(ab)2 fragment (Caltag, Burlingame, CA). Immunoreactive bands were detected with the ECL Western Blotting Detection Reagents Kit (Amersham Biosciences, Orsay, France). The relative abundance of individual proteins identified was quantified by scanning densitometry. The relative band intensity of CAV-1 and ICAM-1 was calculated in comparison to that of β-tubulin after densitometry analysis. For the phosphorylated PKCζ Thr 410 and Thr 560, the relative band intensity was calculated in comparison to nonphosphorylated PKCζ after densitometry analysis using Adobe Photoshop software.
Intravitreal Injection of PKCζi
Rats were anesthetized with intramuscular injection of ketamine (88 mg/kg; Virbac, Carros, France) and chlorpromazine (Largactil, 0.6 mg/kg; Sanofi-Aventis, Paris, France).
Pupils were dilated by instillation of 1 drop of 5% tropicamide (Ciba Vision, Toulouse, France) and 1 drop of 1% tetracaine (Ciba Vision) was administered for local anesthesia. Under a surgical microscope, an intravitreal injection of 4 μl of either sterile pyrogen-free saline or PKCζi was performed using a sterile syringe and 30-gauge needle (Microfine; Becton Dickinson, Meylan, France). The needle was left in the eye for 10 seconds to allow aqueous humor to leave the eye via the trabecular meshwork rather than by reflux along the needle track. The injection was performed near the apex of the cornea, taking care not to damage the iris or the lens.
For inhibitory experiments, we injected PKCζi into the vitreous (4 μl, 0.15 μmol/L in PBS; myr-SIYRRGARRWRKL; ref. 539624 from Calbiochem, San Diego, CA) of 12-month-old diabetic GK rats and their controls (n = 15 per group). Rats were euthanized 48 hours after PKCζi injection, and eyes were used for western blots (n = 5/n = 5).
For IHC on sections (n = 7/n = 5) and on flat mounted tissues (n = 9/n = 5), we performed intravitreous injections (3 μl, 0.15 μmol/L in PBS) of a fluorescent peptide 5-carboxytetramethylrhodamine (5-TAMRA) conjugated with the PKCζi (myr-K-(5-TAMRA)-SIYRRGARRWRKL) or nonsense peptide: (myr-K-(5-TAMRA)-RIRRSGARLRYKW) (Proteogenix, France) in 12-month-old diabetic GK rats and their controls (n = 15 per group).
Intravitreal Injection of Rh-Lip
We have previously shown that after intravitreous injection, rhodamine-conjugated liposomes were internalized in microglia.38 To study the intraocular distribution of microglia, we injected 3 μl of cationic DOTAP/DOPE/PE-Rhodamine liposomes into the vitreous body of control and 5-month-old diabetic rats (n = 3). Cationic DOTAP/DOPE/PE-Rhodamine liposomes were prepared as follows. Briefly, the lipids (1,2-dioleoyl-3-trimethylammonium-propane (DOTAP), 1,2-dioleoyl-sn-glycero-3-phosphoethanolamine (DOPE) and rhodamine-phosphatidylethanolamine (PE-Rhodamine) dissolved in chloroform were mixed to reach a final lipid mass ratio of 5.0: 4.7: 0.3 respectively. The chloroform was evaporated under vacuum and the resulting lipid film was hydrated with milliQ water to a final concentration of 1 mg/mL. Liposomes containing 3% PE-Rhodamine were <450 nm and exhibited positive zeta potential values greater than +50 mV (greater than or equal to +70 mV).
Quantification of Activated Microglia/Macrophages in the Neuroretina
Round IBA-1–stained cells were counted on neuroretina flat mounts from control or 12-month-old diabetic rats injected with saline or with PKCζi (n = 3 rats per group and 4 areas per eye). The cell number was expressed as the mean number of round activated IBA-1–positive cells/mm2.
Quantification of Microglia/Macrophages Infiltrating the Eye
Microglia/macrophages (IBA-1–stained cells) were counted on cryostat sections in retina from control or 12-month-old diabetic rats injected with saline or with PKCζi (n = 7 rats per group and 12 sections per eye). For this quantification, two areas were chosen on each section: the inner retina ie, from the ganglion cell layer (GCL) to the outer plexiform layer and the outer retina, i.e., from the outer nuclear cell layer to the RPE, as shown in Figure 1A. The cell number was expressed as the mean number of IBA-1–positive cells/retinal sections.
Figure 1.
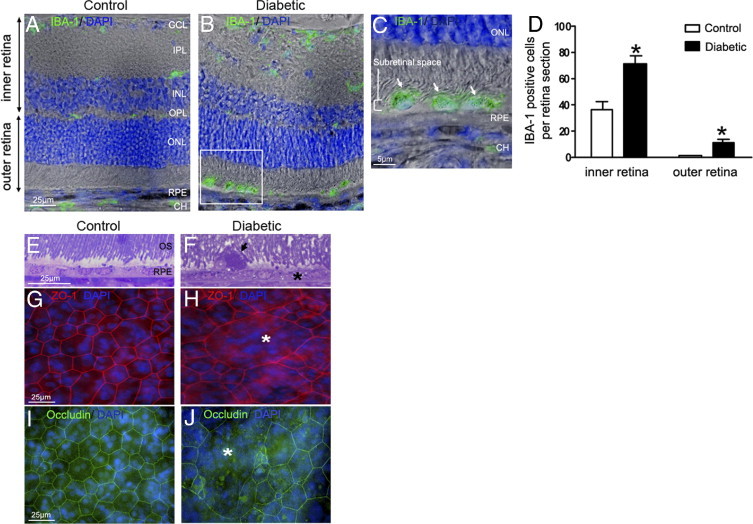
Microglia/macrophages accumulation in the subretinal space of GK rats after 12 months of hyperglycemia. A–C: Retinal sections immunostained with IBA-1 antibody (green) and DAPI (blue) associated with phase contrast. In 12-month-old control rats, IBA-1–positive cells are located exclusively in the inner retina (A). After 12 months of hyperlycemia in GK rats, numerous IBA-1–positive cells are observed in the inner retina and in the subretinal space (B and C; arrowhead and inset). Scale bars: 25 μm (A and B); 5 μm (C). D: Cellular counts of IBA-1–positive cells on cryostat sections of the retina showed a significant increase of their number in the inner retina (1.9-fold) and subretinal space (7.6-fold) in 12-month hyerglycemic rats versus control rats (n = 7 eyes per group). *P < 0.5. E and F: Toluidine blue–stained semithin sections shows vacuolization of RPE cells (asterisk), and presence of a large subretinal cell (arrowhead, F), detected between disorganized outer segments of photoreceptors (OS) in 12-month hyperglycemic GK rats as compared with controls (E). G, H, I, and J: RPE flat mounts stained with Zonula-occludens–1 (ZO-1) (red), occludin (green), and DAPI (blue). In controls, ZO-1 and occludin labeled the regular hexagonal membrane of RPE cells (G and I), whereas in diabetic conditions (12 months of hyperglycemia), we observed some enlarged RPE cells (asterisk) with irrregular ZO-1 and occludin labeling (H and J) showing loss of junctions. Scale bar: 25 μm (A–G). CH = choroid; GCL = ganglion cell layer; INL = inner nuclear layer; IPL = inner plexiform layer; ONL = outer nuclear layer; OPL = outer plexiform layer; OS = outer segment of photoreceptors; RPE = retinal pigmented epithelium.
Quantification and Criteria to Identify Transcellular Pores
A transcellular pore was identified by three dimensional analyses as a circular intracytoplasmic structure, delineated by PKCζ, ICAM-1, CAV-1, and actin fluorescence in both the x–y and the z dimensions. With these criteria, quantification of transcellular pores was performed on nine eyes per experiment on whole flat mount of RPE from 2-, 5-, and 12-month-old GK diabetic rats and their controls. The number of transcellular pores was expressed as the mean number of pores/whole flat mount.
Semithin and Ultrathin Sections
Eyes were fixed for 1 hour in 2.5% glutaraldehyde in cacodylate buffer (0.1 mol/L, pH 7.4). Eyes were dissected, fixed for 3 hours, postfixed in 1% osmium tetroxide in cacodylate buffer, and dehydrated in graduated ethanol solutions. Samples were included in epoxy resin and oriented. Semithin sections [1 μm, ultra microtome Reichert Ultracut E (Leica)], were stained by toluidine blue. Ultrathin sections (80 nm) were contrasted by uranyl acetate and lead citrate and were observed with an electron microscope JEOL 100 CX II (JEOL) with 80 kV.
Statistical Analysis
Values are expressed as mean ± SEM. Student's t test was used when comparing two groups or using the nonparametric Mann–Whitney U test when comparing three or more groups (Prism software version 4.0c; GraphPad Software, San Diego, CA). Statistical significance was accepted at a P value <0.05.
Results
Subretinal Accumulation of Microglia/Macrophages and Alteration of RPE in Diabetic Rats After 12 Months of Hyperglycemia
To compare the distribution of microglia/macrophages in retina from diabetic rats versus controls, IBA-1, a specific marker for microglia and macrophages, was used on retinal sections. In control rats, microglia/macrophages are located exclusively in the inner retinal layers (INL) around vessels and in the choroid but no IBA-1–positive cells are detected in the outer retina or in the subretinal space (Figure 1A). By contrast, after 12 months of hyperglycemia in GK rats, numerous IBA-1–positive cells are found all over the retina and in the subretinal space between outer segment and RPE cells (Figure 1,B (inset for higher magnification) and C). When counting the number of IBA-1–positive cells, we found that it was significantly increased after 12 months of diabetes, in the inner and outer layers of the retina (Figure 1D; see also Supplemental Figure S1 at http://ajp.amjpathol.org). On semithin sections of the retina, cells were identified in the subretinal space of GK rats (Figure 1F) between disorganized outer segments of photoreceptors and the vacuolized RPE.
To better visualize RPE morphology, tight junctions were stained with Zonula-occludens-1 (ZO-1) and occludin on RPE/choroid flat mounts. In controls, ZO-1 and occludin labeled the regular hexagonal membrane of RPE cells (Figure 1, G and I) whereas in 12 months hyperglycemic GK rats, we observed enlarged RPE cells with irregular ZO-1 and occludin labeling (Figure 1, H and J) suggesting alteration of cell junctions. After 5 months of diabetes, no such alterations were observed (see below), indicating that RPE barrier breakdown depends on the duration of diabetes.
Transepithelial Pores Are Evident in RPE Cells of Diabetic Rats
To visualize both microglia/macrophages and the pores, RPE flat mounts from 5-month hyperglycemic GK rats were used. We observed significant F-actin remodeling, with a central actin ring forming a “pore” in some RPE cells, with apparent maintenance of cell membrane integrity (Figure 2B) compared with the control (Figure 2A). Semithin sections of these flat mount areas showed a focal cytoplasmic invagination toward the choroid at the level of the pore (Figure 2C). On electron microscopy sections, the RPE nucleus appeared unchanged and a pore was observed in the center of the cell. In the vicinity of the invaginated RPE, capillaries in the choroid had vertical orientation (Figure 2D). The expression and co-localization of CAV-1 and ICAM-1 around the pore in RPE are clearly shown in (Figure 2, E–G), supporting the hypothesis that a transcellular pathway is present in the RPE of diabetic rats.
Figure 2.
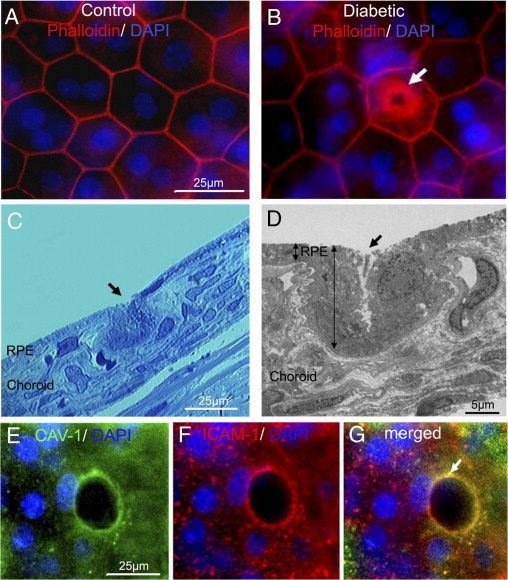
ICAM-1, CAV-1 expression, actin recruitment, and cell invagination strongly suggest the presence of a transcellular pore in diabetic RPE. A and B: RPE flat mount from 5 months hyperglycemic GK rat stained by phalloidin (red) and DAPI (blue) showing a central intracytoplasmic actin ring (arrow) (B), that is not observed in age-matched control rat retinas (A). Scale bar: 25 μm (A and B). C and D: Semi-thin sections (C) and ultra-thin sections (D) of the pore area visualized by actin in B show invagination of the RPE cells from the apical toward the basal part (arrows), highlighting the direction of the pore formation in the RPE (C and D). On ultrathin section, cell nucleus is preserved, displaced laterally by a pore formation in the cell (D). Scale bars: 25 μm (C); 5 μm (D). E and F: Triple staining by CAV-1 (green), ICAM-1 (red), and DAPI (blue) shows colocalization of CAV-1 and ICAM-1 surrounding the pore with preserved nucleus on the edge of the cell (arrow) (G). Scale bar: 25 μm (E and F).
Because it has been reported that CAV-1 interacts with PKC,39 particularly PKCζ, which is known to play a major role in tight junction formation, we investigated whether this protein kinase could participate in pore protein complexes. Therefore we studied in parallel the expression and localization of PKCζ.
In RPE from control rats, PKCζ was located in the cytoplasm and partly co-localized with occludin at the tight junctions (Figure 3A). By contrast, in 5-month diabetic rats, although cell–cell junctions were not yet altered at this time point, PKCζ clearly delineated the pore in RPE cells (Figure 3B). Confocal microscopy observation showed that the apical (Figure 3C) and basal (Figure 3D) side of the pore were stained by anti-PKCζ and the tight junctions stained with anti-occludin antibodies, demonstrating that the pores crossed the whole-cell thickness without altering tight junctions.
Figure 3.
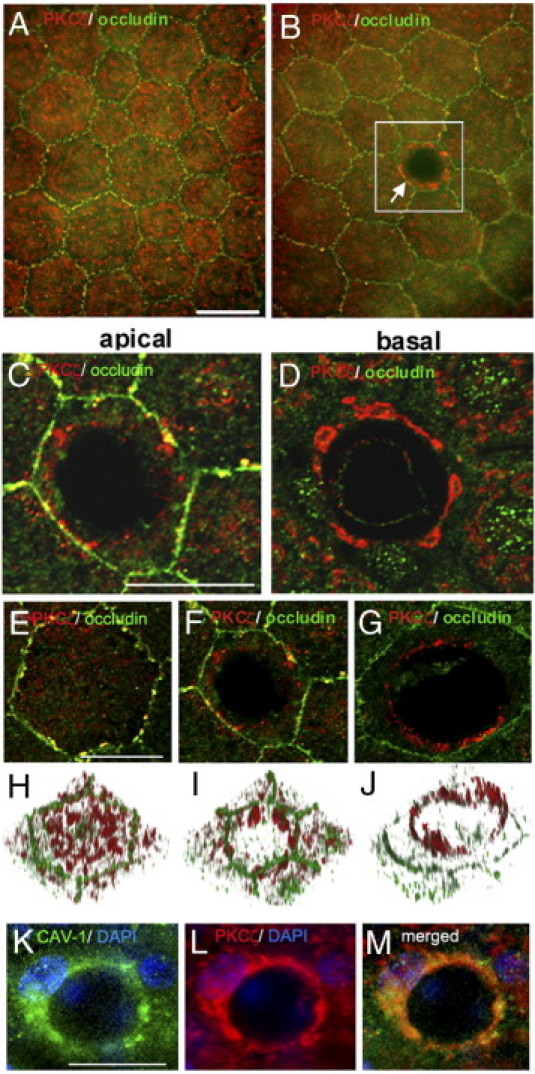
Involvement of PKCζ in the pore formation. A–G: Double staining of RPE flat mounts from 5 months of hyperglycemia in GK rats by PKCζ (red) and occludin (green). In control rats, cytoplasmic and membrane PKCζ localization is shown (A). Under diabetic conditions, PKCζ labeling delineates the pore in the center of RPE cell (arrow). RPE cell junctions are not altered (B). Scale bar: 25 μm (A and B). C and D: Higher magnification of confocal images from apical (C) and basal (D) sides of the RPE cell from the inset in B. Scale bar: 25 μm (C and D). E–G: Double staining of RPE flat mounts from 5-month-old GK rats with PKCζ antibody (red) and occludin antibody (green). Higher magnification of confocal images from apical side of RPE cell, from control (E) and diabetic (F and G) rats. Scale bar: 25 μm (E–G). H–J: 3D imaging corresponding to the top view projection of all z-series sections of RPE cell imaged in E, F, and G confirmed the distribution of PKCζ around the pore crossing the cell from the apical to the basal side. K–M: Triple staining of RPE flat mount from 5-month hyperglycemic diabetic rat by CAV-1 (green), PKCζ (red), and DAPI (blue) shows colocalization of CAV-1 and PKCζ around the pore. Scale bar: 25 μm (K–M).
Confocal microscopy combined with 3D imaging of RPE flat mounts from control rats (Figure 3, E and H) or diabetic rats (Figure 3, F, G, I, and J) allowed scanning of the whole RPE thickness from the apical side toward the baso-lateral side. In control rats (Figure 3, E and H) PKCζ was localized in the cytoplasm and at the membrane, partially co-localized with occludin. In diabetic rats (Figure 3, F, I, G, and H), PKCζ stained the pore from the basal up to the apical side of RPE cells. Furthermore, double staining for CAV-1 and PKCζ (Figure 3, K–M) showed a similar distribution, suggesting that in RPE cells PKCζ, F-actin, ICAM-1 and CAV-1 are component of formed pore.
Pores Are a Transcellular Route for Microglia/Macrophages through the RPE
RPE flat mount GK rats after 5 months of hyperglycemia were studied by confocal scanning microscopy with triple staining for IBA-1/PKCζ/DAPI. Orthogonal images of the RPE monolayer were reconstructed from a stack of confocal sections taken from the apical toward the basal membrane of the RPE layer (Figure 4A). The first Z-sections of the confocal stack analysis highlighted the beginning of the cell process as a green point. We identified IBA-1–positive cells with intact nuclei, inside the whole length of the transcellular pore. Microglia/macrophage transmigration through RPE was also suggested by IBA-1 PKCζ staining (Figure 4B). In parallel, frozen sections prepared from diabetic retina were stained for IBA-1. On transversal sections, we were able to observe IBA-1–positive cells just below the RPE layer (Figure 4, C and D) with some cytoplasmic extensions between RPE cells, indicating that microglia/macrophages may pass through the RPE barrier.
Figure 4.
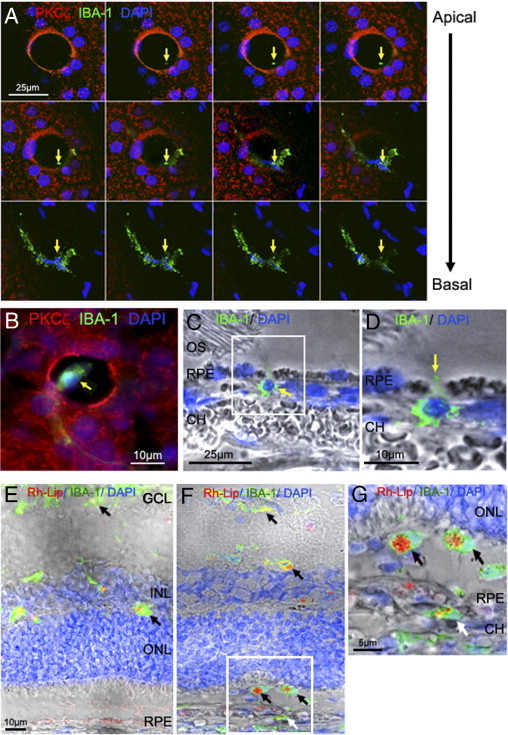
Transcellular migration of microglia/macrophages through RPE pores. A: RPE flat mount from 5-month-old GK rat immunostained with PKCζ (red), IBA-1 (green), and DAPI (blue) and imaged by confocal microscopy. Top view projection of all z-series sections of a representative IBA-1–positive cell (green) in a transcellular pore delimited by PKCζ expression (red). The first Z-sections of the confocal stack analysis highlighted the beginning of the cell process as a green point (arrows). The end Z-sections clearly show a microglia/macrophage within the pore. Scale bar = 25 μm. B: Triple staining of RPE flat mount from 5-month-old diabetic rats by PKCζ (red), IBA-1 (green), and DAPI (blue) show a microglia/macrophage within the pore (arrow). Scale bar: 10 μm. C and D: Sections from 5-month-old GK rat retina immunostained with IBA-1 antibody (green) and DAPI (blue) associated with phase contrast. IBA-1 staining shows a macrophage/microglia passing through the RPE (arrow) (C) and a cytoplasmic extension between 2 RPE cells (arrow) (D). Scale bar: 25 μm (C); 10 μm (D). E–G: Retinal sections 72 hours after intravitreous injection of rhodamine-liposome (Rh-Lip) (red), macrophages/microglia stained by IBA-1 (green). In 5-month-old control rats (E), liposomes are engulfed by IBA-1–positive cells in inner retina (black arrow). At the same age of diabetes in GK rats (F), numerous IBA-1–positive cells having engulfed Rh-Lip are located in the outer retina and subretinal space (black arrows) and under the RPE, in the choroid (white arrow). Higher magnification confirmed that IBA-1–positive cells loaded with Rh-Lip have migrated from the vitreous through the retina and RPE toward the choroid (G). Scale bar: 10 μm (E and F); 5 μm (G). CH = choroid; OS = outer segment of photoreceptor; RPE = retinal pigmented epithelium.
To determine whether microglia/macrophages could exit from retina through RPE barrier, intravitreal rhodamine-liposome (Rh-Lip) injection was performed in control rats (Figure 4E) and diabetic rats (Figure 4, F and G) at 5 months. Rh-Lip were internalized in activated microglia/macrophages identified by IBA-1 staining. Indeed, double-stained Rh-Lip/IBA-1 cells were mainly detected in the inner retina and in the subretinal space (Figure 4F); however IBA-1–positive cells containing Rh-Lip were also observed in the choroid at the basolateral side of RPE, indicating that cells might have migrated from the subretinal space toward the choroid (Figure 4G; see also Supplemental Figure S1 at http://ajp.amjpathol.org).
Pore Density in RPE from Diabetic and Control Rats
RPE pores were quantified in diabetic rats at 2, 5, and 12 months of hyperglycemia and in age-matched controls (Figure 5A). Whereas in control rats the number of pores/mm2 significantly increased from 5 to 12 months, in diabetic rats this number significantly increased from 2 up to 5 months and significantly decreased at 12 months. The reduced number of RPE pores at 12 months in diabetic rats correlated well with the increasing number of subretinal microglia/macrophages at this time point (Figure 1B). The decrease in pores was associated with significant lower expression of CAV-1 and ICAM-1 at 12 months (Figure 5, B and C). Furthermore, expression of PKCζ did not significantly change in diabetic eyes, but its phosphorylated (pThr 410) active form increased during early stages of diabetes (2 and 5 months) and then significantly decreased at 12 months (Figure 5D). At this time point, we observed a lower number of transcellular pores in RPE, suggesting a role for PKCζ in pore processes.
Figure 5.
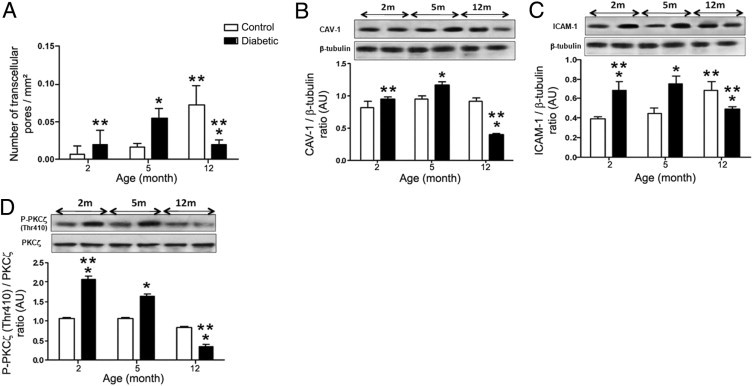
Quantification of the number of pores in RPE cells and CAV-1, ICAM-1, PKCζ expression in the time course of diabetes. A: Quantification of pores as a function of aging in control and diabetic GK rats. In diabetic rats, the density of pores increases with a maximum at 5 months of hyperglycemia (2.8-fold) and then decreases at 12 months (threefold). In control rats, pore density increases significantly only at 12 months (4.4-fold from 5 to 12 months) to reach a higher density compared with old diabetic rats (sevenfold). (n = 9 eyes per group). Number of transcellular pores was expressed as the mean number of pores/whole flat mount. *P < 0.05 versus control; **P < 0.05 versus 5 months. B–D: Western blot analysis for CAV-1 (B), ICAM-1 (C), and P-PKCζ (Thr 410) (D) expression in RPE/choroid from 2-, 5-, and 12-month control and diabetic rats. The ratio of CAV-1/β-tubulin, ICAM-1/β-tubulin, and P-PKCζ(Thr 410)/PKCζ were calculated. In diabetic rats, ICAM-1 and CAV-1 increased significantly during the early phase of diabetes (2 and 5 months of hyperglycemia) and then decreased at 12 months. PKCζ activity evaluated by Thr 410 immunodetection (D) showed the same timing of expression as CAV-1 and ICAM-1. In control rats, ICAM-1 significantly increased at 12 months (C). *P < 0.05 versus control; **P < 0.05 versus 5 months.
Interestingly, in 12-month-old control rats (Figure 5A), pores were observed within RPE cells with maintained amounts of CAV-1, ICAM-1 expression, and activated PKCζ compared with their decrease in diabetic conditions (Figure 5, B–D). Taken together, these data suggest that pores in RPE cells could have a physiological role in microglia trafficking, particularly during aging. During diabetes, the number of pores decreases with aging, leading to accumulation of microglia within the retina.
Intravitreal Injection of the PKCζ Inhibitor in 12-Month-Old Diabetic Rats Deactivates Microglia/Macrophages, Blocks Their Migration, and Impairs Pore Formation
To ascertain that PKCζ activity participated to microglia cells trafficking, both control and diabetic rats at 12 months of hyperglycemia were given one intravitreal injection of PKCζ inhibitor (PKCζi) 48 hours before being euthanized. We first evaluated the distribution of PKCζi conjugated with the fluorochrome (TAMRA) at 48 hours after its intravitreous injection in control and diabetic rats. TAMRA peptides, PKCζi peptide, and its nonsense peptide control penetrated the inner retina as shown by its distribution throughout the retina and particularly in microglia/macrophages (Figure 6, A–D), as shown by IBA-1 co-labeling as well as in RPE cells. When TAMRA-PKCζi was injected into the vitreous of diabetic rats (Figure 6D), microglia/macrophages were not observed in the subretinal space compared with the diabetic rats injected with the nonsense TAMRA-peptide, where microglia/macrophages were clearly observed into the subretinal space (Figure 6B). Moreover, we confirmed that PKCζ activity was reduced in the retina of diabetic rats as evaluated by its autophosphorylation on Thr 560, which decreased 2.5-fold in control rats and 4.4-fold in diabetic rats (Figure 6E).
Figure 6.
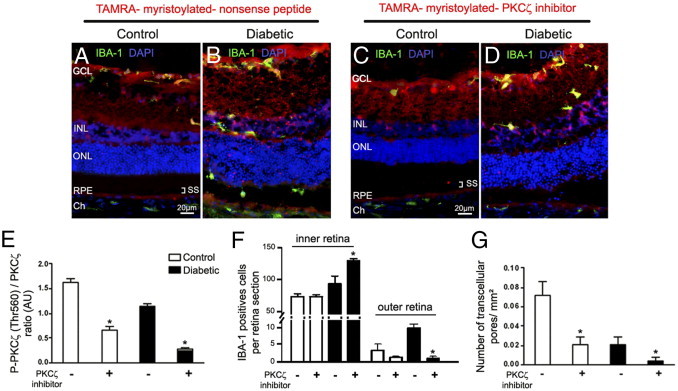
Effects of PKCζ inhibition on retinal microglia/macrophages and pore density. A–D: Myristoylated-PKCζ-inhibitory peptide (C and D) and myristoylated-nonsense-peptide (A and B) conjugated with fluorochrome TAMRA (red) were injected into the vitreous of 12-month-old control (A and C) and hyperglycemic (B and D) GK rats, 48 hours before the rats were euthanized. Retinal sections control (A and C) and diabetic rats (B and D) were immunostained with IBA-1 antibody (green). TAMRA-myristoylated PKCζ inhibitor and nonsense peptide (red) are localized throughout the retina. In diabetic conditions, TAMRA-myristoylated PKCζ inhibitor blocks the mobilization of IBA-1–positive cells in the internal layers of the retina, impeding them from reaching the external layers of the retina compared with those in diabetic rats injected with TAMRA- myristoylated-nonsense peptide (B). GCL = ganglion cell layer; Ch = choroid; INL = inner nuclear layer; ONL = outer nuclear layer; RPE = retinal pigmented epithelium; SS = subretinal space. Scale bar: 20 μmol/L (A–D). E: Proteins from control and diabetic GK rat retinas treated or not treated with PKCζi were analyzed by immunoblotting and quantified for PKCζ autophosphorylation site: phosphorylated PKCζ Thr 560 (n = 5 eyes per group). *P < 0.05 versus without PKCζ inhibitor (PKCζi) injection. F: Quantification of IBA-1–positive cell density in the inner retina and in the subretinal space on retinal sections confirmed that PKCζ inhibition significantly increased the IBA-1–positive cell density in the inner retina of diabetic rats compared with that in controls, whereas reduced their number in the outer retina (n = 7 eyes per group). *P < 0.05 versus without PKCζi injection. Cell number was expressed as mean number of IBA-1–positive cells/retinal sections. G: Pore density was evaluated by counting the number of pores in RPE flat mounts from 12-month hyperglycemic GK diabetic and control rats. The pore density was reduced in older diabetic rats as compared with controls, and PKCζ inhibition significantly decreased the pore density in both cases (n = 9 eyes per group). *P < 0.05 versus without PKCζi injection.
The quantification of microglia/macrophages was performed in the inner retina (GCL, INL) and outer retina (outer nuclear layer and RPE) of control and diabetic rats. Results indicated that intravitreal injection of PKCζi decreased significantly (10-fold) the number of microglia/macrophages in the subretinal space and the outer retina of diabetic rats compared with nontreated diabetic rats (Figure 6F). All of these results show that inhibition of PKCζ activity impaired inflammatory cells migration in the outer retina. Furthermore, inhibition of PKCζ activation significantly reduced pore formation in RPE from treated diabetic and control rats compared with RPE from untreated diabetic and control rats (respectively 5- and 3.5-fold) (Figure 6G).
Microglia are plastic, and their shape is related to their activation state.5,20 Microglia activation state was analyzed on flat mounts of the neuroretina double stained by glial fibrillary acidic protein (GFAP)/IBA-1 (Figure 7, A–H) and iNOS/IBA-1 (Figure 7, J–M). After 12 months of hyperglycemia in GK rats, activated microglial cells are identified as IBA-1–positive round amoeboid-shaped cells, located around blood vessels surrounded by GFAP-stained astrocytes (Figure 7, B and D) compared with the control (Figure 7, A and C). PKCζ inhibition induced a change in microglia morphology in diabetic rats. Microglia showed a resting dendritic shape with long branching processes and a small cellular body (Figure 7H) similar to that observed in control rats (Figure 7G). Quantification of activated microglia was performed by counting ameboid IBA-1–positive cells on neuroretina flat mounts (Figure 7I). The number of activated IBA-1 cells was significantly increased in diabetic rat retinas as compared with controls. The intravitreal injection of PKCζi decreased the number of activated IBA-1 cells in diabetic rats and controls. In addition, in diabetic rats, PKCζ inhibition suppressed iNOS expression in microglia/macrophages cells (Figure 7, K and M) compared with nontreated rats (Figure 7, J and L), suggesting that PKCζ inhibition deactivated microglia/macrophages.
Figure 7.
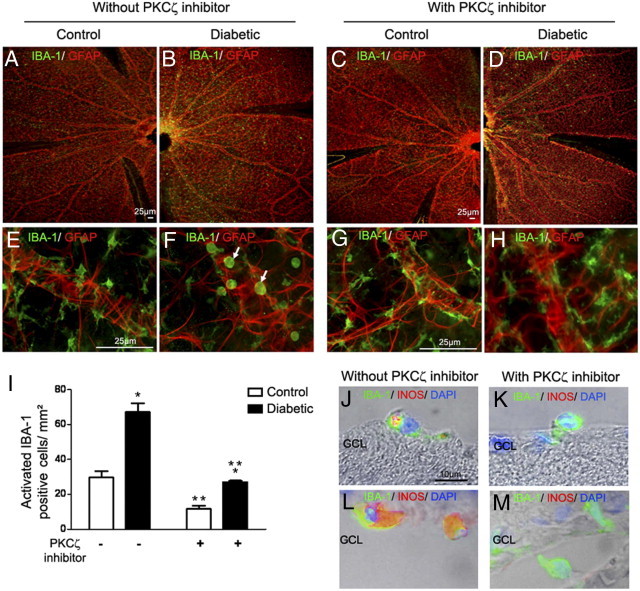
Effects of PKCζ on microglia/macrophages activation.
(A–H) IBA-1 (green) and GFAP (red) immunostaining on whole neuroretina flat mounts from 12-month-old control (A, C, E, and G) or diabetic GK rats (B, D, F, and H). Controls treated with the PKCζ inhibitor (C and G) or not treated (A and E) showed in the retina, microglia with a resting dendritic shape with long branching processes form. By contrast, in diabetic GK rats not treated with PKCζ inhibitor (B and F), microglia showed a round, amoeboid shape (F, arrow), whereas PKCζ inhibition (D and H) induced a change in IBA-1–positive cells morphology, indicating a return to a normal resting microglia (H). Scale bar: 25 μm (A–H). I: Quantification of round activated IBA-1 microglia/macrophages in neuroretina flat mounts. Graph shows the mean number of cells/mm2 counted in four areas in three separate flat mounts. *P < 0.05 versus control; **P < 0.05 versus without PKCζi injection. J–M: Retinal sections from 12-month-old diabetic rats treated or not treated with PKCζ inhibitor. Double staining with IBA-1 antibody (green) and iNOS antibody (red) associated with phase contrast showed that, in diabetic GK rats treated with PKCζ inhibitor (K and M), IBA-1–positive cells do not express iNOS as compared with activated IBA-1–positive cells in diabetic GK rats not treated (J and L). Scale bar = 10 μm. GCL = ganglion cell layer.
Discussion
Low-grade inflammation has been observed in the retinas of diabetic animals and diabetic human patients.14,19,22,30,31,40 In particular, microglial cell activation was found to be an early marker of diabetic changes in different animal models and to potentially release neurotoxic agents at advanced stages of diabetes. Indeed activated microglia produce cytotoxic substances, such as tumor necrosis factor–α (TNF-α), reactive oxygen species, proteases, and excitatory amino acids, which may induce neuronal degeneration.13,22,41 Moreover, activation of microglia has been observed in human retina at different stages of diabetes, with accumulation of microglial cells in the outer retina and subretinal space in case of advanced macular edema.14 However, questions remain regarding the potential beneficial effect of microglia in the time course of DR.
The central question of our study was how, in vivo, in the time course of diabetes, microglia/macrophages cells trafficking is modified leading to subretinal accumulation and potential toxicity. Unexpectedly, we observed that “pores” in RPE cells are formed in old control rat retinas. Such pores are also observed at the early stages of DR, when tight junctions between RPE cells are intact and serve as a migratory pathway for inflammatory cells (microglia/macrophages). At more advanced stages of diabetes (12 months), the number of pores decreases in RPE, paralleling the accumulation of subretinal activated microglia/macrophages.
In the vascular endothelium, it has become increasingly clear that, in addition to the “paracellular” route, a “transcellular” route is used by leukocytes or lymphocytes for migration through the endothelial cell body.23,36,37 However, no such phenomenon has been previously described in epithelia. In our study, we report strong data favoring the hypothesis that a transcellular pathway takes place in RPE cells: i) the identification of “tunnel structures” crossing the whole cell thickness with preserved tight junctions; ii) the recruitment of ICAM-1 and CAV-1 around the pores and the involvement of PKCζ in the pore formation; and iii) the identification of IBA-1–positive cells (microglial resident cells) crossing the RPE through the pore. Presence of microglia/macrophages in the retina of diabetic GK rat could be related to the expression of ICAM-1, which is essential for inflammatory cell migration. In this context, glucose was shown to enhance ICAM-1 expression in a dose-dependent manner.42 Furthermore, in RPE cells of rats presenting with diabetes induced by STZ, an up-regulation of ICAM-1 was reported.43 In addition, transcellular migration of inflammatory cells requires CAV-1 protein.26,44
What is the link between diabetes and RPE transmigration of microglia/macrophages? We have demonstrated that at the early stages of diabetes (5 months of hyperglycemia), a RPE transcellular pathway is functional. Later in the course of diabetes (12 months), decreased ICAM-1 and CAV-1 protein expression in RPE cells and accumulation of subretinal microglia/macrophages are observed, together with significant decrease of the number of RPE pores. At this time point, morphological abnormalities are observed in the outer retina, with RPE vacuolization and loss of junction integrity as well as disorganization of photoreceptor outer segments. We hypothesize that a reduction of this RPE functional pathway could contribute to subretinal microglia/macrophages accumulation along with subsequent RPE and photoreceptor alterations. To ascertain that a migration of cells from the retina toward the choroid could occur through RPE, we injected into the vitreous cationic liposomes containing rhodamine (Rh-Lip). In normal rats, such liposomes injected into the vitreous do not cross the outer retinal barrier and are engulfed by resident or activated macrophages and by RPE cells.38 In 5-month diabetic rats, intense uptake of Rh-Lip is observed in activated microglia, and IBA-1–positive cells containing Rh-Lip were found into the choroid at a time when the RPE tight junctions are preserved further, suggesting that a RPE transcellular pathway is operating.
We show here that PKCζ could be a new actor participating in this process. It was recently reported that inhibition of PKCζ activity prevented the TNF-α-induced ICAM-1 clustering and the early onset of endothelial adhesivity,37 supporting a role for PKCζ in transcellular processes. Activation of the PKCζ/NF-κB signaling pathway induced the transcription of cytokines and the adhesion molecules ICAM-1 and CAV-123 required for inflammatory cell transcellular migration. Blocking PKCζ activity in LPS-induced ocular inflammation led to a decrease in inflammation via the inhibition of PKCζ/NF-κB signaling pathway promoted macrophage survival and deactivation possibly changing the intraocular immune environment.27,45 Besides its role in junction regulation,46,47 PKCζ could also participate in pore formation, as CAV–1 interacts with PKCζ via its scaffolding domain. This may explain the propensity to accumulate PKCζ in caveolae, where it may be directly activated by ceramides contained within such domains.48 Taken together, our results show that a transcellular pathway involving proteins similar to those described in vascular endothelial cells can occur in the outer retinal barrier constituted by RPE cells.
We also show that PKCζ is activated when the pore density is high, and that its activation is significantly reduced when pore density decreases in RPE cells. After intravitreous injection, a specific labeled PKCζ inhibitor (PKCζi) was efficiently phagocytosed by IBA-1–positive cells and by RPE cells. The specific PKCζ inhibition reduced microglia/macrophages migration and activation, as confirmed by lower iNOS production and deactivated cell morphology. Under these conditions of PKCζ inhibition, the subretinal microglia/macrophages accumulation was impaired and the number of RPE cell pores was reduced, demonstrating that PKCζ is involved in microglia/macrophages trafficking during DR. Recentl, it was shown also that PKCζ plays a crucial role in retinal vascular permeability induced by TNF-α, suggesting its possible implication in diabetes-induced blood–retinal barrier breakdown.49
In conclusion, migration of microglia/macrophages through the RPE seems to be a physiological process facilitating cell trafficking between retina and choroid. At an early time point after the development of hyperglycemia in GK rats, the number of RPE pores increased. After longer exposure to hyperglycemia, the number of RPE pores decreased, resulting in subretinal accumulation of activated microglia/macrophages and subsequent retinal damage. Alteration of the transcellular migration pathway could further worsen diabetic-induced photoreceptor death. Intravitreal injection of PKCζi prevented microglia/macrophage subretinal accumulation and activation. Further analyses are required to determine whether targeting microglia/macrophages activation and trafficking is beneficial in diabetic retinopathy.
Acknowledgments
We are grateful to Christophe Klein (UMRS 872 Centre de Recherche des Cordeliers) for technical assistance and Amélie Bochot and Elias Fattal (Paris Sud 11 University, UMR CNRS 8612, Châtenay-Malabry, France) for the gift of rhodamine-liposomes.
Footnotes
This work was supported by the National Institutes of Health and Medical Research; INSERM, by the Fedération des Aveugles et Handicapés Visuels de France (FAF); by the Association CRO; by the Research Center in Ophthalmology; and by the Association Retina France (AFRP).
P.C. and B.O. contributed equally to this work.
Supplemental material for this article can be found at http://ajp.amjpathol.org or at doi:10.1016/j.ajpath.2011.04.018.
Supplementary data
References
- 1.Ciulla T.A., Amador A.G., Zinman B. Diabetic retinopathy and diabetic macular edema: pathophysiology, screening, and novel therapies. Diabetes Care. 2003;26:2653–2664. doi: 10.2337/diacare.26.9.2653. [DOI] [PubMed] [Google Scholar]
- 2.Gardner T.W., Antonetti D.A. Novel potential mechanisms for diabetic macular edema: leveraging new investigational approaches. Curr Diab Rep. 2008;8:263–269. doi: 10.1007/s11892-008-0047-5. [DOI] [PubMed] [Google Scholar]
- 3.Miyamoto N., de Kozak Y., Normand N., Courtois Y., Jeanny J.C., Benezra D., Behar-Cohen F. PlGF-1 and VEGFR-1 pathway regulation of the external epithelial hemato-ocular barrier: A model for retinal edema. Ophthalmic Res. 2008;40:203–207. doi: 10.1159/000119877. [DOI] [PubMed] [Google Scholar]
- 4.Wellen K.E., Hotamisligil G.S. Inflammation, stress, and diabetes. J Clin Invest. 2005;115:1111–1119. doi: 10.1172/JCI25102. [DOI] [PMC free article] [PubMed] [Google Scholar]
- 5.Xu H., Chen M., Forrester J.V. Para-inflammation in the aging retina. Prog Retin Eye Res. 2009;28:348–368. doi: 10.1016/j.preteyeres.2009.06.001. [DOI] [PubMed] [Google Scholar]
- 6.Simo R., Villarroel M., Corraliza L., Hernandez C., Garcia-Ramirez M. The retinal pigment epithelium: something more than a constituent of the blood-retinal barrier—implications for the pathogenesis of diabetic retinopathy. J Biomed Biotechnol. 2010;2010:190724. doi: 10.1155/2010/190724. [DOI] [PMC free article] [PubMed] [Google Scholar]
- 7.Hickey W.F., Kimura H. Perivascular microglial cells of the CNS are bone marrow-derived and present antigen in vivo. Science. 1988;239:290–292. doi: 10.1126/science.3276004. [DOI] [PubMed] [Google Scholar]
- 8.Perry V.H., Gordon S. Macrophages and microglia in the nervous system. Trends Neurosci. 1988;11:273–277. doi: 10.1016/0166-2236(88)90110-5. [DOI] [PubMed] [Google Scholar]
- 9.Streit W.J., Graeber M.B., Kreutzberg G.W. Functional plasticity of microglia: a review. Glia. 1988;1:301–307. doi: 10.1002/glia.440010502. [DOI] [PubMed] [Google Scholar]
- 10.Lassmann H., Schmied M., Vass K., Hickey W.F. Bone marrow derived elements and resident microglia in brain inflammation. Glia. 1993;7:19–24. doi: 10.1002/glia.440070106. [DOI] [PubMed] [Google Scholar]
- 11.Ling E.A., Wong W.C. The origin and nature of ramified and amoeboid microglia: a historical review and current concepts. Glia. 1993;7:9–18. doi: 10.1002/glia.440070105. [DOI] [PubMed] [Google Scholar]
- 12.Ling E.A. Monocytic origin of ramified microglia in the corpus callosum in postnatal rat. Neuropathol Appl Neurobiol. 1994;20:182–183. [PubMed] [Google Scholar]
- 13.Zeng X.X., Ng Y.K., Ling E.A. Neuronal and microglial response in the retina of streptozotocin-induced diabetic rats. Vis Neurosci. 2000;17:463–471. doi: 10.1017/s0952523800173122. [DOI] [PubMed] [Google Scholar]
- 14.Zeng H.Y., Green W.R., Tso M.O. Microglial activation in human diabetic retinopathy. Arch Ophthalmol. 2008;126:227–232. doi: 10.1001/archophthalmol.2007.65. [DOI] [PubMed] [Google Scholar]
- 15.Combadiere C., Feumi C., Raoul W., Keller N., Rodero M., Pezard A., Lavalette S., Houssier M., Jonet L., Picard E., Debre P., Sirinyan M., Deterre P., Ferroukhi T., Cohen S.Y., Chauvaud D., Jeanny J.C., Chemtob S., Behar-Cohen F., Sennlaub F. CX3CR1-dependent subretinal microglia cell accumulation is associated with cardinal features of age-related macular degeneration. J Clin Invest. 2007;117:2920–2928. doi: 10.1172/JCI31692. [DOI] [PMC free article] [PubMed] [Google Scholar]
- 16.Xu H., Chen M., Manivannan A., Lois N., Forrester J.V. Age-dependent accumulation of lipofuscin in perivascular and subretinal microglia in experimental mice. Aging Cell. 2008;7:58–68. doi: 10.1111/j.1474-9726.2007.00351.x. [DOI] [PubMed] [Google Scholar]
- 17.Meleth A.D., Agron E., Chan C.C., Reed G.F., Arora K., Byrnes G., Csaky K.G., Ferris F.L., 3rd, Chew E.Y. Serum inflammatory markers in diabetic retinopathy. Invest Ophthalmol Vis Sci. 2005;46:4295–4301. doi: 10.1167/iovs.04-1057. [DOI] [PubMed] [Google Scholar]
- 18.Gaucher D., Chiappore J.A., Paques M., Simonutti M., Boitard C., Sahel J.A., Massin P., Picaud S. Microglial changes occur without neural cell death in diabetic retinopathy. Vision Res. 2007;47:612–623. doi: 10.1016/j.visres.2006.11.017. [DOI] [PubMed] [Google Scholar]
- 19.Kern T.S. Contributions of inflammatory processes to the development of the early stages of diabetic retinopathy. Exp Diabetes Res. 2007;2007:95103. doi: 10.1155/2007/95103. [DOI] [PMC free article] [PubMed] [Google Scholar]
- 20.Xu H., Chen M., Mayer E.J., Forrester J.V., Dick A.D. Turnover of resident retinal microglia in the normal adult mouse. Glia. 2007;55:1189–1198. doi: 10.1002/glia.20535. [DOI] [PubMed] [Google Scholar]
- 21.Ma W., Zhao L., Fontainhas A.M., Fariss R.N., Wong W.T. Microglia in the mouse retina alter the structure and function of retinal pigmented epithelial cells: a potential cellular interaction relevant to AMD. PLoS One. 2009;4:e7945. doi: 10.1371/journal.pone.0007945. [DOI] [PMC free article] [PubMed] [Google Scholar]
- 22.Krady J.K., Basu A., Allen C.M., Xu Y., LaNoue K.F., Gardner T.W., Levison S.W. Minocycline reduces proinflammatory cytokine expression, microglial activation, and caspase-3 activation in a rodent model of diabetic retinopathy. Diabetes. 2005;54:1559–1565. doi: 10.2337/diabetes.54.5.1559. [DOI] [PubMed] [Google Scholar]
- 23.Millan J., Hewlett L., Glyn M., Toomre D., Clark P., Ridley A.J. Lymphocyte transcellular migration occurs through recruitment of endothelial ICAM-1 to caveola- and F-actin-rich domains. Nat Cell Biol. 2006;8:113–123. doi: 10.1038/ncb1356. [DOI] [PubMed] [Google Scholar]
- 24.Carman C.V., Springer T.A. A transmigratory cup in leukocyte diapedesis both through individual vascular endothelial cells and between them. J Cell Biol. 2004;167:377–388. doi: 10.1083/jcb.200404129. [DOI] [PMC free article] [PubMed] [Google Scholar]
- 25.Yang L., Froio R.M., Sciuto T.E., Dvorak A.M., Alon R., Luscinskas F.W. ICAM-1 regulates neutrophil adhesion and transcellular migration of TNF-alpha-activated vascular endothelium under flow. Blood. 2005;106:584–592. doi: 10.1182/blood-2004-12-4942. [DOI] [PMC free article] [PubMed] [Google Scholar]
- 26.Marmon S., Hinchey J., Oh P., Cammer M., de Almeida C.J., Gunther L., Raine C.S., Lisanti M.P. Caveolin-1 expression determines the route of neutrophil extravasation through skin microvasculature. Am J Pathol. 2009;174:684–692. doi: 10.2353/ajpath.2009.080091. [DOI] [PMC free article] [PubMed] [Google Scholar]
- 27.de Kozak Y., Omri B., Smith J.R., Naud M.C., Thillaye-Goldenberg B., Crisanti P. Protein kinase Czeta (PKCzeta) regulates ocular inflammation and apoptosis in endotoxin-induced uveitis (EIU): signaling molecules involved in EIU resolution by PKCzeta inhibitor and interleukin-13. Am J Pathol. 2007;170:1241–1257. doi: 10.2353/ajpath.2007.060236. [DOI] [PMC free article] [PubMed] [Google Scholar]
- 28.Banan A., Zhang L., Fields J.Z., Farhadi A., Talmage D.A., Keshavarzian A. PKC-zeta prevents oxidant-induced iNOS upregulation and protects the microtubules and gut barrier integrity. Am J Physiol Gastrointest Liver Physiol. 2002;283:G909–G922. doi: 10.1152/ajpgi.00143.2002. [DOI] [PubMed] [Google Scholar]
- 29.Park C.W., Kim J.H., Lee J.H., Kim Y.S., Ahn H.J., Shin Y.S., Kim S.Y., Choi E.J., Chang Y.S., Bang B.K. High glucose-induced intercellular adhesion molecule-1 (ICAM-1) expression through an osmotic effect in rat mesangial cells is PKC-NF-kappa B-dependent. Diabetologia. 2000;43:1544–1553. doi: 10.1007/s001250051567. [DOI] [PubMed] [Google Scholar]
- 30.Du Y., Sarthy V.P., Kern T.S. Interaction between NO and COX pathways in retinal cells exposed to elevated glucose and retina of diabetic rats. Am J Physiol Regul Integr Comp Physiol. 2004;287:R735–R741. doi: 10.1152/ajpregu.00080.2003. [DOI] [PubMed] [Google Scholar]
- 31.Abu El-Asrar A.M., Desmet S., Meersschaert A., Dralands L., Missotten L., Geboes K. Expression of the inducible isoform of nitric oxide synthase in the retinas of human subjects with diabetes mellitus. Am J Ophthalmol. 2001;132:551–556. doi: 10.1016/s0002-9394(01)01127-8. [DOI] [PubMed] [Google Scholar]
- 32.Du Y., Smith M.A., Miller C.M., Kern T.S. Diabetes-induced nitrative stress in the retina, and correction by aminoguanidine. J Neurochem. 2002;80:771–779. doi: 10.1046/j.0022-3042.2001.00737.x. [DOI] [PubMed] [Google Scholar]
- 33.Kowluru R.A., Engerman R.L., Kern T.S. Abnormalities of retinal metabolism in diabetes or experimental galactosemia VIII: Prevention by aminoguanidine. Curr Eye Res. 2000;21:814–819. doi: 10.1076/ceyr.21.4.814.5545. [DOI] [PubMed] [Google Scholar]
- 34.Kowluru R.A. Retinal metabolic abnormalities in diabetic mouse: comparison with diabetic rat. Curr Eye Res. 2002;24:123–128. doi: 10.1076/ceyr.24.2.123.8158. [DOI] [PubMed] [Google Scholar]
- 35.Kowluru R.A. Effect of reinstitution of good glycemic control on retinal oxidative stress and nitrative stress in diabetic rats. Diabetes. 2003;52:818–823. doi: 10.2337/diabetes.52.3.818. [DOI] [PubMed] [Google Scholar]
- 36.Dejana E. The transcellular railway: insights into leukocyte diapedesis. Nat Cell Biol. 2006;8:105–107. doi: 10.1038/ncb0206-105. [DOI] [PubMed] [Google Scholar]
- 37.Rahman A., Fazal F. Hug tightly and say goodbye: role of endothelial ICAM-1 in leukocyte transmigration. Antioxid Redox Signal. 2009;11:823–839. doi: 10.1089/ars.2008.2204. [DOI] [PMC free article] [PubMed] [Google Scholar]
- 38.Camelo S., Lajavardi L., Bochot A., Goldenberg B., Naud M.C., Fattal E., Behar-Cohen F., de Kozak Y. Ocular and systemic bio-distribution of rhodamine-conjugated liposomes loaded with VIP injected into the vitreous of Lewis rats. Mol Vis. 2007;13:2263–2274. [PMC free article] [PubMed] [Google Scholar]
- 39.Oka N., Yamamoto M., Schwencke C., Kawabe J., Ebina T., Ohno S., Couet J., Lisanti M.P., Ishikawa Y. Caveolin interaction with protein kinase C: Isoenzyme-dependent regulation of kinase activity by the caveolin scaffolding domain peptide. J Biol Chem. 1997;272:33416–33421. doi: 10.1074/jbc.272.52.33416. [DOI] [PubMed] [Google Scholar]
- 40.Wang A.L., Yu A.C., He Q.H., Zhu X., Tso M.O. AGEs mediated expression and secretion of TNF alpha in rat retinal microglia. Exp Eye Res. 2007;84:905–913. doi: 10.1016/j.exer.2007.01.011. [DOI] [PubMed] [Google Scholar]
- 41.Rungger-Brandle E., Dosso A.A., Leuenberger P.M. Glial reactivity, an early feature of diabetic retinopathy. Invest Ophthalmol Vis Sci. 2000;41:1971–1980. [PubMed] [Google Scholar]
- 42.Li J, Jin HB, Sun YM, Su Y, Wang LF: KB-R7943 inhibits high glucose-induced endothelial ICAM-1 expression and monocyte-endothelial adhesion. Biochem Biophys Res Commun 392:516–519 [DOI] [PubMed]
- 43.Hirano Y, Sakurai E, Matsubara A, Ogura Y: Suppression of ICAM-1 in retinal and choroidal endothelial cells by plasmid small-interfering RNAs in vivo. Invest Ophthalmol Vis Sci 51:508–515 [DOI] [PubMed]
- 44.Marmon S., Hinchey J., Raine C.S., Lisanti M.P. Chemokine transport and leukocyte extravasation through dermal microvasculature in the absence of caveolae. J Dermatol Sci. 2009;53:225–228. doi: 10.1016/j.jdermsci.2008.09.006. [DOI] [PubMed] [Google Scholar]
- 45.Mantovani A., Sica A., Sozzani S., Allavena P., Vecchi A., Locati M. The chemokine system in diverse forms of macrophage activation and polarization. Trends Immunol. 2004;25:677–686. doi: 10.1016/j.it.2004.09.015. [DOI] [PubMed] [Google Scholar]
- 46.Gopalakrishnan S., Hallett M.A., Atkinson S.J., Marrs J.A. aPKC-PAR complex dysfunction and tight junction disassembly in renal epithelial cells during ATP depletion. Am J Physiol Cell Physiol. 2007;292:C1094–C1102. doi: 10.1152/ajpcell.00099.2006. [DOI] [PubMed] [Google Scholar]
- 47.Etienne-Manneville S., Hall A. Cell polarity: par6, aPKC and cytoskeletal crosstalk. Curr Opin Cell Biol. 2003;15:67–72. doi: 10.1016/s0955-0674(02)00005-4. [DOI] [PubMed] [Google Scholar]
- 48.Fox T.E., Houck K.L., O'Neill S.M., Nagarajan M., Stover T.C., Pomianowski P.T., Unal O., Yun J.K., Naides S.J., Kester M. Ceramide recruits and activates protein kinase C zeta (PKC zeta) within structured membrane microdomains. J Biol Chem. 2007;282:12450–12457. doi: 10.1074/jbc.M700082200. [DOI] [PubMed] [Google Scholar]
- 49.Aveleira CA, Lin CM, Abcouwer SF, Ambrosio AF, Antonetti DA: TNF-alpha signals through PKCzeta/NF-kappaB to alter the tight junction complex and increase retinal endothelial cell permeability. Diabetes 59:2872–2882 [DOI] [PMC free article] [PubMed]
Associated Data
This section collects any data citations, data availability statements, or supplementary materials included in this article.